In 1870 the extraction and primary processing of Canada's energy, fish, forest, and mineral resources contributed nearly 14 percent to domestic GNP. Including a rough estimate of the income generated by industries engaged in secondary processing activities in 1870 increases resource producers' contribution to Canadian GNP by an additional 9 percent. If we extend our definition of resource-intensive production even further to include agriculture, then as much as 76 percent of the value of all domestic economic activity in 1870 was directly attributable to the extraction and processing of Canada's natural resource endowment.1
The resource industries' 1870 GNP contributions have been calculated from Inwood and Irwin, “Canadian Regional Commodity Income Differences,” table 2; and Urquhart, Gross National Product, table 1.12.
In contrast, the historiography of more recent Canadian development, and modern macroeconomic growth literature, has become increasingly dismissive of the “resources as an engine of growth” view. Again, some of the stylized facts offer support for a more pessimistic interpretation of the role played by resource industries in Canada's twentieth-century economy. As early as 1900, 22 percent of Canadian GNP originated in manufacturing industries, 35 percent of the population resided in an urban center with 1,000 inhabitants or more, and Canada ranked fifth in the world in terms of real GDP per capita—just behind New Zealand, but ahead of Belgium, France, Germany, and the Netherlands.2
The urban population figures can be found in Canadian Historical Statistics, First Edition, Series A18. The real G.D.P. per capita rankings have been adjusted for cross country price and currency differences by Prados de la Escosura, “International Comparisons,” table 9.
In this article I present empirical evidence that leads me to conclude that the concentration of substantial quantities of labor and capital in Canada's natural resource industries not only did not constrain the rate of change in real GNP per capita over the twentieth century, but this concentration made a considerable positive contribution to the level of real GNP per capita. The first piece of evidence reveals that Canada's energy, fishing, forestry, and mining industries did not decline into insignificance after 1900. In 1999 these four sectors still employed 6 percent of the Canadian workforce, they housed 17 percent of Canada's fixed capital, and they generated 12 percent of Canada's GNP. These direct contributions were trending upwards at the very end of the century and they compare favorably with the contributions that were being made by the other goods-producing sectors in the economy. The second piece of evidence indicates that the natural resource industries in Canada did not suffer from relatively low total factor productivity (TFP) growth rates, nor did they comprise a low productivity sector. Between 1900 and 1999 Canada's resource industries enjoyed TFP growth rates that were virtually identical to those for the aggregate economy and the agricultural sector, considerably higher than that for the service sector, and only slightly lower than that for non-resource-intensive manufacturers.3
Throughout this article “non-resource-intensive manufacturing” refers to total manufacturing less those energy, fishing, forestry, and mining industries that have been classified as manufacturing. The “service sector” refers to residual economic activity, calculated as the aggregate economy less all manufacturing industries, resource industries, and agriculture.
To assess exactly how substantial the resource industries' role in the twentieth-century economy was, I have performed a simple back-of-the-envelope counterfactual exercise. In this exercise I ask: “What would twentieth-century Canadian real GNP per capita have been in the absence of any resource extraction or processing activity?” After removing an approximation of annual resource rents from domestic GNP, and removing the impact of resource industry production on Canadian resource-intensive intermediate input prices, non-resource-intensive manufacturing output, and service sector output, I derive counterfactual Canadian real GNP per capita for every year between 1900 and 1999. In the absence of resource-intensive production, the counterfactual exercise indicates that real GNP per capita would have grown at virtually the same rate that is observed in the actual data: 2.07 percent versus 2.01 percent per year, respectively. The exercise also reveals that the level of real GNP per capita would have been substantially lower throughout the century in the absence of resource-intensive production. The average ratio of counterfactual to observed real GNP per capita is just 0.823. The resource intensity of Canadian economic activity during the twentieth century, therefore, does not appear to have slowed domestic growth, but it does appear to have made a fairly dramatic positive contribution to the level of income enjoyed by the average Canadian.
RESOURCE INDUSTRIES AND ECONOMIC PERFORMANCE: A BRIEF LITERATURE REVIEW
Given the substantive role played by natural resource extraction and processing activities in the Canadian economy, at least prior to the twentieth century, it is not surprising that questions about the connection between resource endowments and economic performance have motivated a particularly rich vein of research within Canadian historiography. Indeed, Canadian economic historians have been largely responsible for both the formal identification of the channels through which resource-intensive production may foster industrial expansion and diversification, and some of the more compelling expositions of the collapse of these channels in modern, industrial economic environments.
W. A. Mackintosh, Harold Innis, A. R. M. Lower, Melvin Watkins, Gordon Bertram, and Douglass North, among others, all made seminal contributions to the formulation of a model of economic growth that describes how a resource rich, but labor- and capital-poor economy may industrialize around a resource base.4
Mackintosh, “Economic Factors” and Economic Problems; Innis, Fur Trade and Cod Fisheries; Lower, “Trade”; Watkins, “Staple Theory”; Bertram, “Economic Growth”; and North, Economic Growth.
The staples thesis continues to be widely accepted as a tool capable of describing economic development among nations that have yet to experience rapid, modern, industrial growth.5
More recently the staples thesis has been applied in a multinational context by Jones, Growth; and in a Canadian context by Nelles, Politics; and McCallum, Unequal Beginnings.
Habakkuk, American and British Technology; Allen, “Peculiar Productivity History”; James and Skinner, “Resolution”; Cain and Paterson, “Biased Technological Change”; and Wright, “Origins.”
Fowke, National Policy.
Easterbrook, “Recent Contributions,” p. 76.
Buckley, “Role.”
Aitken, “Discussion.”
The idea that resource industries may be irrelevant in rich, industrial economies is, of course, not exclusively Canadian, nor confined to the writings of economic historians. Robert Gordon, for example, claims that the United States experienced more rapid growth than its European competitors up to 1913 due to resource advantages, but thereafter the gap between the United States and Europe continued to widen due to “technological advantages” alone.11
Gordon, “Two Centuries,” p. 2.
Gordon, “Has the New Economy” and “Does the New Economy”; and Nordhaus, “Productivity Growth,” “Retrospective,” and “Sources.”
Nordhaus, “Productivity Growth,” pp. 205, 212 and table 3. Copeland, “Services,” suggests that the stylized facts regarding Canadian productivity performance during the post-1970 era are very similar to those Gordon and Nordhaus describe for the United States.
Although their work is based on a very different methodological and theoretical approach, Jeffrey Sachs and Andrew Warner, Sachs and Francisco Rodriguez, and Richard Auty have also come to the conclusion that, at least in our contemporary economic environment, the concentration of labor and capital in resource-intensive production may be a serious constraint on economic performance.14
Sachs and Warner, “Natural Resource Abundance,” “Source,” “Big Push,” and “Natural Resources”; Sachs and Rodriguez, “Why Do Resource Abundant Economies”; and Auty, “Political Economy.”
There is an on-going debate regarding the importance of this curse. Boyce and Emery, “Hotelling Explanation”; and Wright and Czelusta, “Myth,” for example, have argued that the negative relationship between income growth and resource intensity is no curse, but it is instead consistent with standard models of neo-classical growth and optimal nonrenewable resource extraction.
What does this very brief review of the resource-based growth literature imply about the importance of resource extraction and processing industries to the Canadian economy during the twentieth century? In one form or another much of the more recent work suggests that these industries have not made substantive direct or indirect economic contributions since the earliest years of the century, they comprise a low productivity sector that has retarded growth, and they long ago abandoned their role as a leading sector in the economy. Despite this rather pessimistic interpretation of the role played by resource exploitation, the empirical evidence presented in this article illustrates the need to exercise some caution before dismissing energy, fishing, forestry, and mining industries as insignificant in diversified, urban, and industrial nations.
DATA COMPILATION, CONSTRUCTION, AND COMPOSITION
By the end of the twentieth century information about Canadian natural resource industries was categorized and organized in a complete and transparent manner using well-documented systems such as the Standardized Industrial Classification System, or most recently the North American Industrial Classification System. However, prior to 1948 Canadian data were published under census categories that were originally established in the late nineteenth century on the basis of the characteristics of establishments' primary output products. In an effort to accommodate changes in the composition of the industry-specific series used in this article, I began with the categorization of four natural resource sectors—energy, fishing, forestry, and mining—currently employed by Natural Resources Canada and the Canadian Department of Fisheries and Oceans, and I then reconstructed these sectoral categories back through the twentieth century using the most disaggregate industry specific data available. Where this reconstruction was impossible, I dropped the industry or series from the study. Where there have been concerns about the consistency of the industrial composition, I have attempted to collect as much overlapping data as possible to facilitate the construction of an adjustment factor to account for potential changes in composition.
Given the attention that Canadian economic historians have lavished on domestic agricultural production, particularly western wheat production between 1896 and 1914, and given the intensity of land use in the production of agricultural products, it may seem odd that agriculture has not been included as a resource sector in this study. Because the original articulation of the staples thesis clearly did not consider agriculture a staple resource, because agriculture's role as a staple largely pre-dates the twentieth century, and because of the dramatic differences in the production processes involved in agriculture relative to energy, fishing, forestry, and mining—namely the lower capital intensity, the more dispersed production locations, the differences in ownership characteristics, the differences in export intensity, and the absence of industrial linkages—it does not seem unreasonable to leave the assessment of agriculture's role in twentieth-century Canadian development for a subsequent study. Other exclusions that may be noteworthy from our contemporary perspective include pipelines, electricity generation, and electricity distribution. Although there are good theoretical reasons for excluding these industries—namely their role as a substitute for transportation services in the case of pipelines, and their public rather than private ownership and operation in the case of electricity—the absence of consistent data for the first half of the century makes their inclusion undesirable for more practical reasons as well.
Virtually all natural resource industries have been, at least to some extent, vertically integrated. This implies that almost every industry has been involved in the extraction of resources from the physical environment, the primary processing of resources into intermediate inputs, and the secondary processing that prepares resources for final consumption. By again adopting the categorization currently employed by Natural Resources Canada and the Canadian Department of Fisheries and Oceans, I have further disaggregated the industry groups based on their dominant role in the transformation of in situ natural resources into intermediate inputs or goods intended for final consumption. For each industry group, therefore, I have identified three subgroups: extraction, primary processing, and secondary processing.
For the aggregate Canadian economy, the agricultural sector, the manufacturing sector, the service sector (and various less aggregated components of these sectors), and for ten resource-sector, stage-of-production aggregates (there are no secondary production industries in the energy or fishing sectors), I have constructed an estimate of the number of employees, the fixed capital stock, value added, and the share of value added paid to labor and capital for every year between 1900 and 1999.16
All results have been generated using two fixed capital measures—the fixed capital figures provided by the Dominion Bureau of Statistics and Statistics Canada at the industry level, and total income paid to capital owners, deflated by a capital cost index. The total income paid to capital owners has been calculated as value added less wages and salaries, and the capital cost index includes a purchase price index for capital, real interest rates, and a 10 percent depreciation rate. On average over the 1900–1999 period the two fixed capital series differ by less than 4 percent. Virtually all of this differential originates in the first quarter century. Value added has been measured as the gross value of shipments less taxes and the cost of all intermediate inputs (including all raw materials, services, and fuel). A complete data appendix, including sources, construction details, interpolation techniques, and a complete description of the composition of each industry, sector, and level of processing is available from the author.
Urquhart, Gross National Product.
DIRECT AND INDIRECT ECONOMIC CONTRIBUTIONS
When looking to identify both direct and indirect economic contributions made by resource-intensive producers, the staples thesis—as modeled by Watkins and North—provides some guidance.18
Watkins, “Staple Theory”; and North, Economic Growth.
For each year between 1900 and 1999 I have calculated the proportion of Canadian GNP, aggregate employment, and the aggregate fixed capital stock that can be attributed to those industries engaged in the extraction, primary processing, and secondary processing of Canada's energy, fish, forest, and mineral resource endowments. I have compared these direct contributions to those made by non-resource-intensive manufacturing industries, agricultural producers, and service sector industries. I have also calculated the annual rate of change in TFP for each year between 1900 and 1999 for all four resource sectors at each stage of production, and I have compared the level of TFP generated by these producers to the level of TFP generated by non-resource-intensive manufacturers, agricultural producers, service sector industries, and the aggregate economy. To identify indirect contributions I have performed standard Granger causality tests to check for a statistical relationship between past changes in resource industries' output levels, and current changes in domestic resource-intensive intermediate input prices, non-resource-intensive manufacturing output, and service sector output.
Direct Contributions: Output, Employment, and Capital
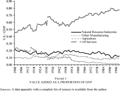
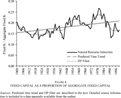
In Figure 1 the share of GNP generated by resource industries, non-resource-intensive manufacturing industries, agriculture, and service industries have been plotted annually over the twentieth century. We can see that the contribution to GNP made by agriculture fell steadily over the century, with the only lull in the rate of decline spanning the period between the mid-1930s and the early 1950s. Non-resource-intensive manufacturing industries increased their contribution to GNP over the first half of the century, but their share fell all the way back to its 1900 level by the end of the century. The service sector has not only been much larger than the other sectors in the economy during the twentieth century, it steadily increased its contribution to GNP, particularly over the post–World War II period. The output contributions made by agriculture, non-resource-intensive manufacturing, and services have been included in Figure 1 for comparative purposes. In particular I wish to emphasize that relative to the other goods producing sectors, the resource industries consistently generated a large share of aggregate GNP throughout the twentieth century. This persistence in the resource industries' large output shares suggests continued, if not necessarily increasing, relevance in the post-1900 Canadian economic environment.

FIGURE 1 VALUE ADDED AS A PROPORTION OF GNP
The greatest contribution resource industries made to domestic output over the twentieth century came in 1900, when 22.3 percent of Canada's GNP was generated by energy, fishing, forestry, and mining industries. The smallest contribution to domestic output came in 1991, when only 10.2 percent of Canada's GNP was generated by the resource producers. On average between 1900 and 1999 energy, fishing, forestry, and mining industries generated 16.7 percent of domestic GNP, but their output contribution fell by a (statistically significant) average of 0.25 percent per year between 1900 and 1999. By comparison, between 1900 and 1999 non-resource-intensive manufacturers' average contribution to GNP was just 10.8 percent, agriculture averaged only 9.6 percent, and the service sector contributed the remaining 62.9 percent.
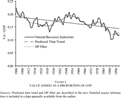
If we compare the resource industries' annual output shares against the estimated linear time trend depicted in Figure 2, it appears that there were extended periods during which the series lies above, and subsequently below the long-run trend. This pattern in the deviations from the trend suggests cyclical movements in the resource industries' GNP contributions. To isolate the cycles that appear to be present in the data I have used a Hodrick-Prescott filter to decompose the series into its stationary and nonstationary components. The nonstationary, or smoothed, component of the resource industries' output shares (labeled “HP Filter” in Figure 2) illustrates these longer-run cyclical movements.19
Other smoothing techniques, including the calculation of unweighted moving averages, the estimation of ARIMA processes, and the estimation of higher order polynomial time trends have no substantive impact on the qualitative conclusions discussed in this section.

FIGURE 2 VALUE ADDED AS A PROPORTION OF GNP
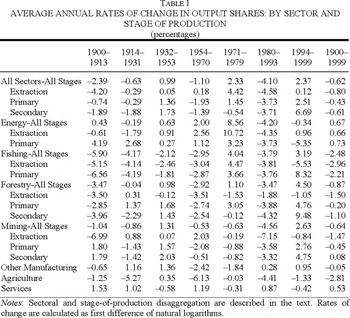
Of course, when we consider all resource industries as a group many of the more interesting chronological patterns are obscured as a result of aggregation. To hint at the rich stories that could be told about sectoral, stage of production, and (by implication) regional growth and contraction, in Table 1 I report the average annual percentage change in the proportion of GNP generated by natural resource industries disaggregated by sector and stage of production for the periods of cyclical contraction (1900–1913, 1954–1970 and 1980–1993), stability (1914–1931), and expansion (1932–1953 and 1994–1999). For comparative purposes I also include the change in the output shares for each of these periods for non-resource-intensive manufacturing, agriculture, and service industries.

The earliest period of decline in the natural resource industries' contribution to aggregate output (1900–1913) appears to have been concentrated among the extraction industries, particularly in forestry and mining.20
With the exception of the 1970s and 1990s, fishing industries substantially under-performed relative to their resource industry counterparts and the economy in general. Because fishing generated such a small proportion of the output of all four resource sectors combined (3.96 percent on average) their particularly poor performance explains little of the movement in the all sectors-all stages output share.
Growth in forestry's extraction and primary processing industries was concentrated in the 1913–1920 subperiod. This subperiod coincides with the removal of U.S. tariffs on Canadian newsprint imports, and the introduction of pneumatic tires and chain saws in British Columbia. These exogenous shocks to the forestry sector led to a short-lived boom among saw, pulp, and paper mills. For a much more detailed discussion see Dick, “Canadian Newsprint”; and Marchak, Green Gold.
The improvement in mining industries' output shares is not surprising given the discovery and initial exploitation of a wide range of metallic and nonmetallic minerals that began in northern Ontario and northern Quebec during the second quarter of the twentieth century. For more detailed discussion of this mining boom see Cranstone, History; or Norrie, Owram, and Emery, History, chapter 12.
The rise of Alberta's petroleum industry following the 1947 discovery of economically viable reserves is described in detail by Hanson, Dynamic Decade.
Because Canadian resource producers export such a large proportion of their output to the United States, and due to the relatively bulky nature of resource products, reductions in trade costs or currency depreciation should have a substantial impact on the production of resource-intensive goods. As a result, the late-twentieth-century resource boom may have been related to the federal government's monetary and trade policies that were implemented during the late 1980s and early 1990s.
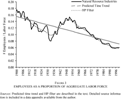
Income generation is not the only direct contribution that resource industries made to the twentieth-century Canadian economy. In Figure 3 we can see that the energy, fishing, forestry, and mining industries' contribution to aggregate employment peaked in 1900 at 17.6 percent, and reached a minimum in 1995, when only 5.8 percent of Canada's workers were employed in resource industries. On average between 1900 and 1999 resource industries employed 11.3 percent of the total Canadian workforce, and like their contribution to GNP, their employment share fell by a (statistically significant) average of 0.55 percent per year over the entire period. For comparison note that between 1900 and 1999 non-resource-intensive manufacturers employed 11.3 percent of the total Canadian workforce, while agriculture employed 20.4 percent, and the service industries employed the remaining 57.6 percent, on average. Although they are broadly similar, the cyclical patterns in the resource industries' employment shares appear both more dramatic and more persistent than those observed for the output shares, with a contractionary phase from the start of the century until the mid-1930s, expansion from the mid-1930s until the early 1950s, and a long decline through the last half of the century that slowed substantially during the 1990s (See Figure 3).

FIGURE 3 EMPLOYEES AS A PROPORTION OF AGGREGATE LABOR FORCE
During the twentieth century Canadian resource industries were considerably more capital intensive than their manufacturing or service sector counterparts, and only slightly less capital intensive than the agricultural sector. The relative capital intensity of resource production actually increased between 1900 and 1999, not only because these industries were producing a smaller share of total output, but because they were increasing their share of the aggregate capital stock. From Figure 4 we can see that in 1900 20.3 percent of Canada's fixed capital was housed in the resource sectors. Their smallest contribution to the aggregate capital stock was in 1921 at just 12.2 percent, and their largest contribution came in 1979 at 26.6 percent. On average between 1900 and 1999 the resource industries housed 18.1 percent of the total fixed capital in Canada, and this share rose by an average of 0.06 percent per year over the entire period. For fixed capital we can estimate a statistically significant positive linear time trend through the data series. For comparison note that between 1900 and 1999 non-resource-intensive manufacturers housed 4.8 percent of Canada's aggregate capital stock, agricultural producers housed 15.6 percent, and the service industries housed the remaining 61.5 percent, on average. Similar to the chronological patterns we observe among the resource industries' output and employment shares, we can again see contraction in their contribution to the aggregate fixed capital stock during the first quarter of the twentieth century, expansion during the second quarter and into the third quarter, followed by another sharp contraction over much of the last half of the century, interrupted by a brief period of growth (driven by an investment boom among energy extraction industries) from the mid-1960s until the mid-1970s.

FIGURE 4 FIXED CAPITAL AS A PROPORTION OF AGGREGATE FIXED CAPITAL
Consideration of Table 1 and Figures 1–4 suggests that Canada's natural resource industries were responsible for substantial shares of domestic output, employment, and investment, but these shares were not chronologically nor cross-sectionally uniform. After 1930 Canada's energy, fishing, forestry, and mining industries accounted for a greater proportion of GNP, aggregate employment, and the aggregate fixed capital stock than all other goods producing sectors. In terms of the absolute size of their direct contributions, these industries appear to have been playing a substantial role in the economy throughout the entire twentieth century.
Direct Contributions: Productivity Performance
An alternate approach to the assessment of the resource industries' direct contributions to Canada's wealthy, industrialized, diversified, and urbanized twentieth-century economy is to consider these contributions in terms of productivity performance, rather than absolute size. Proponents of the resource curse and those who have emphasized the importance of new economy industries have suggested that labor and capital employed in resource-intensive industries could contribute more to the size and development of an economy if they were redistributed into other sectors that are more conducive to growth. It seems, therefore, that any questions about the importance of resource industries' direct contributions may not necessarily be about the number of workers or amount of capital they employ, but rather the amount of output produced by these workers and machines relative to what they could have produced in other sectors in the economy.
To measure the resource industries' relative efficiency I have used a Tornqvist total factor productivity index to compare TFP levels across sectors and across time. The Tornqvist index relies on the assumption that production processes may be described by a translog production function—a superlative and flexible functional form, as defined by W. Erwin Diewert.
25Diewert, “Exact and Superlative Index Numbers.” For empirical illustrations of the use of Tornqvist TFP measures see Allen, “Recent Developments”; or Keay, “Canadian Manufacturers' Relative Productivity Performance.”

where: A equals Hicks neutral total factor productivity parameter; VA equals value added; L equals employment; K equals fixed capital stock; sL = (wL · L) / VA; sK = 1 − sL; t equals 1900–1999; and i, j equals energy, fishing, forestry, mining, non-resource-intensive manufacturing, agriculture, services, or the aggregate economy.
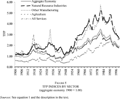
Figure 5 illustrates the Tornqvist TFP index for the aggregate economy, the natural resource industries, the non-resource-intensive manufacturing industries, the agricultural sector, and the service sector for the years 1900–1999, with the aggregate economy in 1900 representing the base year and sector. This implies that the aggregate economy's index takes the value 1.00 in 1900, and all other sectors' TFP has been measured relative to this base value in each year. We can see that Canada's resource industries experienced fairly rapid TFP growth through the twentieth century, peaking at an average annual rate of 6.78 percent during the 1950s, and maintaining a long-run average growth rate of 0.68 percent per year over the full 1900–1999 period.26
If I use a geometric index, rather than the Tornqvist index, the average annual rate of growth of the resource industries' TFP increases from 0.68 percent to 0.82 percent. If I use a Laspeyres index the average annual rate of growth increases to 0.97 percent, whereas a Paasche index lowers the average annual rate of TFP growth to 0.61 percent, and a Fischer Ideal index generates an average annual percentage change of 0.81 percent. The resource industries also enjoyed very rapid labor productivity growth between 1900 and 1999—averaging 2.26 percent per year—just 0.03 percent slower than non-resource-intensive manufacturing and 0.68 percent faster than the aggregate economy.

FIGURE 5 TFP INDICES BY SECTOR (aggregate economy 1900 = 1.00)
Because the aggregate economy in 1900 has been used as the base year and sector in Figure 5, the series depicted also reveal information about the relative productivity performance of each sector. More specifically, the position of each sector's series in Figure 5 indicates the relative level of that sector's TFP. We can see that the resource industries enjoyed TFP levels that were consistently in excess of the aggregate economy, the service sector and agriculture, whereas their ability to generate output from a given combination of inputs was approximately equal to that of non-resource-intensive manufacturing. On average over the years 1900–1999 Canadian natural resource industries were 48.9 percent more efficient than the aggregate economy, 150.0 percent more efficient than agricultural producers, 40.2 percent more efficient than service sector industries, and 3.9 percent more efficient than non-resource-intensive manufacturers.
Given these TFP figures it is difficult to be very supportive of any characterization of twentieth-century Canadian resource producers that implicitly or explicitly suggests that they comprised a low productivity sector. It appears that even in the wealthy, diversified, and industrialized twentieth-century Canadian economy resource-intensive producers were not only responsible for maintaining large employment, fixed capital, and output shares, but they were also making a significant positive contribution to the level of aggregate productivity, while maintaining TFP growth rates that were slightly higher than the aggregate economy. These direct contributions were not the only channels through which resource industries were having an impact on the economy. We may now turn to the third piece of empirical evidence that highlights the persistent and substantive economic role played by these industries.
Indirect Contributions: Granger Causality Tests
Again I turn to the staples thesis to help identify the indirect channels through which resource-intensive production could have had an impact on the Canadian economy. In particular, the thesis suggests that resource extraction and processing activities may foster diversification into other considerably less resource-intensive industries through the formation of “linkages.” Following Easterbrook and Aitken, Watkins, and North, we may be quite specific about the operation of these linkages: an increase in the production of resource-intensive goods may exert downward pressure on (at least) the domestically idiosyncratic component of resource-intensive intermediate input prices.27
Easterbrook and Aitken, Canadian Economic History; Watkins, “Staple Theory”; and North, Economic Growth.
The objective of this article is not to formally test the validity of the staples thesis, or even to formally test for the presence of forward, backward, or final demand linkages. I merely wish to determine whether Canada's twentieth-century natural resource industries comprised a leading sector, and whether the manner in which they led other economic indicators was consistent with the presence of the indirect economic contributions described by the staples thesis. In pursuit of this objective I use standard Granger causality tests which allow me to establish the strength of the statistical relationship between current changes in resource-intensive intermediate input prices, non-resource-intensive manufacturing output and service sector output, on one hand, and past changes in resource-intensive production, on the other. Evidence that changes in the output of energy, fishing, forestry, and mining industries chronologically preceded changes in the output of non-resource-intensive manufacturing industries and service industries, and changes in Canadian resource-intensive intermediate input prices is consistent with the presence of indirect economic contributions being made through forward, backward, and final demand linkages.28
Of course, this evidence may also be consistent with other explanations that are completely divorced from the staples thesis, such as the presence of shocks to international markets that affect both resource and nonresource sectors.
Granger causality tests (more accurately, Granger noncausality tests) may be used to determine if there has been a statistically significant relationship between a current variable—changes in non-resource-intensive manufacturing output, for example—and past values of another variable—changes in resource industry output, for example—even after controlling for past values of the dependent variable. In this study I am interested in the chronological relationships between changes in resource-intensive production, resource-intensive intermediate input prices, non-resource-intensive manufacturing output, and service sector output. I have constructed a reduced form, four equation, vector autoregressive system to test for Granger causality among these four variables for Canada between 1900 and 1999.
29I have used both the Schwartz criteria and the Akaike information criteria to choose optimal lag length: n = 1. Both augmented Dickey-Fuller and Phillips-Perron unit root tests confirm the stationarity of all four dependent variables with at least 99 percent confidence. The p-values reported in Table 2 have been calculated using Newey-West robust standard errors to control for the possible presence of both heteroscedasticity and autocorrelation of up to three lags among the regression residuals. To confirm parameter stability all four equations have been estimated over three subperiods (1900–1939, 1940–1970, 1971–1999). Although statistical significance is affected by the reduction in degrees of freedom, all of the parameter estimates maintain their signs, and all of the qualitative conclusions reported in this section hold across the subperiods. The econometric techniques discussed in this section have been drawn primarily from Judge et al., Theory, pp. 245–46; Greene, Econometric Analysis, p. 258; and Davidson and MacKinnon, Estimation, chapters 18 and 19. For empirical examples using similar time series techniques with Canadian data see Serletis, “Export Growth”; Green and Sparks, “Population Growth”; or Wilson, “Savings Rate Debate” and “Canadian Economic Development.”


where: ΔRQ equals the annual percentage change in value added generated by energy, fishing, forestry, and mining industries, deflated by sector-specific price indexes; ΔWM equals the annual percentage change in the domestically idiosyncratic component of the value added weighted average of wholesale price indexes for energy, fishing, forestry, and mining; ΔMQ equals the annual percentage change in value added generated by all manufacturing industries not included in the resource sectors, deflated by a sector-specific price index; ΔSQ equals the annual percentage change in value added generated by four service industries—communication, construction, finance, and transportation—deflated by a sector-specific price index; α, β, γ, and κ are vectors of parameters to be estimated; and ε equals regression residuals that have been adjusted to generate Newey-West robust standard errors.
30To isolate the changes in resource-intensive intermediate input prices that were determined by domestic, rather than international, supply and demand forces, I have simply regressed a value added weighted average of Canadian resource-intensive intermediate input price indexes on a constant, a linear time trend, and a matching index of U.S. resource-intensive intermediate input prices. The residuals from this decomposition exercise have then been used in equations 2–5 to represent the domestically unique component of resource-intensive intermediate input prices: WM. See Keay, “Scapegoats,” for more details on this procedure.
Given the nature of the final demand linkages I seek to identify, it seems reasonable to consider only the four private sector service industries. If I include a dummy variable that takes the value one for the recessionary years 1921–1923, as a control for the counter-cyclical nature of government service provision, then all of the qualitative conclusions reported in this article continue to hold even if I redefine service industries to be: total GNP less resource, manufacturing and agricultural value added; just government services; or government services plus communication, construction, finance, and transportation.

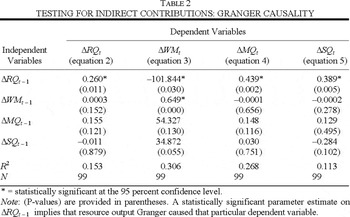
are jointly statistically significant in equations 3, 4, or 5, then I can reject the hypothesis that past changes in resource-intensive production were unrelated to current changes in resource-intensive intermediate input prices, non-resource-intensive manufacturing output, or service sector output, respectively. If I can reject these hypotheses, then I may conclude that changes in twentieth-century Canadian resource output “Granger caused” changes in the three other variables.
The parameter estimates (and p-values) from the estimation of equations 2, 3, 4, and 5 are reported in Table 2. We can see that increases in the output of energy, fishing, forestry, and mining industries in period t − 1 had a statistically significant negative impact on changes in the domestically unique component of period t resource-intensive intermediate input prices, a statistically significant positive impact on changes in period t non-resource-intensive manufacturing output, and a statistically significant positive impact on changes in period t service sector output. This implies that I can reject Granger noncausality between resource output and resource-intensive intermediate input prices, non-resource-intensive manufacturing output, and service sector output. These are exactly the statistical relationships we expect to see if the forward, backward, and final demand linkages described by the staples thesis were operative in Canada during the twentieth century.31
According to the staples thesis, past changes in international resource prices should trigger current changes in Canadian resource exploitation. If my objective in this article was to test the validity of the staples thesis, then I would include both the idiosyncratic component of domestic resource-intensive intermediate input prices and an international resource price component (WMUS in my Granger causality tests. Although I do not report the results in Table 2, when I included both the domestically unique component of resource-intensive intermediate input prices and an international resource price component as separate dependent variables in my V.A.R. system, I found that there was no change in the significance or sign on any of the parameters reported in Table 2, and there did not appear to have been any significant relationship between past changes in international resource prices and current domestic resource output. The parameter estimate on ΔWMUSt − 1 from the ΔRQt equation in this system was −0.179, with a p-value of just 0.305. This surprising result remains a topic for further research.

Based on these results, I conclude that, in addition to the persistently large direct contributions made by Canada's resource industries to output, employment, capital, and productivity, there were indirect contributions that “trickled down” to non-resource-intensive manufacturers and service industries. Of course, simply identifying large and persistent direct and indirect economic contributions does not help determine exactly how important these contributions were. Nor does this simple identification exercise help determine if the concentration of labor and capital into resource-intensive production really constrained the size and rate of growth of the Canadian economy after 1900. To answer these questions we must perform a counterfactual experiment.
ECONOMIC PERFORMANCE IN THE ABSENCE OF RESOURCE- INTENSIVE PRODUCTION: A COUNTERFACTUAL EXERCISE
To assess the importance of the resource industries' direct and indirect economic contributions I have performed a counterfactual exercise in which I estimate the size and rate of growth of the Canadian economy between 1900 and 1999 in the absence of these contributions.32
In the absence of a fully specified dynamic general equilibrium model of the twentieth-century Canadian economy there are two feasible partial equilibrium counterfactual approaches. The first, which I use in this article, estimates counterfactual real GNP per capita that results from output reductions. The second, focuses on the impact that the removal of resource-intensive production might have had on aggregate TFP, rather than output. Similar to the output counterfactual used here, this second approach would require an assumption about zero productivity growth among the resource industries, the removal of all inputs and outputs associated with the resource industry, or the redistribution of the labor and capital employed by resource producers into other lower productivity sectors. If we further assume that there are no subsequent changes to productivity in the other sectors of the economy due to the redistribution of inputs, then, as the productivity results reported in the subsection Direct Contributions: Productivity Performance foreshadow, it is not surprising to find that the results from a TFP counterfactual would be qualitatively very similar to those reported here. In particular, aggregate TFP growth would have been virtually unchanged (+ 0.04 percent), but the average level of aggregate TFP would have been considerably lower following the removal of resource extraction and processing activities from the twentieth-century Canadian economy (–14.2 percent).
To construct this estimate of the total impact that a counterfactual removal of all domestic resource-intensive production would have had on the Canadian economy I must make a series of standard (although admittedly implausible) assumptions. Wherever possible I have tried to chose assumptions that bias my estimate of the total impact of resource-intensive production on domestic GNP downwards. To determine the value of the direct contributions I follow the work of Robert Fogel, Edward Chambers and Donald Gordon, and D. McCloskey—all of whom performed very similar counterfactual exercises in which they estimated the economic importance of some sector of an economy that employed a fixed factor of production.33
Fogel, “Quantitative Approach”; Chambers and Gordon, “Primary Products”; and McCloskey, “Enclosure.”
Lewis, “Canadian Wheat Boom,” argued that the lack of a fully specified general equilibrium model led Chambers and Gordon, “Primary Products,” to substantially underestimate the economic impact of western wheat production on the Canadian economy during the “wheat boom” due to their assumption that labor demand in manufacturing and services was perfectly elastic. As Lewis points out, any wage or rental rate effects would increase the estimates of the value of the resource industries' direct contributions to the domestic economy.
Following Cherie Metcalf, resource rents may be calculated by adding government royalties and resource extraction fees to observed value added, less a counterfactual opportunity cost for labor and capital.
35Metcalf, “Resources.”

Where: R equals total resource rent; VA equals value added from resource-intensive production; T equals government revenues (taxes) from natural resource extraction and processing activities; WL* equals opportunity cost of L; WK* equals opportunity cost of K; WL equals observed payment to L; WK equals observed payment to K; L equals the number of workers employed in resource-intensive production; K equals the current nominal value of fixed capital employed in resource-intensive production.
36I assume that the opportunity cost of labor is equal to the mean annual return to labor in all non-resource-intensive sectors in each year. This implies that if we removed all resource industries from the Canadian economy, their employees would have human capital that was appropriate for employment in other sectors at the existing wage rates. It also implies that the resource industries' workers would be released into the other sectors of the counterfactual economy such that the relative employment shares of these other sectors would be unchanged.
I assume that the opportunity cost of capital is equal to Moody's AAA industrial bond yields. This implies that the natural resource industries' capital owners had access to the U.S. capital market, exchange rate volatility was fully anticipated, and the risk premia earned by the resource industries' capital owners were equal to the mean compensation for risk paid to holders of Moody's AAA industrial bonds.
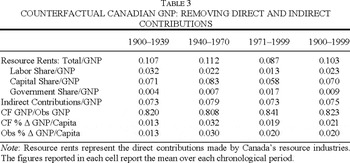
For labor, capital owners, and government, Table 3 reports my estimate of Canadian resource rents from energy, fishing, forestry, and mining industries as a proportion of GNP, averaged over three sub-periods (1900–1939, 1940–1970, 1971–1999) and over the century as a whole. We can see that although the resource rents captured by workers employed by resource-intensive producers were substantial, accounting for 22.6 percent of total resource rents and 2.3 percent of aggregate GNP on average, they were falling over each subperiod. Capital owners captured an even larger share of total rents: an average of 68.6 percent, representing 7.0 percent of aggregate GNP; but their shares also fell between 1900 and 1999, particularly over the last 30 years of the century. Between 1900 and 1999 Canadian federal and provincial governments captured only 8.8 percent of the total resource rents on average, which amounted to 0.9 percent of aggregate GNP. However, the interesting feature of the governments' rent shares is their dramatic increase beginning in the early 1970s: in 1971 Canadian governments received 8.4 percent of total domestic resource rents; by 1982 this share had risen by a factor of more than three and a half, to 29.3 percent. The increase in resource-based government revenues during the 1970s comes almost entirely from the province of Alberta, and is therefore likely due to the increased rent capture associated with petroleum extraction.

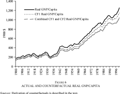
To complete the first step in my counterfactual exercise I remove my estimate of total resource rent from Canadian GNP. The resulting preliminary counterfactual GNP figures (counterfactual 1 in Figure 6) reflect the value of the domestic resource industries' direct contributions to the Canadian economy. In this counterfactual economy, mean real GNP per capita would have been 10.3 percent lower than we actually observe, and twentieth-century real GNP per capita growth would have averaged 2.01 percent per year—less than 0.01 percent higher than we actually observe.37
Although there are no directly comparable estimates of the value of total resource rents, Hanson, “Dynamic Decade,” reports that after only ten years of petroleum exploitation in Alberta, energy industries were responsible for 45 percent of all personal income in the province; Chambers and Gordon, “Primary Products,” report that in 1911 resource rent from western wheat production contributed 1.94 percent to aggregate Canadian GNP; and Di Matteo, “Fiscal Imbalance,” reports that in 1911 provincial government taxation of northern Ontario resource extraction and processing activities totaled 17.6 percent of total government revenues.

FIGURE 6 ACTUAL AND COUNTERFACTUAL REAL GNP/CAPITA
Turning to the second step in my counterfactual exercise, I attempt to quantify the value of the resource industries' indirect contributions to the Canadian economy. I wish to estimate the impact that removing resource-intensive production has on the output produced by non-resource-intensive manufacturing industries and service sector industries. As I argued in the previous section, this impact operates through a reduction in demand for non-resource-intensive manufacturing and service sector output, and an increase in the domestic component of resource-intensive intermediate input prices.
The parameter estimates from equations 2–5, in conjunction with a counterfactual 100 percent reduction in resource output, facilitate the calculation of a rough approximation of the impact that the elimination of domestic resource-intensive production might have had on the value added generated by non-resource-intensive manufacturers and service sector industries, both due to reduced resource output and increased resource-intensive intermediate input prices (counterfactual 2 in Figure 6).38
A concern with this approach is that I am using a V.A.R. system to predict output effects outside of the observed sample range. Of course a catastrophic resource collapse in 1900 is actually not that far outside of the changes in resource industry output we observe in, for example, 1921 (–21.4 percent), 1932 (–20.5 percent), or even 1982 (–13.0 percent)
As a final step I combine and remove my counterfactual 1 and 2 estimates of the direct and indirect contributions made by Canada's natural resource industries from observed GNP. The figures in Table 3 indicate that the removal of energy, fishing, forestry, and mining industries from the Canadian economy would have reduced average real GNP per capita by 17.7 percent during the twentieth century, but the rate of change in real GNP per capita would have been virtually unchanged—increasing by just 0.06 percent per year, on average. From Figure 6 we can see that the combined counterfactual real GNP per capita follows the observed real GNP per capita quite closely, gaining only slightly during the first and third quarters of the century, and subsequently falling back between 1920–1940, 1965–1980, and 1990–1999.
To put the results from this counterfactual exercise into some comparative context: according to the Penn World Tables, in 1999 Canada enjoyed the fourth highest real GNP per capita in the world—just below Norway's and just above Denmark's. If Canada had no resource-intensive production during the twentieth century, by 1999 Canadian real GNP per capita would have fallen to eighteenth in the world, just below Germany's and just above France's. Clearly the persistence of large, efficient resource extraction and processing industries not only had no detrimental effect on Canada's twentieth-century growth performance, it also seems to have made the average Canadian considerably wealthier.
SUMMARY AND CONCLUSIONS
In this article I present empirical evidence which indicates that even in a wealthy, industrial, diverse economy, such as the twentieth-century Canadian economy, resource-intensive production may make substantive direct and indirect economic contributions. Even though Canadian energy, fishing, forestry, and mining industries' contributions to aggregate employment, fixed capital, and output were falling slowly over the twentieth century, relative to the other goods-producing sectors in the economy they were maintaining and in some cases even improving their position. By the end of the twentieth century Canadian resource industries were still responsible for substantial employment, capital, and output shares. In addition, Canada's resource producers did not comprise a low productivity sector at any point during the twentieth century. In terms of TFP growth rates and TFP levels, the resource industries were approximately as productive as non-resource-intensive manufacturers, and considerably more productive than all other sectors of the economy. Finally, increases in resource output chronologically preceded reductions in resource-intensive intermediate input prices, and increases in non-resource-intensive manufacturing and service sector output. This indicates that these producers had not abandoned their role as a leading sector in the economy after 1900. When we place these direct and indirect economic contributions into an appropriate quantitative context with a simple back-of-the-envelope counterfactual exercise, we find that during the twentieth century Canadian resource industries were responsible for substantially increasing the level of domestic GNP per capita, and they in no way retarded domestic growth performance.
What can we conclude from this evidence? After 1900 Canada's urban and industrial growth does not appear to have forced the resource industries into irrelevance, and although they do not appear to have been either an “engine of growth,” nor a “caboose” slowing domestic growth, they certainly made the average twentieth-century Canadian richer.
For their detailed comments and suggestions the author wishes to thank two anonymous referees, the editor of this journal, André Bernier, Frank Lewis, Ken Norrie, and Cherie Metcalf, as well as those who participated in the economic history sessions at the 2005 C.E.A. annual meeting, the 2005 T.A.R.G.E.T. economic history workshop, and the 2005 Natural Resources Canada research report seminar series. The author gratefully acknowledges financial assistance provided by T.A.R.G.E.T. (S.S.H.R.C. I.N.E. grant # 512-2002-1005) and Natural Resources Canada - Corporate Policy and Portfolio Coordination Branch. All remaining errors and omissions remain the responsibility of the author.