
 π



1. Introduction
Modeling globular clusters (GCs) presents a significant challenge, requiring a multi-physics, multi-scale approach accounting for both the small-scale dynamics of individual stars and the large-scale influence of the surrounding environment. Notably, the collisional nature of GCs implies that frequent and close encounters between stars play a crucial role in shaping their structures. Therefore, the physical details connected to star-by-star interactions and stellar evolution cannot be neglected. For this reason, direct summation of Newtonian interactions between stars is one of the key tools employed to investigate GC evolution (see e.g., Spurzem and Kamlah Reference Spurzem and Kamlah2023). The GPU-parallel code NBODY6++GPU (Aarseth Reference Aarseth2003; Wang et al. Reference Wang, Spurzem and Aarseth2015) is commonly used for this task as it enables to simultaneously model internal dynamics, stellar evolution, and the external tidal field; but alternative methods, relaxing the assumption of direct summation, are also employed and provide accurate and fast computations (e.g. the code PeTar, Wang et al. Reference Wang, Iwasawa and Nitadori2020, and Monte Carlo methods, Hypki and Giersz Reference Hypki and Giersz2013; Giersz et al. Reference Giersz, Heggie and Hurley2013; Rodriguez et al. Reference Rodriguez, Weatherford and Coughlin2022).
On the observational side, the past decade has seen a number of key advancements that allowed us to trace GC properties in great detail. Two main breakthroughs stand out: 1) the discovery of rich kinematic properties identified in present-day Milky Way (MW) GCs and 2) the observations of GCs in the act of formation in the high-z universe.
The first achievement was enabled by precise data from space missions such as Gaia (Gaia Collaboration et al. 2018) or HST (HSTPROMO collaboration, Bellini et al. Reference Bellini, Anderson and van der Marel2014; Libralato et al. Reference Libralato, Bellini and Vesperini2022) and large spectroscopic surveys such APOGEE-2 (e.g., Szigeti et al. Reference Szigeti, Mészáros and Szabó2021) or MUSE@VLT (e.g., Kamann et al. Reference Kamann, Husser and Dreizler2018). These observations demonstrated the complexity of the internal dynamics of GCs, revealing the clear presence of internal rotation in the majority of observed GCs, both along the line of sight (e.g., Lane et al. Reference Lane, Kiss and Lewis2011; Bellazzini et al. Reference Bellazzini, Bragaglia and Carretta2012; Bianchini et al. Reference Bianchini, Varri and Bertin2013; Kacharov et al. Reference Kacharov, Bianchini and Koch2014; Fabricius et al. Reference Fabricius, Noyola and Rukdee2014; Lardo et al. Reference Lardo, Pancino and Bellazzini2015; Ferraro et al. Reference Ferraro, Mucciarelli and Lanzoni2018; Lanzoni et al. Reference Lanzoni, Ferraro and Mucciarelli2018; Kamann et al. Reference Kamann, Husser and Dreizler2018; Szigeti et al. Reference Szigeti, Mészáros and Szabó2021; Martens et al. Reference Martens, Kamann and Dreizler2023; Petralia et al. Reference Petralia, Minniti and Fernández-Trincado2024) and on the plane of the sky (e.g., Bellini et al. Reference Bellini, Bianchini and Varri2017; Bianchini et al. Reference Bianchini, van der Marel and del Pino2018; Sollima et al. Reference Sollima, Baumgardt and Hilker2019; Vasiliev Reference Vasiliev2019; Vasiliev and Baumgardt Reference Vasiliev and Baumgardt2021; Häberle et al. Reference Häberle, Neumayer and Bellini2024). The detection of these rotation signatures is typically associated with the presence of some degree of velocity anisotropy (e.g., Watkins et al. Reference Watkins, van der Marel and Bellini2015; Libralato et al. Reference Libralato, Bellini and Vesperini2022; Jindal et al. Reference Jindal, Webb and Bovy2019; Vasiliev and Baumgardt Reference Vasiliev and Baumgardt2021) and, in some cases, with the detection of kinematic differences between multiple stellar populations (e.g., Cordoni et al. Reference Cordoni, Milone and Mastrobuono-Battisti2020; Cordoni et al. Reference Cordoni, Casagrande and Milone2025; Martens et al. Reference Martens, Kamann and Dreizler2023; Dalessandro et al. Reference Dalessandro, Cadelano and Della Croce2024; Leitinger et al. Reference Leitinger, Baumgardt and Cabrera-Ziri2025).
Today we can state that at least 50% of observed MW GCs harbor some degree of internal rotation characterized by a V/
 $\sigma$
parameter (defined as the ratio between the rotational amplitude and the velocity dispersion of the cluster) that can reach non-negligible values of up
 $\sim0.9$
(e.g. the case of 47 Tuc, Bellini et al. Reference Bellini, Bianchini and Varri2017; Bianchini Reference Bianchini2020). The rotation pattern is characterized by a differential rotation profile with a peak around the half-mass radius (Bianchini et al. Reference Bianchini, van der Marel and del Pino2018). Moreover, the rotation strength is found to correlate with both the relaxation time and the total mass of a GC, in such a way that more massive (i.e. less dynamically relaxed) GCs display a higher amount of rotation (e.g. Bellazzini et al. Reference Bellazzini, Bragaglia and Carretta2012; Bianchini et al. Reference Bianchini, van der Marel and del Pino2018; Kamann et al. Reference Kamann, Husser and Dreizler2018; Leitinger et al. Reference Leitinger, Baumgardt and Cabrera-Ziri2025). This has been taken as a signature of the long term dynamical evolutions of GCs which is responsible for the dissipation of angular momentum (Einsel and Spurzem Reference Einsel and Spurzem1999; Tiongco et al. Reference Tiongco, Vesperini and Varri2017).
The second recent observational advancement–the observation of proto-GCs in the high-z universe–was instead enabled by the combination of JWST observations and strong gravitational lensing. These very recent observations have revealed the presence of several compact (
 $\lt10$
pc) and dense star clusters at redshift
 $z\gt4$
that could potentially be the progenitors of GCs (Vanzella et al. Reference Vanzella, Claeyssens and Welch2023; Adamo et al. Reference Adamo, Bradley and Vanzella2024; Mowla et al. Reference Mowla, Iyer and Asada2024). This demonstrates the important role of GCs in the high-z universe and opens the possibility of finding a direct link between the properties of GCs at formation and their properties after 13 Gyr of evolution.
This golden age of GC data is the huge motivation for developing a comprehensive theoretical framework that integrates evolutionary processes and the largely unknown formation properties, providing a foundation for interpreting their complex present-day features. In this contribution, we present our efforts in this context, focusing in particular on the development of realistic direct N-body simulations of rotating GCs and on their forward modeling to enhance model-data comparison. First, we will introduce two new suites of direct large N-body simulations: (i) a set of rotating GCs simulations (see Section 2) specifically designed to study the evolution of angular momentum and (ii) a set of initially non-rotating clumpy simulations (see Section 3) aimed at exploring how non-homogeneous initial conditions shape GC properties. Both simulation suites will be presented in forthcoming papers (Bianchini et al., in prep.). Finally, in Section 4, we will highlight recent developments in deep-learning techniques aimed at optimizing the comparison between these complex simulations and real observations, using a forward modeling approach (as presented in Chardin and Bianchini Reference Chardin and Bianchini2021 and Marklund et al., in prep.). This innovative strategy has become an essential step in response to the ever-growing volume of both data and simulations.
2. Simulations of rotating globular clusters
How does angular momentum evolve in GCs, and what role does it play in shaping their present-day structure? To answer this question we developed a set of 25 N-body models with the code NBODY6++GPU (Wang et al. Reference Wang, Spurzem and Aarseth2015), featuring a realistic number of stars ranging from 250k to 1.5M. Internal rotation is set in the initial conditions using self-consistent axisymmetric rotating models (the Varri and Bertin Reference Varri and Bertin2012 distribution function) that have been shown to reproduce the morphological and kinematic properties of observed GCs (e.g., Bianchini et al. Reference Bianchini, Varri and Bertin2013). The simulations have an initial half-mass radius of either 2 or 4 pc and are designed to reproduce the properties of low density MW GCs. They are evolved in a variety of tidal fields, with stellar evolution (Kamlah et al. Reference Kamlah, Leveque and Spurzem2022a), a metallicity of [Fe/H]=
 $-1.3$
, a Kroupa (Reference Kroupa2001) initial mass function with minimum and maximum stellar mass of 0.08 and 100 M
 $_\odot$
, and no primordial binaries. The simulations are run for 14 Gyr on NVIDIA V100 GPUs on the supercomputer Jean-Zay (GENCI-IDRIS) for a total of
 $\sim350\,000$
GPU hours. We note that direct N-body simulations with realistic number of particles still remain computationally expensive: our typical simulation with 250k stars required about 20 days with 4-16 parallel GPUs, while the largest simulation with 1.5M stars took
 $\sim400$
days with 12-48 GPUs. The environmental impact is also significant: producing these simulations resulted in a carbon footprint of
 $\sim9$
tons of CO
 $_\mathrm{2,eq}$
.Footnote †
Our simulations build upon a long line of previous works focused on modeling rotation in GCs. Efforts in this area include both direct N-body simulations (e.g., Akiyama and Sugimoto Reference Akiyama and Sugimoto1989; Fiestas and Spurzem Reference Fiestas and Spurzem2010; Kim et al. Reference Kim, Yoon and Lee2008; Hong et al. Reference Hong, Kim and Lee2013; Tiongco et al. Reference Tiongco, Vesperini and Varri2022; Livernois et al. Reference Livernois, Vesperini and Varri2022; Kamlah et al. Reference Kamlah, Spurzem and Berczik2022b; Bissekenov et al. Reference Bissekenov, Pang and Kamlah2025) and Fokker-Planck approaches (e.g., Einsel and Spurzem Reference Einsel and Spurzem1999; Kim et al. Reference Kim, Einsel and Lee2002; Fiestas et al. Reference Fiestas, Spurzem and Kim2006). Our work extends these earlier studies by developing more realistic direct N-body models, exploring a large parameter space and leveraging modern computational resources.
2.1 Visualizing the simulations: a forward modeling approach
In order to visualize the simulations, we developed a tool capable of producing mock observation images from simulation snapshots, building on our previous works in creating mock GCs observations (Bianchini et al. Reference Bianchini, Norris and van de Ven2015; Askar et al. Reference Askar, Bianchini and de Vita2017; Askar et al. Reference Askar, Giersz and Pych2018). Using the FSPS software (Conroy et al. Reference Conroy, Gunn and White2009; Conroy and Gunn Reference Conroy and Gunn2010) and the stellar parameters of each star (luminosity, mass, stellar radius, metallicity), we calculate a stellar spectrum, which is then convolved with a filter transmission curve from a selected telescope to determine stellar magnitudes. Next, we choose a field of view (FoV) and its pixel scale, and define a Point Spread Function (PSF), which may vary depending on the filter. Finally, noise reflecting the typical image quality is added to each pixel. An overview of this process is shown in Fig. 1 applied to a JWST NIRcam set-up. Fig. 2 shows three time snapshots of the 1.5M star simulation built following this procedure. A video illustrating the time evolution of this simulation is available at this link: link to video. This mock image generator is a fundamental tool for forward modeling our simulations into observational space, and it is extensively used to create the training sets of deep learning algorithms and optimize the comparison between model and data (see Section 4).
Scheme of the pipeline to create JWST-like mock observations starting from a snapshot of an N-body simulation. Starting from the stellar parameters, the magnitude of each star is computed using the software FSPS (Conroy and Gunn Reference Conroy and Gunn2010) in a selected photometric filter. A field-of-view (FoV) is selected and each point-source is convolved with the telescope point-spread-function (PSF). The combination of a three-channel image gives the color image to the right.

Visualization of 3 snapshots of the rotating GC simulation with 1.5M stars, as if it were observed by JWST NIRcam (with the F070W, F115W, and F356W filters). The three images correspond to snapshots at 0, 0.1 and 12 Gyr, observed at a distance of d=200 kpc, with a FoV of 132x132 arcsec
 $^2$
and with inclination angle between the line-of-sight and the rotation axis of
 $i=45^\circ$
. The effect of stellar evolution and dynamical evolution of the cluster are clearly visible as a change in colour and in size, respectively. A video illustrating the time evolution of this simulation is available at this link: link to video.

2.2 Evolution of internal rotation
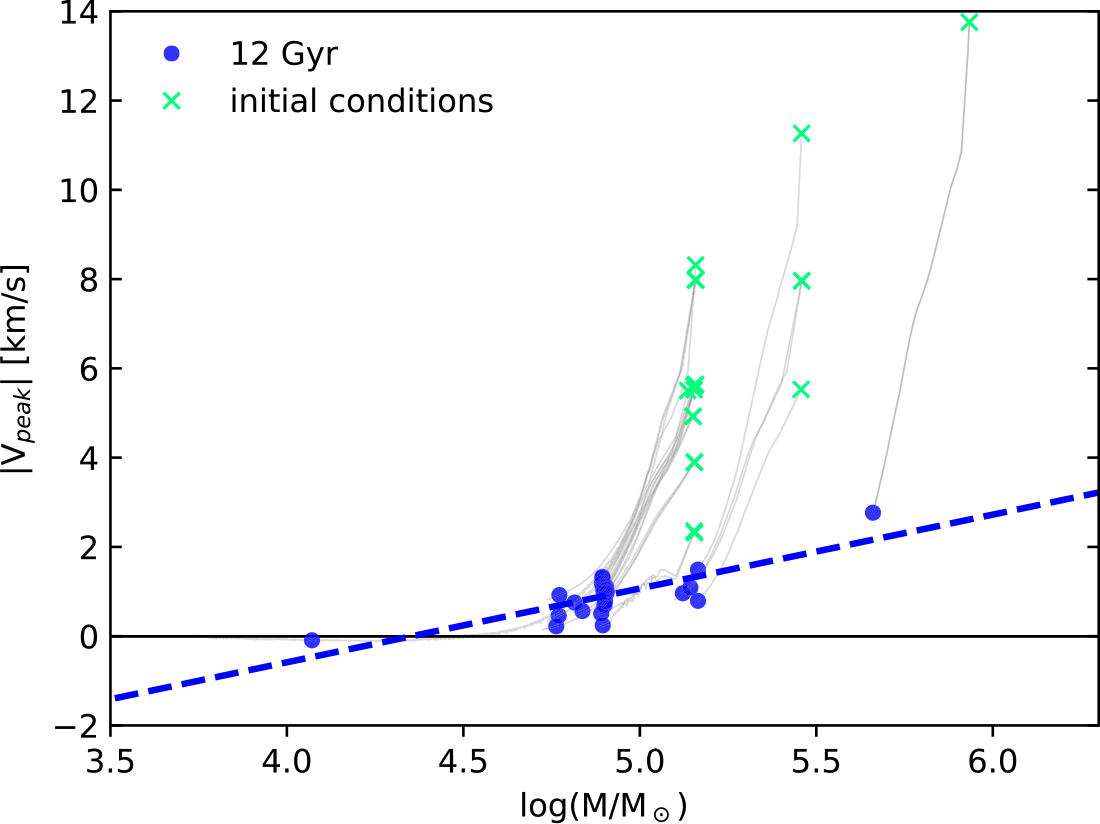
In Fig.3, we show how rotation evolves in our simulations as a function of total cluster mass, with rotation quantified by the peak of the rotation curve. The internal dynamical evolution of GCs, combined with the effects of the tidal field, causes both mass loss and angular momentum loss. As a result, the rotation signal weakens over time. After 12 Gyr of evolution, a clear correlation between rotation strength and total mass emerges, as shown by the linear fit. This trend agrees with the observed rotation-mass relation in MW GCs (e.g., Leitinger et al. Reference Leitinger, Baumgardt and Cabrera-Ziri2025). It also highlights the key role of dynamical evolution in shaping present-day rotation signatures and, given the significant angular momentum loss, suggests that rotation must have been an important feature already during GC formation in the high-redshift universe.
Evolution of internal rotation as a function of total mass for the set of rotating simulations. The internal rotation is quantified as the peak of the rotation profile at a given snapshot. The green crosses indicate the initial conditions, the blue points are the snapshots at 12 Gyr, and the gray lines are the evolutionary tracks. At 12 Gyr, the simulations follow a tight relation (dotted blue line) indicating that, at present day, more massive GCs are able to retain stronger rotation signatures.

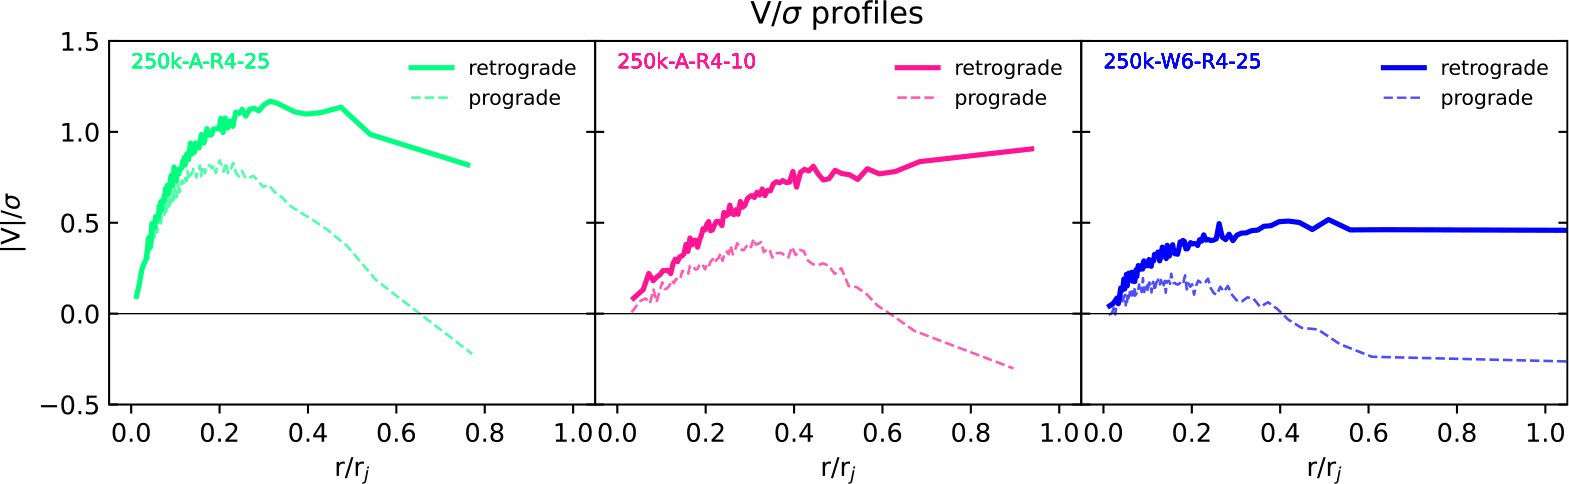
In Fig. 4, we focus instead on the specific interaction between internal rotation and the tidal field. Each panel shows a pair of simulations with identical initial conditions but opposite rotation axes: prograde simulations have their rotation axis aligned with their orbital angular momentum vector (circular orbit around the galaxy), while retrograde simulations have the rotation axis inverted. The
 $V/\sigma$
profiles show significant differences after 12 Gyr of evolution: GCs on prograde orbits lose angular momentum more efficiently and develop counter-rotating signatures in their outer regions. In contrast, retrograde simulations maintain stronger rotation and exhibit flat
 $V/\sigma$
profiles extending out to the Jacobi radius. These features arise because stars on prograde orbits within GCs are energetically less stable and more susceptible to tidal stripping (see, e.g., Fukushige and Heggie Reference Fukushige and Heggie2000; Tiongco et al. Reference Tiongco, Vesperini and Varri2016; Tiongco et al. Reference Tiongco, Vesperini and Varri2017; Claydon et al. Reference Claydon, Gieles and Zocchi2019). The preferential stripping of prograde stars accelerates angular momentum loss in prograde clusters and contributes to the formation of counter-rotating outer layers. Retrograde stars, being dynamically more stable against tidal forces, are retained longer, allowing retrograde clusters to preserve their initial rotation over a larger radial extent.
Effect of prograde rotation (thick lines) vs. retrograde rotation (dashed lines) on the shape of the
 $V/\sigma$
profiles of 3 rotating GC simulations after 12 Gyr of evolution. The profiles are normalized by their Jacobi radius
 $r_j$
, indicating the limiting radius of the GCs. Given the same initial configuration, prograde GCs (i.e., GCs with internal angular momentum aligned with their orbital angular momentum) experience a more efficient reduction of their rotational signature and develop counter-rotating features in their outer regions. These signatures arise because stars on prograde orbits are less stable against tidal stripping.

3. The emergence of angular momentum from clumpy initial conditions
The previous set of simulations focused on the evolution of angular momentum using rotating clusters as initial conditions. These studies highlight the fundamental role of rotation already in the earliest phases of GC formation. However, such initial configurations are somewhat idealized, as they neglect the complex processes involved in GC formation, such as the non-trivial interplay between gas and stars within structures that are neither symmetric nor homogeneous (Karam and Sills Reference Karam and Sills2024; Cournoyer-Cloutier et al. Reference Cournoyer-Cloutier, Sills and Harris2024). Relaxing these idealized assumptions is a first step toward addressing the following question: What is the origin of angular momentum in globular clusters?
Observations of local giant molecular clouds indicate that present-day clusters form hierarchically, through mergers of smaller sub-clusters. To reflect this, we relax the assumption of spatial homogeneity and introduce clumpy initial conditions. We run a set of 18 simulations, each with 250k stars, using the NBODY6++GPU code. Each simulation begins with three spherical, non-rotating clumps, placed stochastically in a quasi-virial state. Our ongoing work shows that within the first
 $\lt100$
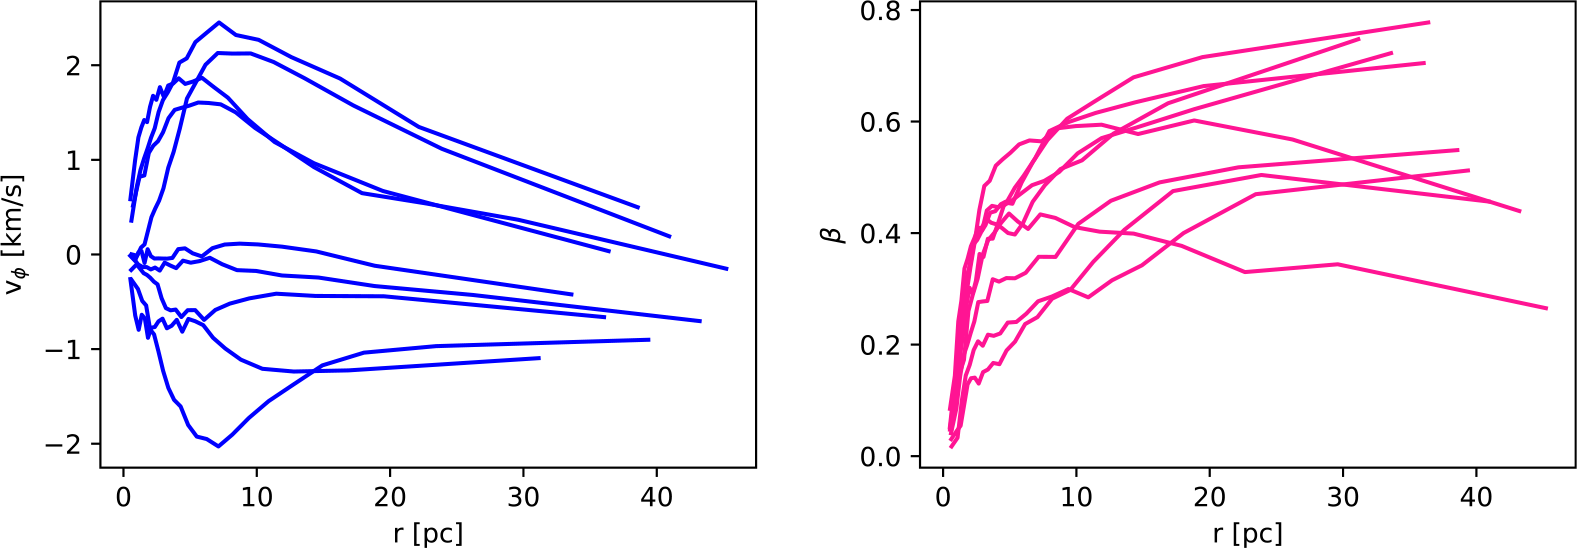
Myr, all clumps merge into a spheroidal, cluster-like structure, with over 50% of the resulting systems acquiring a significant amount of angular momentum. This angular momentum arises from the assembly process itself, as the orbital angular momentum of the merging clumps is converted into internal rotation after the merger. Hierarchical cluster formation thus appears to be a key mechanism for the emergence of rotation in GCs. Fig. 5 shows the variety of rotation profiles obtained at 100 Myr, comparable in both shape and amplitude to those observed in real GCs. We also show the anisotropy profiles
 $\beta$
, which exhibit various degrees of radial anisotropy. These results are consistent with simulations of star cluster formation seen in recent star-by-star hydrodynamical simulations evolved in a galactic context (Lahén et al. Reference Lahén, Rantala and Naab2025b; Lahén et al. Reference Lahén, Naab and Rantala2025a).
Kinematic profiles at 100 Myr of the set of simulations with clumpy non-rotating initial conditions. Left panel: rotation profiles
 $v_\phi$
; right panel: anisotropy profile
 $\beta$
. Despite the lack of initial angular momentum, after 100 Myr the GCs are able to acquire a variety of rotational signatures, due to the rapid mergers of the sub-clumps. This process also imprints significant radial anisotropy in the intermediate/outer regions of the clusters.

4. Enhancing simulations: the deep-learning algorithm
 $\pi$
-doc

N-body simulations have a high computational and environmental cost, making this direct approach unfeasible for modeling individual GCs one by one–especially in the context of new large surveys that sample an increasing number of GCs not only in the MW but also beyond the Local Group (e.g., Euclid mission). For this reason, we introduced a new modeling approach (the algorithm
 $\pi$
-DOC, Chardin and Bianchini Reference Chardin and Bianchini2021) designed to maximize the physical information extracted from N-body simulations while allowing for optimal comparison between models and observations.
 $\pi$
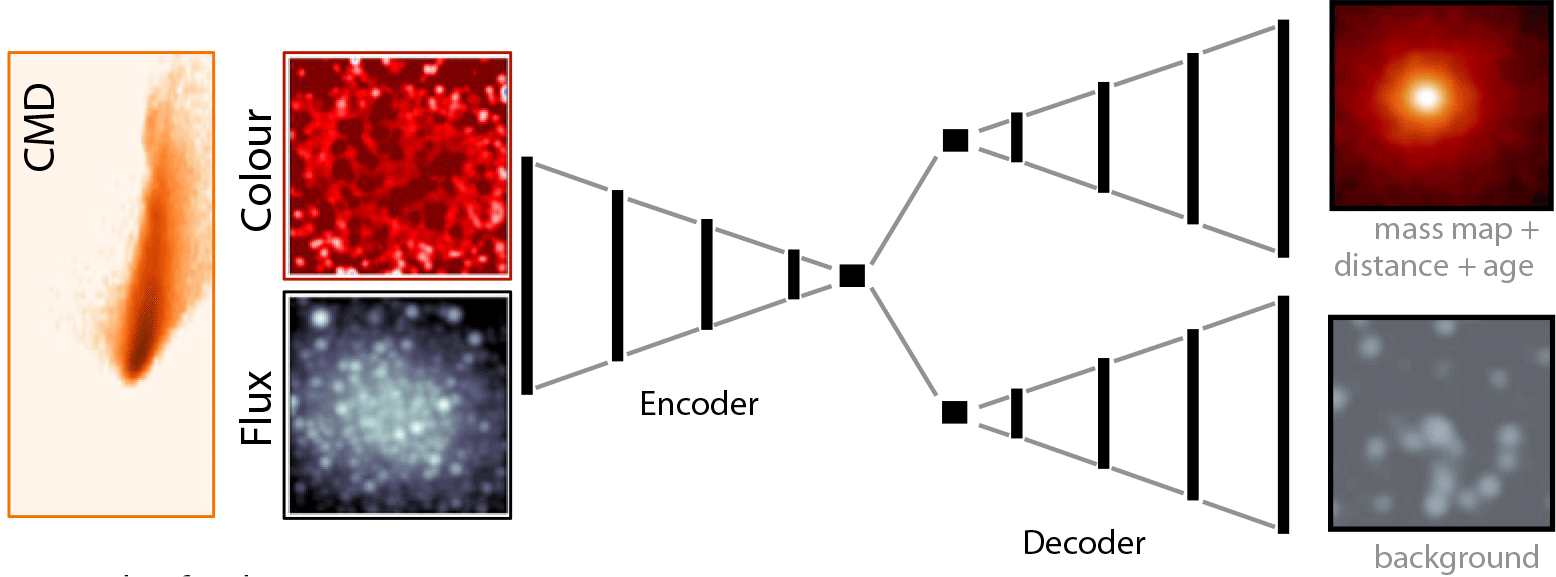
-DOC is based on convolutional neural networks (encoder-decoder structure) trained on mock images constructed from simulations using the technique introduced in Sect. 2.1. The algorithm is trained to learn the transformation between photometric images of a GC and its intrinsic properties, including the mass distribution, age, distance. This approach, based on forward modeling, naturally incorporates all relevant observational artifacts (PSF, incompleteness, etc.) in the model-data comparison and accounts for the complex multi-physics processes involved in GC dynamical evolution (e.g., collisionality effects).
Fig. 6 illustrates the recent development of the architecture (Marklund et al. in prep.) trained on multi-band photometry provided as a flux map, a colour map and a pixel-by-pixel CMD. The algorithm is also trained to discriminate between GCs stars and background stars belonging to the host galaxy, and infer the intrinsic GC properties. The training set was designed to reproduce GCs in the Andromeda galaxy observed with HST and it was built using the large set of simulations detailed in Sect. 2. Two key points already arise from the analysis: (i) the use of multi-band photometry allows for a more precise estimate of GC properties and enables effective background decontamination; (ii) the use of mock images, instead of plain simulation outputs, helps reduce the “synthetic gap”, which is the tendency of deep-learning algorithms to underperform on real data when trained solely on synthetic data.
Example of architecture for the new version of the encoder-decoder
 $\pi$
-DOC. The input consists of a flux map, a colour map and a pixel-by-pixel CMD derived from photometric images. The outputs are the intrinsic mass map, distance, age. An important feature of the new algorithm version is its ability to perform background decontamination.

5. Conclusions
In this contribution, we presented our recent efforts in modeling the dynamics of GCs, with the main goal of understanding their long term evolution as a means to connect their present day properties to their formation properties. We wish to emphasize three main points:
-
• Astronomy is intrinsically an image-based discipline. This naturally encourages a direct connection between complex theoretical models, such as N-body simulations, and real observations through a forward modeling strategy. This consists of translating simulations into the observational parameter space. In this context, we outlined our recent developments in creating mock photometric observations from general N-body outputs, capable of incorporating a variety of photometric filters, flexible telescope setups, and detailed PSFs. This method is not only a powerful tool for visualizing complex simulations, but also provides a foundation for training sets in deep-learning algorithms, facilitating direct data-model comparison.
-
• We presented a large set of direct N-body simulations with high numbers of stars (N=250k-1.5M), the majority initialized with internal rotation. These simulations required significant computational resources and have a non-negligible environmental impact, but they represent the gold standard for understanding the collisional evolution of GCs over 13 Gyr timescales and within a galactic context. The simulations have been used to study the evolution of angular momentum, showing that more massive GCs retain stronger rotation signals, helping to interpret the present-day rotation measurements in MW GCs. Moreover, the exploration of non-homogeneous, clumpy initial conditions shows that angular momentum can naturally arise from hierarchical formation, underscoring the importance of realistic initial conditions for understanding GC formation and their present-day structure.
-
• Finally, we introduced a deep-learning architecture designed to maximize the exploitation of expensive N-body simulations. In this framework, the forward modeling approach is key to enabling efficient and direct measurements of GC properties–including background decontamination–using only multi-band photometry.
We anticipate that this synergistic approach–combining HPC simulations, deep learning, and observations–will become an important asset for future data–model comparisons, enabling fast and precise measurements of GC properties across a variety of environments, in the MW and beyond, and providing a scalable solution to the ever-growing volume of both data and simulations.
Acknowledgements
PB acknowledges the contributions of Hugo Spitz and Gabriel Bounias to the visualization of simulations during their master’s internships. This project was provided with computing resources by GENCI at IDRIS thanks to the following time allocations on the supercomputer Jean Zay (V100 partition): Grand Challenge-101470, A10-A0100412451, and A13-A0130412451. The authors would like to acknowledge the High Performance Computing Center of the University of Strasbourg for supporting this work by providing scientific support and access to computing resources. Part of the computing resources were funded by the Equipex Equip@Meso project (Programme Investissements d’Avenir) and the CPER Alsacalcul/Big Data. PB and AM acknowledge financial support by the IdEx framework of the University of Strasbourg. AA acknowledges support for this research from project No. 2021/43/P/ST9/03167 co-funded by the Polish National Science Center (NCN) and the European Union Framework Programme for Research and Innovation Horizon 2020 under the Marie Skłodowska-Curie grant agreement No. 945339. For the purpose of Open Access, the authors have applied for a CC-BY public copyright license to any Author Accepted Manuscript (AAM) version arising from this submission.


 2
 i=45∘
 V/σ
 rj
 vϕ
 β
 π


