Introduction
Turkestanite, Th(Ca,Na)2(K,☐)Si8O20⋅nH2O (where ☐ = vacancy), named after the discovery locality, the Turkestan Ridge, is a rare mineral first described by Pautov et al. (Reference Pautov, Agakhanov, Sokolova and Kabalov1997) from two localities: Dara-i-Pioz massif, Tien-Shan Mountains, Tajikistan and Dzhelisu massif, Sokh Valley, Batken Region, Kyrgyzstan. The mineral has subsequently been found in Narsaarsuk Plateau and Kangerluarsuk Fjord, Greenland (Petersen et al., Reference Petersen, Johnsen and Micheelsen1999), Papanduva pluton, Brazil (Vilalva and Vlach, Reference Vilalva and Vlach2010), Poudrette quarry, Canada (Horváth and Horváth, Reference Horváth and Horváth2012), Antsirabe, Madagascar (Estrade et al., Reference Estrade, Salvi, Béziat, Rakotovao and Rakotondrazafy2014; Estrade et al., Reference Estrade, Salvi and Béziat2018) and São Miguel, Azores, Portugal (Lavarde et al., Reference Lavarde, Chiappino, Alves and Astolfi2019).
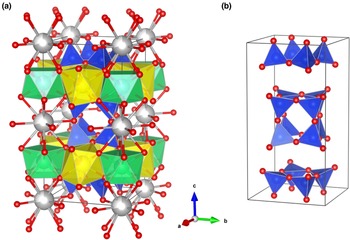
According to the silicate minerals hierarchy of Hawthorne et al. (Reference Hawthorne and Uvarova2019), turkestanite is a single-layer sheet-silicate based on a [4.82]8 net with a mixed (u–d) tetrahedral arrangement. The u–d arrangement in the turkestanite tetrahedra sheet is (u4)1(d4)1(u2d2u2d2)2 (see table 5 in Hawthorne et al., Reference Hawthorne and Uvarova2019), where (u) is upward-pointing tetrahedra and (d) is downward-pointing tetrahedra. It belongs to the ekanite group (Table 1; Hawthorne et al., Reference Hawthorne and Uvarova2019), which also includes steacyite, arapovite and iraqite-(La). The mineral species have doubly folded sheets with the same pattern of u and d tetrahedra. The tetrahedra are shared via vertices and form [Si8O20] double four-membered rings (Fig. 1).
(a) The crystal structure of turkestanite, and (b) silicate double four-membered rings contained in the unit cell. Si tetrahedra are blue; A (Th/U) and B (Ca/Na) polyhedra are green and yellow, respectively. O atoms are red, K atoms (C sites) are drawn in grey. The partially white colouring of the spheres indicates a vacancy.

Ekanite group minerals. The CNMMN/CNMNC* approved formula and general formula (AB 2CSi8O20) used for the crystal-chemical investigation in the cited references are given.

*CNMMN – The Commission on New Minerals and Mineral Names, merged in 2006 to CNMNC – The Commission on New Minerals, Nomenclature and Classification.
Ekanite crystallises in space group I422. The [Si8O20] unit in this mineral is a sheet, composed of four- and eight-membered tetrahedral rings. The interstitial complex in ekanite consists of one distinct [8]-coordinated Ca2+ ion and one [8]-coordinated Th4+ ion (Hawthorne et al., Reference Hawthorne and Uvarova2019). The gillespite-group minerals (gillespite, cuprorivaite, effenbergerite and wesselsite) and ekanite have the same pattern of u and d tetrahedra in their four-membered rings. The interstitial complex in these minerals consists of one individual M 2+ ion [M 2+ = Ca2+ (cuprorivaite), Ba2+ (gillespite and effenbergerite) or Sr2+ (wesselsite)], which is [8]-coordinated by oxygens, and one [4]-coordinated Cu2+ (cuprorivaite, effenbergerite and wesselsite) or Fe2+ (gillespite) ion (Hawthorne et al., Reference Hawthorne and Uvarova2019).
Szymański et al. (Reference Szymański, Owens, Roberts, Ansell and Chao1982) reported the following crystal-chemical formula for ekanite from the Tombstone Mountains, Yukon, Canada: (Th0.89U0.05)(Ca1.91Fe0.06Mn0.03)Si8O20; whereas the composition of ekanite, which Richard and Perrault (Reference Richard and Perrault1972) reported earlier, (Th0.88Ce0.02Pb0.01☐0.09)Σ1.00(K0.61☐0.39)Σ1.00(Na0.90Ca0.73Mn0.19Mg0.03☐0.14)Σ1.99Si8O19.04(OH0.96), corresponds to steacyite. Subsequently, the name of the mineral corresponding to this composition was revised (Perrault and Szymański (Reference Perrault and Szymański1982), see Table 1); note the predominance of sodium ions in the Ca position. Another ion position appears in the crystal structure of steacyite (space group P4/mcc): [12]-coordinated K+, which occludes large cages of the framework. Kabalov et al. (Reference Kabalov, Sokolova, Pautov and Schneider1998) carrying out a Rietveld refinement on the turkestanite powders both from Tajikistan and Kyrgyzstan, confirmed the same space group and structural model as those of steacyite. In the crystal structure of arapovite, the U-analogue of turkestanite, a significant amount of K is also observed: (U0.55Th0.36Pb0.03Ce0.03Nd0.03La0.01Sm0.01Eu0.01Dy0.01)Σ1.04(Ca1.29Na0.73)Σ2.02(K0.52☐0.48)Σ1.00Si8O20.06⋅0.89H2O (Agakhanov et al., Reference Agakhanov, Pautov, Uvarova, Sokolova, Hawthorne, Karpenko, Dusmatov and Semenov2004) and (U4+0.59Th0.26Ca0.10Dy0.02Sm0.01Pr0.01)Σ0.99(Ca1.23Na0.68Nd0.05Ce0.03Ba0.01)Σ2.00(K0.52☐0.48)Σ1.00Si8O20 (Uvarova et al., Reference Uvarova, Sokolova, Hawthorne, Agakhanov and Pautov2004).
Finally, another known mineral of the ekanite group, iraqite-(La), has a crystal-chemical formula: (Ln0.67Th0.33X 0.07)Σ1.07(K0.52☐0.47)Σ0.99(Ca1.75Ln0.18Na0.08)Σ2.01(Si7.85Al0.18)Σ8.03(O19.97F0.03)Σ20.00, where X = U, Pb, Zr, Fe, Mg and Cu (Livingstone et al., Reference Livingstone, Atkin, Hutchison and Al-Hermezi1976). The powder data are similar to those recorded by Perrault and Richard (Reference Perrault and Richard1973) for steacyite (in the original article, the sample was called ekanite), however, the crystal structure of an iraqite-(La) single crystal has not yet been refined. An analysis of the chemical compositions of minerals of the ekanite group makes it possible to outline two series of isomorphic substitutions. In position A, there is a wide isomorphism between thorium, uranium and rare earths; in position B, calcium is isomorphically replaced by sodium.
Pautov et al. (Reference Pautov, Agakhanov, Sokolova and Kabalov1997) reported crystal chemical formulas for turkestanite of (Th0.92U0.05Ce0.03)Σ1.00(Ca1.21Na0.84)Σ2.05(K0.80☐0.20)Σ1.00Si8O20.01⋅nH2O (analysis # 2) for the sample from the Dara-i-Pioz massif, and Th1.06(Ca1.40Na0.49)Σ1.89(K0.53☐0.47)Σ1.00(Si7.80Al0.20)Σ8.00O19.93(OH)0.07⋅nH2O for turkestanite from the Dzhelisu massif.
Knyazev et al. (Reference Knyazev, Chernorukov and Komshina2012) prepared the compound KNaCaTh(Si8O20) (a synthetic analogue of turkestanite) by solid-phase reaction and studied the temperature dependencies of the unit cell parameters by high-temperature powder X-ray diffraction (HTXRD). Shortly afterwards Knyazev et al. (Reference Knyazev, Komshina, Zhidkov and Plesovskikh2013) studied the structural features of synthetic RbNaCaTh(Si8O20) by the Rietveld method and HTXRD. The authors concluded that despite the fact that these phases are isostructural, their thermal expansion coefficients essentially differ from each other. Finally, Knyazev et al. (Reference Knyazev, Smirnova, Manyakina, Shushunov, Bulanov, Lelet and Savushkin2016) used precision adiabatic vacuum calorimetry to study the temperature dependence of the heat capacity of KNaCaTh(Si8O20).
Recently Jin and Soderholm (Reference Jin and Soderholm2015) reported structural data for isostructural Th and U compounds synthesised under hydro-thermal conditions. Their results suggest that the chemistry of Th and U silicates in melts may be invertible with their chemistry in the natural environment, which could potentially be used to study the chemistry of heavier actinide silicates in the geosphere.
In this work, a crystal chemical and spectroscopic investigation using a multi-analytical approach were carried out on a turkestanite specimen from Dara-i-Pioz massif, Tajikistan. In particular, a combination of electron probe microanalysis (EPMA), Fourier microspectroscopy (μFTIR), single-crystal X-ray diffraction (SCXRD), and photoluminescence spectroscopy was employed. This is the first report of structure refinement from single-crystal diffraction data, and photoluminescence and excitation spectra of turkestanite.
Material and experimental methods
Geological context and sample description
The Dara-i-Pioz alkaline massif is located in Central Tajikistan in the upper reaches of the Rasht River, and in the watershed part of the southern slope of the Alai Range. The massif is confined to the Zeravshan–Alai marginal fault in the junction zone of the Zeravshan, Alai and Turkestan ranges (Faiziev et al., Reference Faiziev, Gafurov and Sharipov2010). Its outer part is composed of tourmalinised granites (sometimes changing into granosyenites and alkaline granites), whereas the core is composed of aegirine and quartz syenites. The vein rocks are represented by syenite–aplites, carbonatites, pegmatites, pegmatoid rocks, and quartz veins (Faiziev et al., Reference Faiziev, Gafurov and Sharipov2010).
Rare thorium minerals (turkestanite and thorite) and a uranium–thorium mineral (arapovite) along with rare earth element (REE) minerals (stillwellite, moskvinite-(Y), zirsilite-(Ce) and miserite) have been found at the Dara-i-Pioz deposit (Faiziev, Reference Faiziev2016). A large number of new and rare boron-, lithium-, beryllium-, zirconium, caesium- and barium-bearing minerals have been discovered here.
Turkestanite occurs in the quartz–albite–aegirine and miserite–baratovite–quartz–aegirine rocks as apple-green prismatic crystals enclosing the groundmass minerals typically enriched in Zr, REE, Th, Sr and Ti (Reguir et al., Reference Reguir, Chakhmouradian and Evdokimov1999).
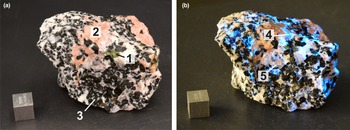
The turkestanite-containing rock sample investigated from the Dara-i-Pioz massif (Fig. 2) is an uneven-grained pegmatoid formation with a spotted texture due to the uneven distribution of minerals. It consists mainly of prismatic transparent grains of quartz, albite and euhedral elongated greenish-black aegirine crystals. Pink acicular miserite and lamellar pale pink baratovite are present as minor minerals. Baratovite is easily identified in the rock due to its blue luminescence when exposed to short-wavelength ultraviolet light. Turkestanite is an accessory mineral. Its subhedral prismatic elongated apple-green crystals reach a length of 5 mm. Several crystals from the specimen were selected under an optical microscope and then used for experimental investigations.
Sample (No. DP-87-8a) of miserite–baratovite–quartz–aegirine rock. (a) Illuminated by a daylight lamp; (b) under short-wavelength (254 nm) ultraviolet illumination. The cube is 1 cm. Labels: 1 – green crystals of turkestanite, 2 – pink acicular crystals of miserite, 3 – greenish-black crystals of aegirine, 4 – lamellar grains of baratovite (under natural light the grains are pale pink, under shortwave ultraviolet light they luminesce with blue light), 5 – prismatic grains of transparent quartz.

Electron probe microanalysis
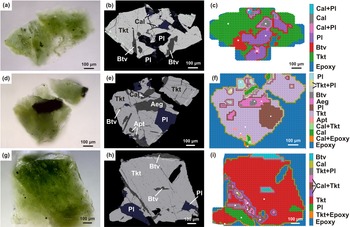
Electron probe microanalyses (EPMA) were performed on three grains embedded in epoxy resin, polished, and then carbon coated (Fig. 3). A Superprobe JEOL JXA-8200 (JEOL Ltd, Tokyo, Japan) instrument (WDS mode) was used. Preliminary chemical composition of the grains was obtained using energy dispersive spectroscopy operated at 20 kV accelerating voltage, 15 nA beam current and using 10 μm beam diameter. Counting times were 10 s for peak and 5 s for background. The standards employed and elements were: blue diopside (Si, Mg and Ca); albite (Na); orthoclase (K); pyrope (Al, Fe and Cr); Mn-garnet (Mn); rutile (Ti); zircon (Zr); ThO2 (Th); and UO2 (U). A conversion from X-ray counts to oxide weight percentages (wt.%) was obtained with the ZAF matrix correction (Yang et al., Reference Yang, Zhang, Jiang and Xie2018). The oxides (wt.%) obtained are the average of 4–6 spot analyses (see Table 2).
Photomicrographs in transmitted light (a, d, g), back-scattered electron images (b, e, h), and μFTIR mapping in reflection regime (c, f, i) of polished turkestanite grains. Aeg – aegirine, Apt – apatite, Btv – baratovite, Cal – calcite, Pl – plagioclase, Tkt – turkestanite, and Epoxy – epoxy resin.

Average chemical composition (wt.%) for the turkestanite grains investigated compared with those reported previously.*

* Notes: D-P – Dara-i-Pioz massif, Dzh – Dzhelisu massif, Ppnd – Papanduva Pluton; b.d.l. – below detection limit; n.d. – not determined; and '–' – not reported.
Fourier microspectroscopy
Fourier microspectroscopy (μFTIR) mapping of grains embedded in epoxy resin was performed in reflection mode using a FTIR Micran-3 microscope equipped with a Simex FT-801 spectrometer (Simex, Novosibirsk, Russia). Each spectrum was collected from the 25 μm region with 4 cm–1 spectral resolution and six averages. A map of different mineral phases in each grain (Figs 3c,f,i) was constructed using the following procedure: the cosines between all measured spectra were calculated; if the cosine between two spectra was < 0.96 then the vectors were considered to belong to different phases; spectra of all found phases were compared with reflection spectra from a local database where reflection spectra of standard minerals (verified with microprobe analysis) are collected.
Single-crystal X-ray diffraction
A turkestanite crystal with a relatively good diffraction quality was chosen for the intensity data collection and structure refinement using single-crystal X-ray diffraction (SCXRD). Structural determination was carried out with a Bruker AXS D8 VENTURE automated diffractometer (Bruker AXS, Berlin, Germany) with graphite-monochromatised MoKα radiation (λ = 0.7107 Å). Operating conditions were: 50 kV and 1 mA, with a crystal-to-detector distance of 40 mm. To check the crystal diffraction quality, two preliminarily sets of 12 frames were acquired with 0.5° ω rotation and 10 s exposure time. The collection strategy was optimised with the APEX2 suite package (Bruker, 2014) and the diffraction data was recorded by a combination of several ω and φ rotation sets, with 0.25° scan width and 12 s per frame exposure time. Data reduction was performed using CrysAlisPro Version 1.171.39.46 (Rigaku, Tokyo, Japan) (CrysAlis, 2018). The suggested space group was P4/mcc. The poor quality of the crystal and possible metamictisation due the radioactive decay of Th and U were reflected in the relatively high value of R int (Table 3). Structure refinement was carried out by means of the program CRYSTALS (Betteridge et al., Reference Betteridge, Carruthers, Cooper, Prout and Watkin2003) using the reflections with I>3σ(I). Overall scale factor, atomic positions, cation occupancies, and anisotropic atomic displacement parameters were refined, starting from the coordinates of turkestanite given by Kabalov et al. (Reference Kabalov, Sokolova, Pautov and Schneider1998). The occupancy of the tetrahedral site was constrained to 1. The analysis of the difference-Fourier map showed the presence of residual electron density peaks ~4.7 e −/Å3 being at ~0.65 Å from the Th and ~2.1 e −/Å3 being at ~0.78 Å from the Si position. Any attempt to model the two residual peaks as oxygen atoms led to physically unacceptable results. The residual maximum located near the U site (~3.4 e −/Å3) was noted by Uvarova et al. (Reference Uvarova, Sokolova, Hawthorne, Agakhanov and Pautov2004) in the refinement of the isostructural arapovite; the authors were also unable to interpret these residual maxima. A small number of additional weak reflections was tentatively assigned as the minor impurity phase. The presence of other phases within the studied turkestanite crystal (as noted by the EPMA and μFTIR, see below), the reflections of which might partly overlap with those of turkestanite may also be the reason for the high R int, R and R w, and the difficulties encountered as the single-crystal method is not appropriate to examine a multi-phase sample. Ultimately, the peaks can be considered residuals in the Fourier-difference map. Relevant crystallographic data of the analysed sample and experimental data are reported in Table 3. Fractional atomic coordinates, site occupancies, and atomic displacement parameters are listed in Table 4, whereas selected cation–anion bond lengths are included in Table 5. The crystallographic information files have been deposited with the Cambridge Crystallographic Data Centre (CCDC 2181136) and with the Principal Editor of Mineralogical Magazine and are available as Supplementary material (see below).
Selected data on single crystal, data collection, and structure refinement parameters for the turkestanite sample studied.

R = Σ[|F o| – |F c|]/Σ|F o|. R w = [Σ[w(F o2–F c2)2]/Σ[w(F o2)2]]½; w = Chebyshev optimised weights; Gof = [Σ[w(F o2–F c2)2]/(N–p]½, where N and p are the number of reflections and parameters, respectively.
Crystallographic coordinates, occupancies, and equivalent/isotropic atomic displacement parameters (Å2) for the turkestanite sample studied.

Selected bond distances (Å) for tetrahedra and polyhedra angles (°) for the studied turkestanite sample compared with those of turkestanite (Kabalov et al., Reference Kabalov, Sokolova, Pautov and Schneider1998, Rietveld method), steacyite (Richard and Perrault, Reference Richard and Perrault1972), arapovite (Uvarova et al., Reference Uvarova, Sokolova, Hawthorne, Agakhanov and Pautov2004), ekanite (Szymański et al., Reference Szymański, Owens, Roberts, Ansell and Chao1982), synthetic Th-phase ((Ca0.5Na0.5)2NaThSi8O20) and U-phase ((Ca0.5Na0.5)2NaUSi8O20) (Jin and Soderholm, Reference Jin and Soderholm2015).

Symmetry codes: (i) y, x, 0.5–z; (ii) –y, –x, 0.5–z; (iii) –y, x, z; (iv) y, –x, z; (v) x, –y, 0.5–z; (vi) –x, y, 0.5–z; (vii) –x, –y, z; (viii) y, 1–x, z; (ix) –y, 1–x, 0.5–z; (x) –x, 1–y, z; (xi) x, 1–y, 0.5–z; (xii) x, y, –z; (xiii) y, –x, –z; (xiv) –x, –y, –z; (xv) –y, x, –z; (xvi) 1–y, x, z.
Photoluminescence spectroscopy
The photoluminescence spectra of turkestanite were measured using a spectrometer based on an SDL-1 600 lines per mm grating monochromator (LOMO, St. Petersburg, Russia). The spectral slit width was 0.4 nm. Registration was carried out using a Hamamatsu H10721-04 photomodule (Hamamatsu, Sendai, Japan) in the photon counting regime. Excitation was performed using a semiconductor laser with a wavelength of 405 nm or 150 W Xe-lamp. The sample was fixed on the cryofinger of a filling nitrogen cryostat, which was placed in a vacuum chamber and evacuated to 10−4 Pa. The luminescence spectra under 405 nm laser excitation were measured at different temperatures. Temperature control was performed using a type-K thermocouple.
Results and discussion
The chemical composition of our sample somewhat differs from that of the Dara-i-Pioz crystals reported by Pautov et al. (Reference Pautov, Agakhanov, Sokolova and Kabalov1997) (Table 2). In particular, the Na2O content is somewhat lower, and the amount of CaO, on the contrary, is somewhat higher than in the analyses published by Pautov et al. (Reference Pautov, Agakhanov, Sokolova and Kabalov1997). However, the Na2O content of the Dara-i-Pioz samples obtained by Reguir et al. (Reference Reguir, Chakhmouradian and Evdokimov1999) is almost twice lower than in our sample, with a similar amount of CaO. (Table 2).
The content of ThO2, UO2, and (REE)2O3 in all analyses presented in Table 2 fluctuate within a reasonably wide range. Samples of turkestanite from the Dara-i-Pioz reported by Reguir et al. (Reference Reguir, Chakhmouradian and Evdokimov1999) show a high PbO content. In addition, Dzhelisu samples have the highest value of Al2O3 content, whereas Papanduva turkestanite contains quite a significant content of Fe2O3 (Table 2).
The EPMA and μFTIR studies show that the grains studied are intergrowths of turkestanite with baratovite, aegirine and plagioclase and that turkestanite contains apatite grains as inclusions. In addition, turkestanite is cataclased, and the cataclasis cracks are filled with calcite. Detailed FTIR microspectrometric maps of analysed grains are represented in Figs 3c,f,i.
The following crystal-chemical formula can be proposed for the studied turkestanite from the Dara-i-Pioz massif (calculated on the basis of 8 Si apfu): (Th0.84U0.12)Σ0.96(Ca1.24Na0.65)Σ1.89(K0.75☐0.25)Σ1.00Si8O19.72(OH)0.28. The formula is balanced on the basis of the O ↔ OH substitution mechanism. In the turkestanite crystal structure, the symmetrically independent crystallographic atomic sites are: the tetrahedrally coordinated Si; [8]-coordinated A and B; and the extra-framework C site. The formula and Table 6 show the A site filled mainly by Th, with minor U. The B site is occupied by Ca and a minor amount of Na. The C site contains K, and it is not filled completely.
Unit cell parameters, polyhedral site populations, and X-ray and EPMA mean atomic numbers (electrons, e –) for the turkestanite studied compared to those reported for turkestanite by Kabalov et al. (Reference Kabalov, Sokolova, Pautov and Schneider1998), isostructural steacyite (Richard and Perrault, Reference Richard and Perrault1972) and arapovite (Uvarova et al., Reference Uvarova, Sokolova, Hawthorne, Agakhanov and Pautov2004), ekanite (Szymański et al., Reference Szymański, Owens, Roberts, Ansell and Chao1982) and synthesised Th-phase (Ca0.5Na0.5)2NaThSi8O20 and U-phase (Ca0.5Na0.5)2NaUSi8O20 (Jin and Soderholm, Reference Jin and Soderholm2015).*

* n.r. – not reported.
The formula derived from the refinement of the crystal structure: (Th0.81U0.10)Σ0.91(Ca1.36Na0.64)Σ2.00(K0.73☐0.27)Σ1.00Si8O20 (Table 4), is somewhat different from the empirical one. Due to the presence of other phases and the possible metamictisation of turkestanite as noted above, and to the SCXRD and EPMA being carried out using different crystals, there are some discrepancies in the position occupancies and mean atomic numbers of A, B and C sites in Table 6.
High contents of K2O (Table 2) characterise our turkestanite crystal as well as samples from Dara-i-Pioz analysed by Pautov et al. (Reference Pautov, Agakhanov, Sokolova and Kabalov1997). The greater values of Na and K are noted in the turkestanite samples from Dara-i-Pioz reported by Pautov et al. (Reference Pautov, Agakhanov, Sokolova and Kabalov1997) and studied here, as well as in the arapovite analysed by Agakhanov et al. (Reference Agakhanov, Pautov, Uvarova, Sokolova, Hawthorne, Karpenko, Dusmatov and Semenov2004), while intermediate values are found in Dzhelisu sample and in one Papanduva turkestanite sample.
The results of a bond-valence analysis for the sample studied are given in Table 7. The cation positions in this sample are somewhat undersaturated: B and C receives 1.63 and 0.64 valence units (vu) due to Ca2+ ↔ Na+ and K+ ↔ ☐ replacement, respectively. The bond-valence sum of the A site atom for the studied and literature samples is <4 [3.54 vu vs. 3.02 vu in turkestanite of Kabalov et al. (Reference Kabalov, Sokolova, Pautov and Schneider1998) and 3.60 vu in arapovite reported by Uvarova et al. (Reference Uvarova, Sokolova, Hawthorne, Agakhanov and Pautov2004)].
Bond-valence sums for the turkestanite studied, using the parameters suggested by Gagnè and Hawthorne (Reference Gagnè and Hawthorne2015). The sums for the A and B sites with mixed occupancies were calculated using fractional site occupancies, obtained by SCXRD.

[×4], [×8]: for the calculation of the bond valence sum for cations.
(×2): for the calculation of the bond valence sum for anions.
In the turkestanite crystal structure, there are three independent oxygen atoms: the O1 is shared by two Si tetrahedra and coordinate A site, while the O2 and O3 are common for tetrahedron and polyhedra. The O3 bond valence value (1.89 vu) is compatible with O2− ↔ OH− replacement. Similar results have been obtained for the arapovite sample of Uvarova et al. (Reference Uvarova, Sokolova, Hawthorne, Agakhanov and Pautov2004). Kabalov et al. (Reference Kabalov, Sokolova, Pautov and Schneider1998) recorded a notable shortening of Si–O3 bond lengths (~1.47 Å) with respect to others (1.61–1.64 Å), but this feature is less pronounced in the turkestanite studied (Si–O3 ≈ 1.57 Å, Si–O1,O2 ≈ 1.61–1.64 Å), see Table 5.
It should be noted that the presence of water molecules in the crystal structure of turkestanite was reported only once by Pautov et al. (Reference Pautov, Agakhanov, Sokolova and Kabalov1997) (see Table 2). In this work, no clear evidence of the presence of water was found by means of structural refinement and FTIR spectroscopy.
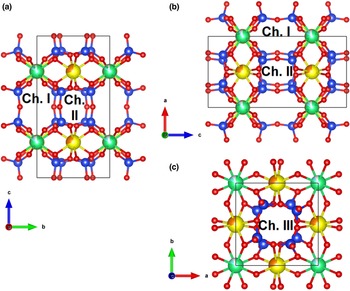
Three types of channels can be distinguished inside the crystal structure of turkestanite (Fig. 4). Channels I and II are extended along the a and b axis and delimited by both tetrahedra and polyhedra and by four-membered tetrahedral rings, respectively. The shortest distances between oppositely located oxygen atoms in the rings are 4.831(3) × 4.161(1) Å and 3.920(3) × 3.503(1) Å, respectively. The cavities in channel I are occupied by K ions. Channel III is formed by tetrahedral rings and extends parallel to the c axis. The dimensions of the smallest free aperture of the channel are 3.763(1) × 3.763(1) Å.
Perspective view of the turkestanite crystal structure projected down to an a axis with an aperture of channel I (a), down to b axis with an aperture of channel II (b), and down to c axis with an aperture of channel III (c). Si atoms are blue; Th and U are green and cyan, respectively; Ca and Na are yellow and orange, respectively; O atoms are drawn red. For clarity, K atoms have been omitted. Channels (Ch.) I, II, and III are shown. Drawn using the program VESTA (version4.3.0) (Momma and Izumi, Reference Momma and Izumi2011).

Effective channel widths (ecw) are the distance between oxygen atoms in the smallest n-ring or smallest free aperture subtracted by 2.7 Å, when the oxygen ionic radius is assumed to be 1.35 Å (McCusker et al., Reference McCusker, Liebau and Engelhardt2001). Channel I, II and III are 2.13 × 1.46 Å, 1.22 × 0.80 Å and 1.06 × 1.06 Å, respectively. Ecw is a fundamental characteristic of a channel, it describes the accessibility of the pore system to guest species. Despite the channels occurring, turkestanite cannot be considered microporous (a minimum ecw of 3.2 Å is required, Cadoni and Ferraris, Reference Cadoni and Ferraris2011). However, channel I of turkestanite is large enough to theoretically contain guest atoms, for instance, water molecules. A similar feature has also been identified in tubular agrellite from Dara-i-Pioz (Kaneva et al., Reference Kaneva, Bogdanov and Shendrik2020).
Comparing the turkestanite with the natural and synthetic isostructural compounds we observe that they are generally very similar. Table 6 shows that refined cell constants of the turkestanite studied are very close to those reported for steacyite and arapovite specimens in the literature (Richard and Perrault Reference Richard and Perrault1972; Uvarova et al., Reference Uvarova, Sokolova, Hawthorne, Agakhanov and Pautov2004). This is also true for those found by Kabalov et al. (Reference Kabalov, Sokolova, Pautov and Schneider1998) when reported in the same setting as used here. However, the lattice constants of ekanite (Szymański et al., Reference Szymański, Owens, Roberts, Ansell and Chao1982) and the synthesised Th- and U-phases (Jin and Soderholm, Reference Jin and Soderholm2015) are slightly lower (Table 6). The explanation for this is the presence of a vacancy or ions of a smaller ionic radius in the С position (Tables 5 and 6). Moreover, ekanite crystallises in a different space group (I422) and contains the silicate unit of a different bond topology. This [Si8O20] unit in the ekanite crystal structure is represented by a sheet, consisting of four- and eight-membered tetrahedra rings (Szymański et al., Reference Szymański, Owens, Roberts, Ansell and Chao1982). Sheets of tetrahedra alternate with sheets of polyhedra along the c axis. Polyhedra containing [8]-coordinated Th and Ca form the sheet identical to that in the structure of turkestanite.
The infrared spectrum of turkestanite (Fig. 5) was calculated from the reflection spectrum using Kramers–Krönig transformation. The prominent bands in the spectrum are at 1095, 1036, 975 and 780 cm–1. These bands were found in Si8O20-containing silicates (Pautov et al., Reference Pautov, Agakhanov, Sokolova and Kabalov1997; Agakhanov et al., Reference Agakhanov, Pautov, Uvarova, Sokolova, Hawthorne, Karpenko, Dusmatov and Semenov2004). The bands at 1095, 1036 and 975 cm–1 are attributed to asymmetric Si–O–Si vibration modes, whereas the band at 780 cm–1 corresponds to the symmetric Si–O–Si mode (Handke and Jastrzębski, Reference Handke and Jastrzębski2005).
The infrared spectrum of turkestanite.

In the samples studied, a wide luminescence band peaked at ~19300 cm–1 and under 27100 cm–1 excitation was observed (Fig. 6, curve 1). The luminescence band has vibrational spacing measured as 740 cm–1. The emission maximum is compared to steacyite in Fig. 6 (curve 2). In the same spectral region luminescence bands of the uranyl group are known in ekanite, uranyl glass, hyalite (Nasdala et al., Reference Nasdala, Sameera, Fernando, Wildner, Habler, Erlacher and Škoda2022), and aqueous uranyl salts (Natrajan, Reference Natrajan2012). The full width at half maximum (FWHM) of the turkestanite luminescence band is ~6800 cm–1 which is wider than for steacyite (2100 cm–1) and ekanite (about 3000 cm–1, Nasdala et al., Reference Nasdala, Sameera, Fernando, Wildner, Habler, Erlacher and Škoda2022). This could be explained by the presence of cation vacancies in the crystal structure of turkestanite, though on the other hand, the vibrational structure of the luminescence band is well resolved in turkestanite in comparison with steacyite and ekanite due to fewer irregular arrangements of nearest neighbour atoms in the turkestanite host. The excitation bands are located in four regions at ~26000, 29000, 35000 and 39000 cm–1 (Fig. 6, curve 3). The excitation spectrum of steacyite demonstrates practically the same bands (Fig. 6, curve 4). The observed excitation bands are attributed to ligand-to-metal charge transfer electronic transition (LMCT) in the uranyl ion (UO2)2+. The observed green emission at 19300 cm–1 is a result of a radiative transition from the excited triplet state. The vibrational structure of the emission band is due to U–O υ 1 symmetrical stretching mode 740 cm–1 of uranyl ion. The U–O bond length can be obtained using an empirical formula in terms of the symmetric stretching frequency proposed by Barlett and Cooney (Reference Bartlett and Cooney1989):

Photoluminescence spectra of turkestanite (1) and steacyite (2) under 405 nm excitation. Excitation spectra of uranyl ions (UO2)2+ in turkestanite (3) and steacyite (4) monitored at 520 nm. All spectra were measured at 90 K.

Therefore, the estimated bond length of the uranyl cation in turkestanite is ~1.9 Å. That is slightly shorter than the crystallographic bond length in Table 5, probably due to distortion from the uranyl ion or the linearity distortion of the uranyl molecules.
The lowest excited state of the uranyl ion is 3Πu and luminescence occurs from it to ground 1Σg+. The 3Πu has triplet character and the highest triplet levels at 24400 and 27030 cm–1 are found. The second excited state is 3Δu and it is also regarded as a triplet with levels at 28480, 29180 and 31150 cm–1. The next excited state with levels at 34450, 35750 and 37290 cm–1 is attributed to T3 according to Bell and Biggers (Reference Bell and Biggers1968).
The temperature dependence of (UO2)2+ luminescence is given in Fig. 7. The luminescence intensity decreases at temperatures above room temperature and it is completely quenched at 370 K under 405 nm excitation. The luminescence is quenched following Motts law:

where w is the rate constant for the thermally activated escape, kB is the Boltzmann constant, and E a is the activation energy connected with this process. The constant w is defined as the ratio of the attempt rate for thermal quenching (Γ0) to the radiative decay rate of the LMCT emission of the uranyl ion (Γ). The attempt rate Γ0 has a similar magnitude, as the phonon frequency of turkestanite is about 3.5 × 10¹³ Hz corresponding with phonon energies of 1000 cm−1. The radiative decay rate for uranyl is ~3.5 × 10⁵ Hz. Therefore, E a is equal to 0.510 ± 0.001 eV and w = 1 × 10⁸ Hz. The quenching mechanism could be due to the thermal excitation of an electron from the 3Δu triplet state to conduction band states with an energy barrier at ~0.51 eV.
Temperature dependence of the integral intensity of uranyl ions luminescence under 405 nm excitation. The solid line is a fitted curve according to equation 2.

Conclusion
Although thorium is more abundant in the Earth's crust than uranium, there are significantly fewer thorium-based minerals (Hazen et al., Reference Hazen, Ewing and Sverjensky2009). This is largely due to the variety of stable oxidation states of uranium and the more soluble nature of uranium in these oxidation states than Th4+ (Burns, Reference Burns, Burns and Finch1999). Although thorium is present as a substitute element in many minerals, there are far fewer natural compounds in which thorium acts as the main building element. Given the importance of thorium in the geological processes, being associated with rare earth ores, as well as the growing interest in thorium as a source of nuclear fuel, and the relatively undeveloped state of thorium exploration chemistry (Mann et al., Reference Mann, McMillen and Kolis2015), it is useful to expand knowledge of the crystal chemistry and other features of thorium minerals.
In the present work, the single-crystal X-ray diffraction data and crystal structure refinement of a turkestanite crystal, (Th0.84U0.12)Σ0.96(Ca1.24Na0.65)Σ1.89(K0.75☐0.25)Σ1.00Si8O19.72(OH)0.28, made it possible to analyse the size of the channels in the sample studied. The luminescence of the uranyl (UO2)2+ ion is documented in turkestanite. The bands corresponding to the charge transfer transition from the 2p states of the ligand to the 5f state of uranium are observed in the excitation spectrum.
As a consequence, the detailed crystal-chemical features of the mineral studied can help to determine their potential for use in different fields of industrial applications.
Acknowledgements
This research was supported by the Russian Science Foundation (project no. 22-27-00183, https://rscf.ru/project/22-27-00183/).
Supplementary material
To view supplementary material for this article, please visit https://doi.org/10.1180/mgm.2023.3
Competing interests
The authors declare none.