Introduction
Large ruminants are key assets for smallholder farmers in developing countries. Cattle contribute to poverty reduction as investments and as buffers during times of economic uncertainty (Owen, Reference Owen2005). Additional benefits include animal traction, fuel and fertilizer from manure, and income from milk, meat and hides. The use of cattle manure as organic fertilizer and fuel (heating, cooking and biogas production) is common in developing countries. Informal manure trade is a less common, but very important component of smallholder crop–livestock systems in some regions (Hoffmann et al., Reference Hoffmann, From and Boerma2014). However, little is understood about the structure and function of manure trade systems, information that establishes a foundation for chain improvement.
Previous studies have focused on the potential economic benefits of manure trade and the overall structure of local trade systems, but have not targeted a detailed description of manure participants, manure use, regional manure flows, manure-related labor or the economics of manure trade for different actors (Lekasi et al., Reference Lekasi, Tanner, Kimani and Harris2001; FAO, 2005; Köhler-Rollefson, Reference Köhler-Rollefson2005; Olayide et al., Reference Olayide, Alene, Ikpi and Nziguheba2009; Harsdorff, Reference Harsdorff2012; Kirigia et al., Reference Kirigia, Njoka, Kinyua and Young2013). Few studies have explored manure value chains in depth. Harsdorff (Reference Harsdorff2012) reported the importance of the informal manure industry to the national economy in India: one manure-related job exists for every two jobs in the milk industry and manure makes up about 10% of the total economic value from milk production systems. Lekasi et al. (Reference Lekasi, Tanner, Kimani and Harris2001) reported a high value placed on manure by farmers in the Kenyan highlands (approximately 30% of annual milk production value), reflecting perceived soil fertility benefits. Kirigia et al. (Reference Kirigia, Njoka, Kinyua and Young2013) demonstrated that over 80% of households interviewed in central Kenya participated in manure trade, and manure-related labor was undertaken primarily by women. They estimated manure value throughout the supply chain and observed seasonal variation in demand. Sales were either to traders, farmers or larger horticultural farms, which often occurred via traders.
In Vietnam, cattle produced on smallholder farms in the south-central coast provide income from live animal sales, contribute to national beef supply (Ba et al., Reference Ba, Lane, Parsons, Van, Khanh, Corfield and Tuan2013; Parsons et al., Reference Parsons, Lane, Ngoan, Ba, Tuan, Van, Dung and Phung2013), provide animal traction, and produce manure for crop fertilization and sale. Cattle manure is an important on-farm organic resource, and manure management poses a significant decision. On the south-central coast, cattle manure can be applied to cash crops (e.g., rice, peanuts and cassava), cultivated forages or sold. Cattle manure value chains play an important role in smallholder crop–livestock systems in Vietnam, although existing manure value chains have not yet been described or evaluated in detail (Birch et al., Reference Birch, Bonney, Ivel and McPhee2014). Manure supply chains have been observed in several studies, including hog manure trade in north Vietnam (Colson and Boutonnet, Reference Colson, Boutonnet, Porphyre and Coi2006; Vu et al., Reference Vu, Tran and Dang2007), cattle manure sales between cattle owners and coffee farmers in the Central Highlands (Đắk Lắk Province) (Cramb et al., Reference Cramb, Purcell and Ho2004), and an unregulated manure market in southeast Vietnam near Ho Chi Minh City (Dan et al., Reference Dan, Hoa, Hung, Tri, Hoa, Hien and Tri2004). However, manure is minimally treated in the overall value chain literature in Vietnam and other regions of Asia, Africa and Latin America, despite its importance in smallholder crop–livestock systems (Hoffmann et al., Reference Hoffmann, From and Boerma2014).
We aim to improve knowledge of manure trade by describing value chains originating in two lowland communes of south-central coastal Vietnam, one in Bình Định Province and another in Phú Yên Province. We characterize manure value chain participants, locations, roles and manure use by applying a traditional survey-based approach to value chain description and quantification (Kaplinsky and Morris, Reference Kaplinsky and Morris2001; Rich et al., Reference Rich, Ross, Baker and Negassa2011). In this first-stage assessment, we target the linkages and structure of the value chain with quantification of net incomes, expenditures and manure use. Detailed results for participants in the value chain network shed light on the economics of manure transactions, overall financial implications, labor and seasonality of trade. Researchers and development agencies can benefit from this information by better understanding the role of cattle manure as an important byproduct in smallholder crop–livestock systems and the impact of manure value chain participation on different actors. It can also provide insight about nutrient redistribution via manure trade at the landscape scale and implications of manure trade for sustainable nutrient management in smallholder systems. Ultimately, this information provides an initial characterization necessary as a basis for further analytical work (e.g., value chain simulation modeling) to assess potential interventions to improve outcomes from manure value chains.
Methods
Survey methodology
Two lowland communes with active manure trade in south-central coastal Vietnam were selected as manure value chain initiation points based on recommendations from researchers at Huế University of Agriculture and Forestry: Nhơn Khánh Commune (NK) in Bình Định Province and An Chấn Commune (AC) in Phú Yên Province. Informal discussions with agricultural extension educators and village leaders generated preliminary value chain maps and identified key actors and manure traders in lowland communes. Agricultural extension educators serving each commune assisted with identification of the lowland farmer sampling frame, a list of all households owning cattle and number of animals owned. Cattle were local yellow or crossbred (Bos indicus). Most cattle owners cultivated small plots of rice, forage, maize, watermelon, peanuts and other cash crops. Overall household cattle ownership in AC (390 households owned cattle) was 3.7 animals with SD ± 2.8 animals and 2.2 animals with SD ± 1.1 animals in NK (1045 households owned cattle). Lowland cattle owners were selected using a stratified random sampling approach, with strata defined by population proportion in each household herd size group (3 strata: 1–3 head, 4–6 head and >7 head). Stratification ensured representation of the large herd size group in our sample.
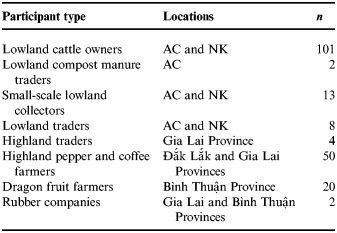
Data collection was undertaken between April and September 2013 using semi-structured in-person interviews with manure suppliers (lowland cattle owners), manure traders and end users (highland coffee and pepper farmers, southeast coastal dragon fruit farmers and rubber companies) (Table 1). Manure collectors and traders were divided into four categories: (1) Lowland compost manure traders (only in AC) who purchased and resold composted manure locally; compost collectors were oxcart owners and drivers, and undertook compost manure trade as part of their local transport business; (2) Lowland small-scale collectors and oxcart transporters who purchased bagged manure from surrounding farms as a service to larger lowland traders and stored it at a collection point for pickup by larger traders; (3) Lowland traders who purchased manure from farmers and small-scale collectors, stored it, and resold it to distant locations; and (4) Highland traders who purchased manure from lowland and highland locations to resell in the highlands.
Manure value chain participants interviewed in the study.

AC, An Chấn Commune in Phú Yên Province; NK, Nhơn Khánh commune in Bình Định Province.
Responses to survey questions represented farmer and trader perceptions, which (as in all recall surveys) may differ from measured quantities. A street-clothed member of the regional police force accompanied researchers during collector and trader interviews in NK. Interviews were conducted in Vietnamese, and duration ranged from 10 to 90 min, with an average duration of approximately 40 min. Questionnaires consisted of modules including: (1) cattle management (lowland farmers only); (2) manure-related labor (lowland farmers and traders only); (3) manure transactions [Monetary values reported during interviews were in Vietnam đồng (VND). An approximate exchange rate in 2013 was 21,000 VND/USD, and value data are reported throughout the manuscript in USD using this conversion factor.]; (4) annual manure trade; and (5) fertilizer and manure use (lowland and destination farmers). Transaction data may be more accurate than annual data for most value chain actors because transactions represented specific recent buyer–seller interactions, whereas overall sales and purchases were estimated on an annual basis from approximate cumulative monthly and seasonal purchases and sales.
It was not possible to obtain representative samples for value chain participants downstream from product origin (lowland farms) because information about downstream participants was unavailable prior to the upstream interviews, and a bounded sampling frame did not exist for downstream participants. Thus, beginning with lowland cattle farmers in NK (n = 51) and AC (n = 50), our downstream sampling processes aimed to obtain representative samples for predominant actors identified during preceding interviews. All lowland traders and collectors identified in NK and AC communes were interviewed. Small-scale lowland collectors and higher-capacity lowland traders identified most predominant manure destinations, including highland traders, rubber companies and specific destination districts and communes. Four highland traders were interviewed, three in person and one by phone. The five most frequently mentioned highland destinations and two secondary destinations in Bình Thuận were selected for end user sampling. Ten representative households in villages in a single commune per district were then selected with the assistance of commune extension educators serving each destination commune. End users procured manure from other sources than AC and NK communes. Thus, although the selection process was not necessarily representative for some downstream participants (e.g., end users), it enabled effective downstream chain characterization for districts in primary value chain destinations.
Lowland farmer labor and returns to labor were evaluated based on reported hours invested in steps to prepare and sell one cubic meter of manure (e.g., transfer from stalls, spreading or making manure cakes to dry, drying, bagging and delivery to buyers) and the revenue generated from manure sales for each hour invested in preparation and sale. Labor invested per cubic meter of manure sold was calculated by dividing total estimated hours for yearly manure-related labor for sold (dry) manure by total annual manure revenue for each household interviewed. Similarly, returns to labor (US$ h−1) were calculated as total annual manure revenue divided by total estimated hours for yearly manure-related labor.
Annual revenues for traders and collectors were estimated as the difference between the product of reported annual manure sale prices and volume, and the product of purchase price and volume. Reported hired labor costs and transport costs were then subtracted from revenue to estimate net incomes from manure trade activities. Returns to labor for traders were calculated as net income divided by annual manure trade labor.
Annual manure volumes sold from lowland communes were estimated in two ways: (1) annual household sales volumes reported by lowland farmers were multiplied by number of households selling manure; and (2) cattle numbers and factors influencing manure available for sale in lowland communes according to: Commune cattle population × 700 kg manure DM cow−1 yr−1 × fraction households selling manure × [(1 − daily grazing hours/24) × fraction households using grazing management + (1 − fraction households using grazing management)] × fraction available manure sold × cubic meters per kg manure DM. [de Haan et al. (Reference de Haan, Steinfeld and Blackburn1999) estimated 1 Mg manure DM/tropical livestock unit (250 kg live weight) per year and about 0.7 tropical livestock units per tropical cow. Thus, one cow produces about 700 kg manure dry matter (DM) yr−1.] Estimates based on overall cattle numbers were more conservative and were used to estimate aggregated manure flows through the value chain.
Manure sample collection and chemical analysis
Subsamples of manure products (i.e., dried feces) that were ready for sale were collected from AC and NK farmers. Samples were dried at 60°C in a forced-air oven to determine DM concentration. Chemical composition was tested at the Soil Science Laboratory at Huế University of Agriculture and Forestry. Tests included organic matter [Walkley–Black method, as described in Nelson and Sommers (Reference Nelson, Sommers, Sparks, Page, Helmke, Loeppert, Soltanpour, Tabatabai, Johnston and Sumner1996)], total N [Kjeldahl methods, as described in Bremner (Reference Bremner, Sparks, Page, Helmke, Loeppert, Soltanpour, Tabatabai, Johnston and Sumner1996)], and total P [samples were ashed at 450°C and then digested with perchloric acid and nitric acid, as described in Kuo (Reference Kuo, Sparks, Page, Helmke, Loeppert, Soltanpour, Tabatabai, Johnston and Sumner1996)]. Price of nutrients in manure and fertilizer was calculated as product price per kg/kg nutrient per kg product DM.
Statistical analysis
Statistical analyses were executed in JMP Pro 11.2.0 (SAS Institute Inc., 2013b). The sampling unit was the household for farmers and the interviewee for traders and collectors. Descriptive statistics and bivariate and multivariate statistical models (analysis of variance) were constructed to evaluate differences among locations, value chain actors and other factors impacting economics of manure trade. For lowland farmer transaction models, fixed effects were tested individually in mixed models fitted with restricted maximum-likelihood methods. Mixed models contained household as a random effect to account for dependence of transactions within household. Mean differences (P ≤ 0.05) were assessed with Tukey's adjustment for multiple comparisons or a t test for comparison of two groups. Retrospective power of tests for mean differences was calculated for fixed effects models. Residuals were evaluated for normality, and log and square root transformations were applied to response variables as needed to improve model fit. Geometric means and 95% confidence intervals were calculated for transformed data in lieu of means and standard errors. The odds of lowland farmers recording at least one manure sales event were determined using PROC LOGISTIC (SAS Institute Inc., 2013a).
Results and Discussion
Farmers in this study placed high importance and value on endogenous sources of organic matter such as livestock manure. Active informal manure trade existed between south-central coastal Vietnam and the Central Highlands and southeast lowlands. Barriers to smallholder market entry for value-added agricultural products such as high transactions costs (Markelova et al., Reference Markelova, Meinzen-Dick, Hellin and Dohrn2009) did not appear to constrain smallholder participation in manure trade due to the presence of local collectors and traders, who were often farmers themselves. Furthermore, there were few requirements to produce manure product and resources were readily available, including animals (cattle), labor to collect, dry and bag manure, and large bags (sacks), which were provided by traders. Moreover, the structure of informal cattle manure value chains in the region favored participation by smallholder lowland cattle farmers because they were one of the few potential sources of livestock manure to supply highland markets in quantities demanded. Lowland farmers were able to sell as much or as little manure as they desired. The perceived constraints to chain operation were difficulty drying manure combined with low highland demand and low sales prices during the rainy season.
Manure flows
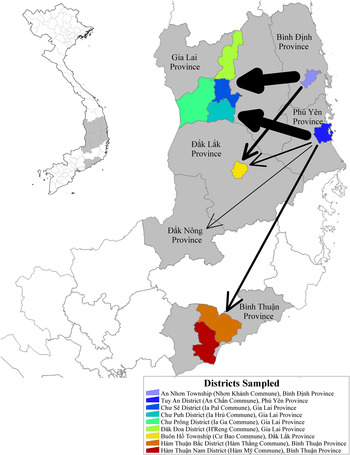
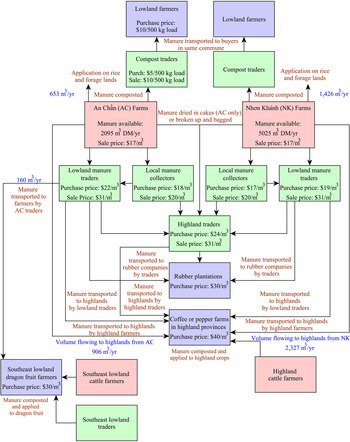
Lowland cattle farmers often chose to sell cattle manure during the dry season. Via a network of chain participants, dry manure product reached the Central Highlands and southeastern coastal regions where it was used as an organic matter soil amendment for black pepper, coffee, dragon fruit and rubber production by individual farmers and companies. Estimates of manure flows and destinations (Fig. 1) were determined from interviews with lowland traders and small-scale lowland collectors in AC and NK communes. The sampling process facilitated quantification of these manure flows and associated value chain participants, steps between communes in the south-central lowland coast and highland and southeast coastal destinations, aggregated volumes and prices (Fig. 2). From NK, approximately 80% of manure sold was transported to Gia Lai province and 20% to Đắk Lắk Province in the Central Highlands. From AC, 70% was transferred to Gia Lai, 10% to Đắk Lắk, and 5% to Đắk Nông in the Central Highlands. Fifteen percent of AC manure was used on dragon fruit farms in Bình Thuận Province late in the year (August onward). Highland destinations included pepper farms, coffee farms and rubber companies.
Map of study areas in Vietnam with whole country inset. Provinces are gray. Districts sampled are colored areas within provinces. Manure flow from sampled lowland communes to principal destinations is denoted by black arrows, and arrow width is proportional to flow size reported by lowland manure traders.

Probable manure flows (arrows), associated participants and prices (in boxes: pink = manure sources, green = traders, blue = end users), aggregated volumes (blue text) and steps (brown text) between lowland communes and highland (pepper and coffee farmers) or southeast coastal (dragon fruit farmers) destinations.

The following general results for participants in the value chain network shed light on the structure and function of cattle manure value chains operating in south-central Vietnam, including manure supply, manure trade destinations, value addition, prices and earnings for value chain participants, fertilizer equivalence of alternatives to manure, economic opportunities for suppliers and end users and overall chain implications. These results are supplemented by detailed quantitative results for value chain participants in the Supplementary Material.
Manure origin and supply
Most farmers reported at least one manure sale event (AC = 76%, NK = 90%), and those that sold manure reported sales of 62% with SE ± 2.9% of available farm manure. Most owners (62%) took cattle out to graze on communal land or vacant fields year round during the day (7.5 h day−1 in AC; 3.6 h day−1 in NK), and did not collect manure during the grazing periods, so some manure production was not available for sale and application to crops. Supplementary feeding was undertaken during remaining non-grazing daytime hours and at night. Most manure sales in NK and AC occurred in the dry season between February and August, because manure was easier to dry for transport and demand was high for organic amendments in regions purchasing manure. The average chemical composition of dry manure products was: 89% DM with SD ± 0.03% DM, 187 g OM kg−1 DM with SD ± 56 g OM kg−1 DM, 12.7 g N kg−1 DM with SD ± 3.7 g N kg−1 DM and 5.9 g P2O5 kg−1 DM with SD ± 2.7 g P2O5 kg−1 DM. The period when farmers can dry manure did not usually compete with periods of demand for fertilization of lowland crops (e.g., rice), because farmers compost manure late in the dry season (August) and in the rainy season (September to December) for application on the first rice crop (winter–spring), second rice crop (summer–fall), or forage crops. Composted manure, the principal form used for application on cultivated crops, stored from August or September to January was reportedly sufficient to fertilize crops at desired manure application rates for most farms. Farmers generally reported manure sales as an opportunity to generate income from excess not needed on their own land and the odds of registering at least one manure sale event increased with household herd size. Manure surplus (0.5–2.5 Mg DM ha−1 yr−1) was corroborated by farmer reports about household cattle manure production, cropping area, reported crop application frequency and rates (Supplementary Material, Table A2). Minimal evidence of local manure trade or non-monetary manure trade existed in the regions surveyed. It is likely that non-monetary manure trade only occurred on a local basis. One AC farmer reported purchase of local composted manure for watermelon production, whereas another farmer reported multiple compost sales to a neighboring watermelon farmer. Two farmers reported local trade of composted manure for rice straw and forage to feed cattle, which may influence local nutrient cycles by more evenly distributing nutrients in cattle manure on lowland agricultural lands.
Farmers prepared manure for sale by drying it on the ground or in cakes on posts, branches or walls for approximately four days under favorable (dry, sunny) conditions. Dry manure product was bagged and sold to local manure collectors who arranged transfer to traders or farmers in the highlands. Farmers in AC that did not have access to concrete slabs or paved roadside to spread manure out to dry (broken-up form) generally prepared manure for sale in cakes to prevent sandy soil contamination, although manure cakes were a less desirable product according to manure buyers, and may be accepted by some buyers only when mixed with broken-up manure. Furthermore, cake density in bags or loaded on trucks was lower than broken-up manure, which combined with end user preference for broken-up manure, may explain the lower price of manure cakes. Farmers perceived cakes without sand as more valuable than broken-up manure with some sand. Rubber companies were the primary consumers of manure cakes (often mixed with broken-up manure) for fertilization and commercial phân vi sinh production, a common manure substitute that is made from cattle manure and other additives by some rubber companies (available commercial chemical formulation given in Supplementary Material). Destination farmers did not knowingly purchase manure cakes, although they could buy products that consisted of manure cakes mixed with broken-up manure in some purchase transactions. Production of manure cakes, despite lower prices and end user preference for broken-up manure, suggests lack of information flow through the chain from end users to lowland cattle farmers. The use of tarps or plywood sheets to dry manure could permit AC farmers without access to concrete slabs or paved roadside to process manure in broken-up form.
Larger time investment (h m−3 dry manure) was expected for manure cake preparation (based on researcher observations), but not reflected in reported labor. Cakes were generally prepared by children and elderly, and this labor may have been valued lower than adult labor by the adult farmers that were surveyed.
Higher transaction volumes and transaction revenues in NK reflected larger manure bag sizes relative to AC, less frequent sales, and more semi-intensive cattle operations (less grazing time relative to AC). Annual household revenues were higher for NK despite lower household herd sizes than AC. Available manure per household was slightly lower in AC, reflecting four more grazing hours per day relative to NK. However, returns to manure-related labor did not differ by commune.
Nhơn Khánh and AC communes could supply a maximum of 814 Mg DM yr−1 and 384 Mg DM yr−1, assuming 700 kg manure DM per animal yr−1 (de Haan et al., Reference de Haan, Steinfeld and Blackburn1999), manure collection only when animals are not away from the household grazing (i.e., in nearby vacant fields or communal lands) and 62% sales of available manure for households selling manure. Applying the same assumption to their respective districts, maximum potential manure supply from An Nhơn and Tuy An would be 10,049 and 8976 Mg yr−1. At average nutrient concentrations in dried manure, each district could supply approximately 1800 Mg OM, 120 Mg N and 55 Mg P2O5 yr−1, potentially making an important contribution to highland and southeast coastal organic matter and nutrient demands.
Cattle and manure density
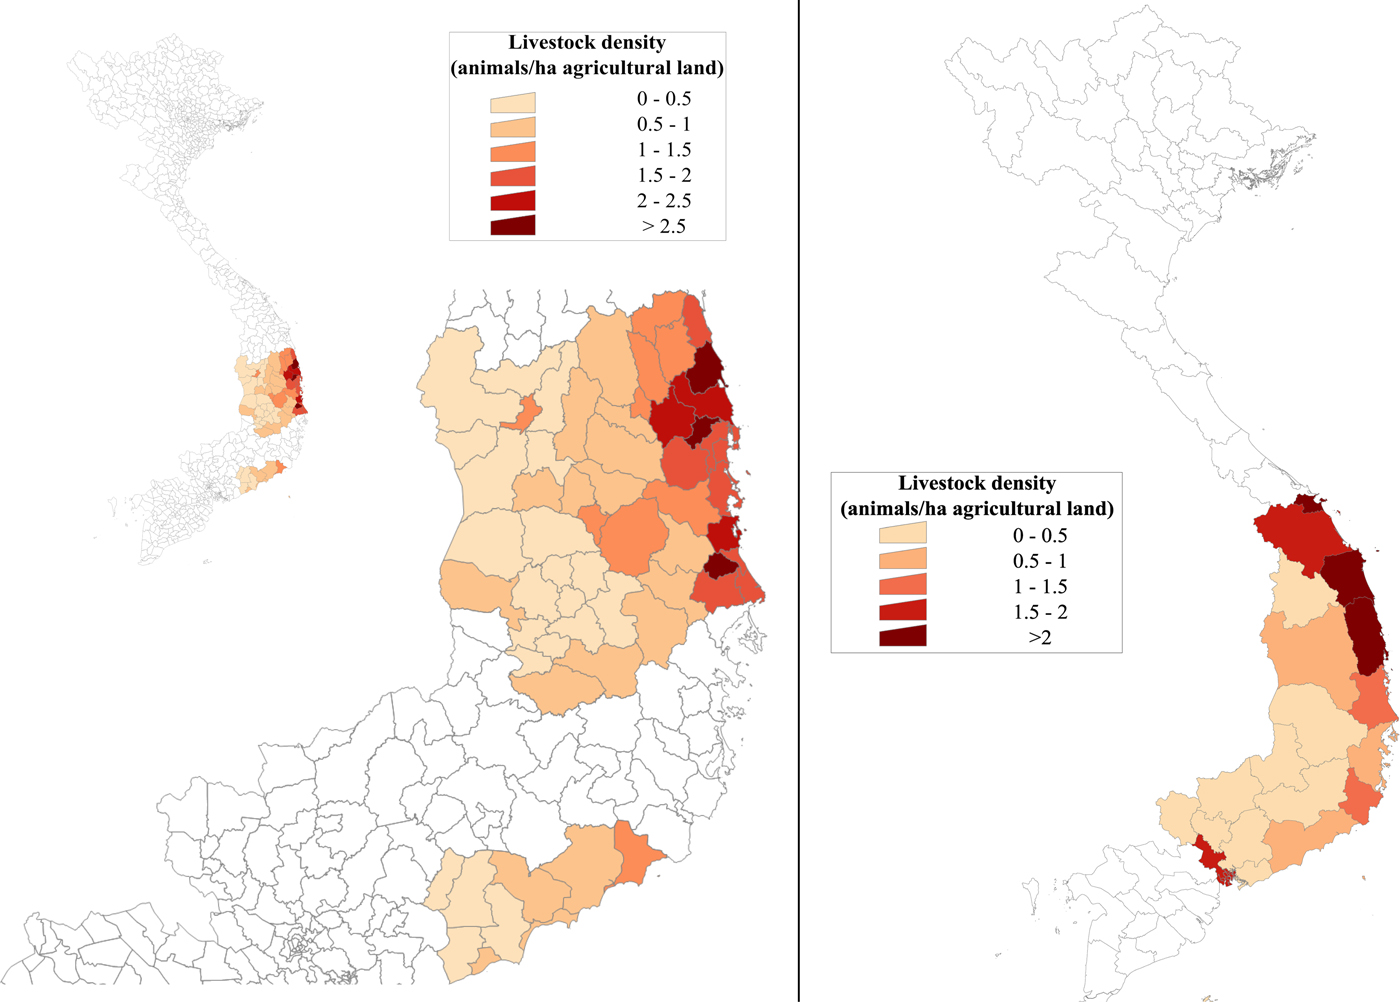
Livestock (cattle and buffalo) density was higher per ha of agricultural land for coastal provinces and districts in the study area than for Central Highland provinces and districts (Fig. 3) (Binh Dinh Statistics Office, 2013; Binh Thuan Statistics Office, 2013; Dak Lak Statistics Office, 2013; Gia Lai Statistical Office, 2013; Phu Yen Statistics Office, 2013; Socialist Republic of Vietnam General Statistics Office, 2014). Because of manure bulk and transport costs, manure trade likely existed primarily among neighboring provinces (e.g., AC manure flowed south to Bình Thuận, while NK manure did not), although it is possible that not all districts with high livestock concentrations were involved in manure trade.
Livestock (cattle and water buffalo) density (animals ha−1 agricultural land) for districts in study provinces (Bình Định, Phú Yên, Gia Lai, Đắk Lắk and Bình Thuận) in 2012 (left) (Binh Dinh Statistics Office, 2013; Binh Thuan Statistics Office, 2013; Dak Lak Statistics Office, 2013; Gia Lai Statistical Office, 2013; Phu Yen Statistics Office, 2013) and for provinces in the south-central coast, Central Highlands and southeast in 2013 (right) (Socialist Republic of Vietnam General Statistics Office, 2014).

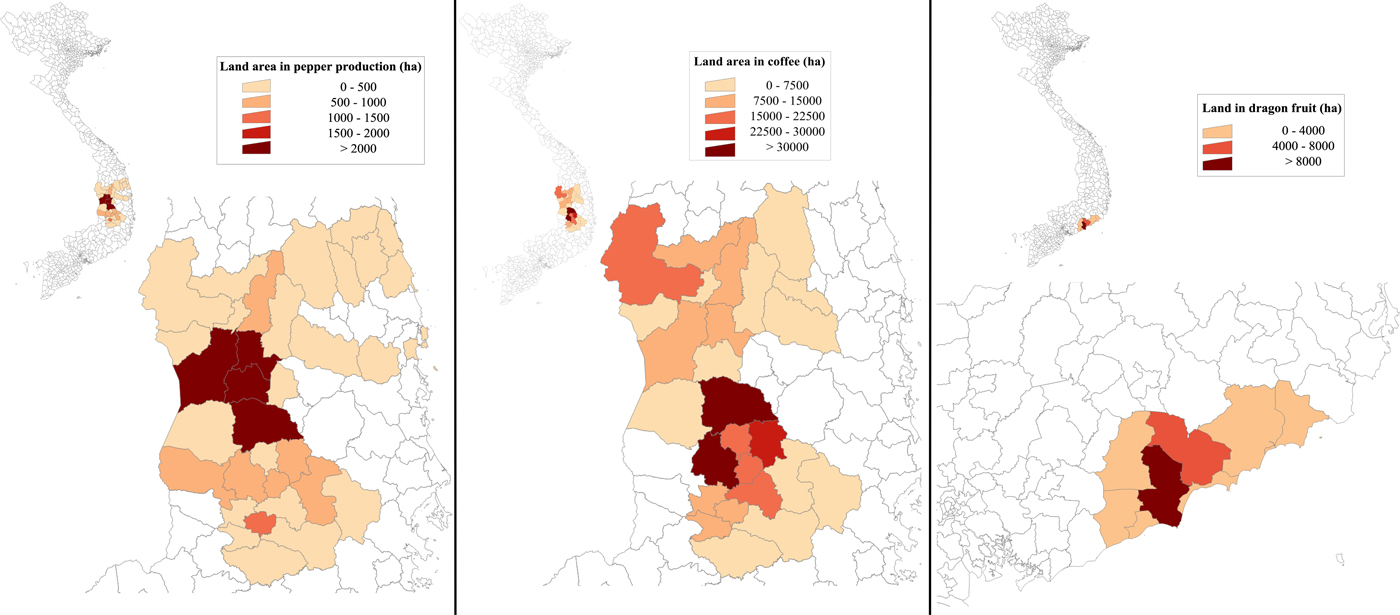
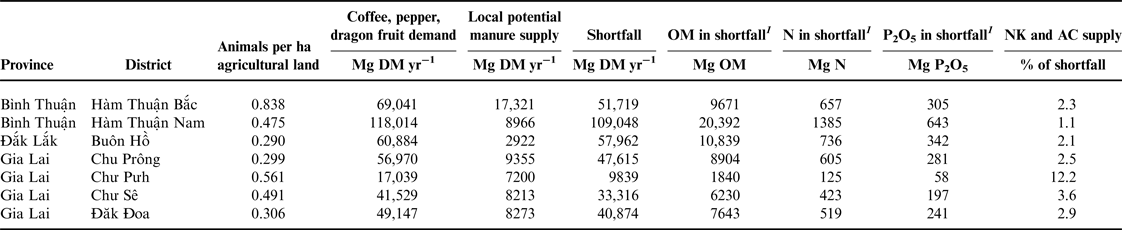
Thus, livestock density is likely to play a key role in the flow of manure from lowland south-central coastal regions to highland and southeast coastal destinations (Fig. 3). Manure supply exceeded demand in many higher animal density lowland regions, while manure shortfalls existed in Central Highland and southeast coastal regions that cultivated higher value crops (e.g., pepper, coffee, dragon fruit and rubber) (Fig. 4; Table 2). Cattle numbers in Gia Lai districts, which received the highest amount of manure, have continued to rise and augment greater intra-regional trade, although countrywide numbers and numbers for surrounding provinces have declined from nearly 7 M in 2007 to just over 5 M in 2013 (Socialist Republic of Vietnam General Statistics Office, 2014). The continual rise in pepper and coffee production area in Gia Lai and Đắk Lắk since 2005 (not shown) and in dragon fruit production in Bình Thuận since 2008 has increased manure demand (Binh Thuan Statistics Office, 2013; Dak Lak Statistics Office, 2013; Gia Lai Statistical Office, 2013).
Distribution of land established in pepper in Gia Lai, Đắk Lắk and Bình Định districts (left), coffee in Gia Lai and Đắk Lắk districts (center) and dragon fruit in Bình Thuận districts (right) in 2012 (Binh Dinh Statistics Office, 2013; Binh Thuan Statistics Office, 2013; Dak Lak Statistics Office, 2013; Gia Lai Statistical Office, 2013).

Livestock (cattle and water buffalo) density, manure demand for high-value crop production, local potential supply, district manure shortfall, OM and nutrients in potential shortfall and the percentage of that shortfall that could be covered by Nhơn Khánh (NK) and An Chấn (AC) Communes in manure-purchasing highland and southeast coastal districts.

1 Calculations are based on the average chemical composition of samples of dry manure sold in lowland communes: 187 g OM kg−1 DM, 12.7 g N kg−1 DM and 5.9 g P2O5 kg−1 DM.
Manure destinations
Soil characterization, constraints and opportunities for highland soils
Constraints to agricultural productivity on central highland soils in Vietnam include P fixation, Al toxicity, low cation exchange capacity, low plant available water capacity, compaction and low K (Moody et al., Reference Moody, Cong, Legrand and Chon2008). Cattle manure is an important source of organic matter that can be effective when used together with inorganic fertilizer for maintenance of long-term soil productivity (Goyal et al., Reference Goyal, Chander, Mundra and Kapoor1999; Kaur et al., Reference Kaur, Kapoor and Gupta2005; McRoberts et al., Reference McRoberts, Ketterings, Parsons, Hai, Quan, Ba, Nicholson and Cherney2016). The ability of cattle manure to increase soil organic matter, to buffer soil pH, improve cation exchange capacity, supply P and K and improve water holding capacity (Zingore et al., Reference Zingore, Delve, Nyamangara and Giller2008) directly addresses highland soil fertility challenges. According to highland farmers, low soil pH, low soil organic matter and poor soil fertility occurred where composted cattle manure applications were not possible, which may drive the high seasonal demand for cattle manure by destination farmers. Thus, farmers and extension educators recognized the importance of cattle manure to soil fertility, and have incorporated it into yearly soil amendment strategies, especially for higher-value crops.
Manure destinations and demand
The most common trader-reported destination for NK and AC manure was Chư Sê District in Gia Lai. The number of cattle and water buffalo in Chư Sê in 2012 was 19,554 (98% cattle) and there were 39,845 ha of agricultural land (including 2131 ha pepper and 9129 ha coffee), yielding a livestock (cattle and water buffalo) density of 0.491 animals ha−1 agricultural land (Fig. 3; Table 2). This density was much lower than in lowland districts containing the communes sampled in this study (2.54 animals ha−1 in An Nhơn and 2.13 animals ha−1 in Tuy An). Assuming 700 kg manure DM per animal yr−1 (de Haan et al., Reference de Haan, Steinfeld and Blackburn1999) and 60% manure availability for agricultural use or sale in semi-intensive systems (Harsdorff, Reference Harsdorff2012), 8213 Mg manure DM could have been available from Chư Sê sources in 2012. Generously assuming all this manure could be allocated to pepper lands at farmer-defined rates (Supplementary Material, Table A16) of 4.43 Mg ha−1 yr−1 and coffee lands at 7.03 Mg ha−1 every 2 years, 41,529 Mg manure DM would be required annually just to fertilize pepper and coffee lands. The 33,316 Mg DM yr−1 shortfall would actually be much larger because not all available manure was applied to higher value cropland. The deficit needs to be filled by manure purchased from other provinces and districts in south-central Vietnam (e.g., NK and AC communes) with higher animal densities and probable manure surpluses (Fig. 3). Similar animal densities and manure shortfalls were calculated for other destinations in this study (Table 2). Mean district shortfall calculated for all districts in Gia Lai, Bình Thuận and Đắk Lắk was 22,612 Mg DM yr−1, and most districts (24/42) experienced shortfalls based on these calculations. Surpluses existed only in districts that produced little or no higher value crops. The total estimated manure shortfall just for application on higher value croplands in these provinces was 949,700 Mg DM yr−1, consisting of 177,590 Mg OM, 12,060 Mg N and 5600 Mg P2O5. Manure purchases constituted nearly all organic matter flows and an important source of macro- and micro-nutrients flows into these regions for higher value crop production (Supplementary Material, Table A17).
The overall yearly manure demand for dragon fruit production in Bình Thuận was calculated at 211,667 Mg DM, which was lower than demand for pepper and coffee production in Gia Lai (310,290 Mg DM) and Đắk Lắk (733,393 Mg DM). Manure traders considered sales to Bình Thuận as secondary manure trade income because prices and overall demand were lower. Furthermore, these sales occurred later in the year (starting in July or August), concurrent with the end of the highland trade season. Our investigations did not reveal direct manure value chain linkages between manure of Vietnamese origin and neighboring countries (i.e., Laos and Cambodia), although others have hypothesized that these linkages may exist (Birch et al., Reference Birch, Bonney, Ivel and McPhee2014).
Value addition
Value was added to manure due to changes in place utility, time utility and form utility via drying, bagging, collection, transport and composting prior to highland application. Greatest changes in manure product value occurred between collector and trader acquisition of manure and sale to destination buyers (US$10–20 change m−3). Changes also occurred between animal excretion and farmer sale (at a mean price of US$16 m−3), although an unknown proportion of cattle production costs could be assigned to manure production and to the opportunity cost of manure use to fertilize crops on farm. Farmers added most form utility via production of dry manure product by gathering excreted manure, drying it in cakes or broken-up form, and bagging it for sale, thus transforming animal byproduct into a valuable marketable source of organic matter. Drying removed most weight from manure to facilitate transportation over long distances.
Collectors and traders constituted the essential value chain linkages between lowland cattle suppliers and distant destinations, and added value to manure products due to changes in place utility, time utility and form utility. Place utility was added by manure aggregation (accumulating small quantities of lowland manure from spatially-dispersed farms) and by transfer to destinations. This simplified market entry for smallholder manure sellers by decreasing or removing distance to market barriers and reducing associated labor for sellers. It also simplified manure purchase for destination buyers by providing a direct point of contact for highland buyers. The change in value between trader acquisition and end user purchase could be attributed primarily to changes in place utility via transport of product demanded by users over distances (100–400 km).
Small-scale lowland collectors also added value due to changes in place utility because they often worked for lowland traders by providing linkages between dispersed farmers and traders at a set rate (per bag). Thus, prices, transaction volumes, overall trade volumes, labor, returns to labor and net incomes were all lower for small-scale lowland collectors than for traders. Returns to labor for NK collectors and traders were twice as high as for AC collectors and traders, probably due to lower returns for manure cake transactions in AC.
Value was also added due to changes in time utility. Manure was transported to destinations at the time when it was needed for preparation of organic soil amendments by farmers. Traders added less value from changes in form utility, because dry manure was frequently removed from bags for sale by the cubic meter, as preferred by buyers. We found minimal evidence of possession utility, and a potential opportunity for credit in the region.
Daily wage laborers contributed to changes in place and time utility. They were secondary beneficiaries of manure trade, seasonally hired by traders and collectors to gather, load and unload manure. We were not able to determine daily wages for hired laborers, because they were paid by the bag or cubic meter (US$0.71 m−3). However, wages were likely consistent with daily rates for agricultural labor in the study region (estimated at US$2–5 day−1).
Quantitative comparison of value chain prices and earnings
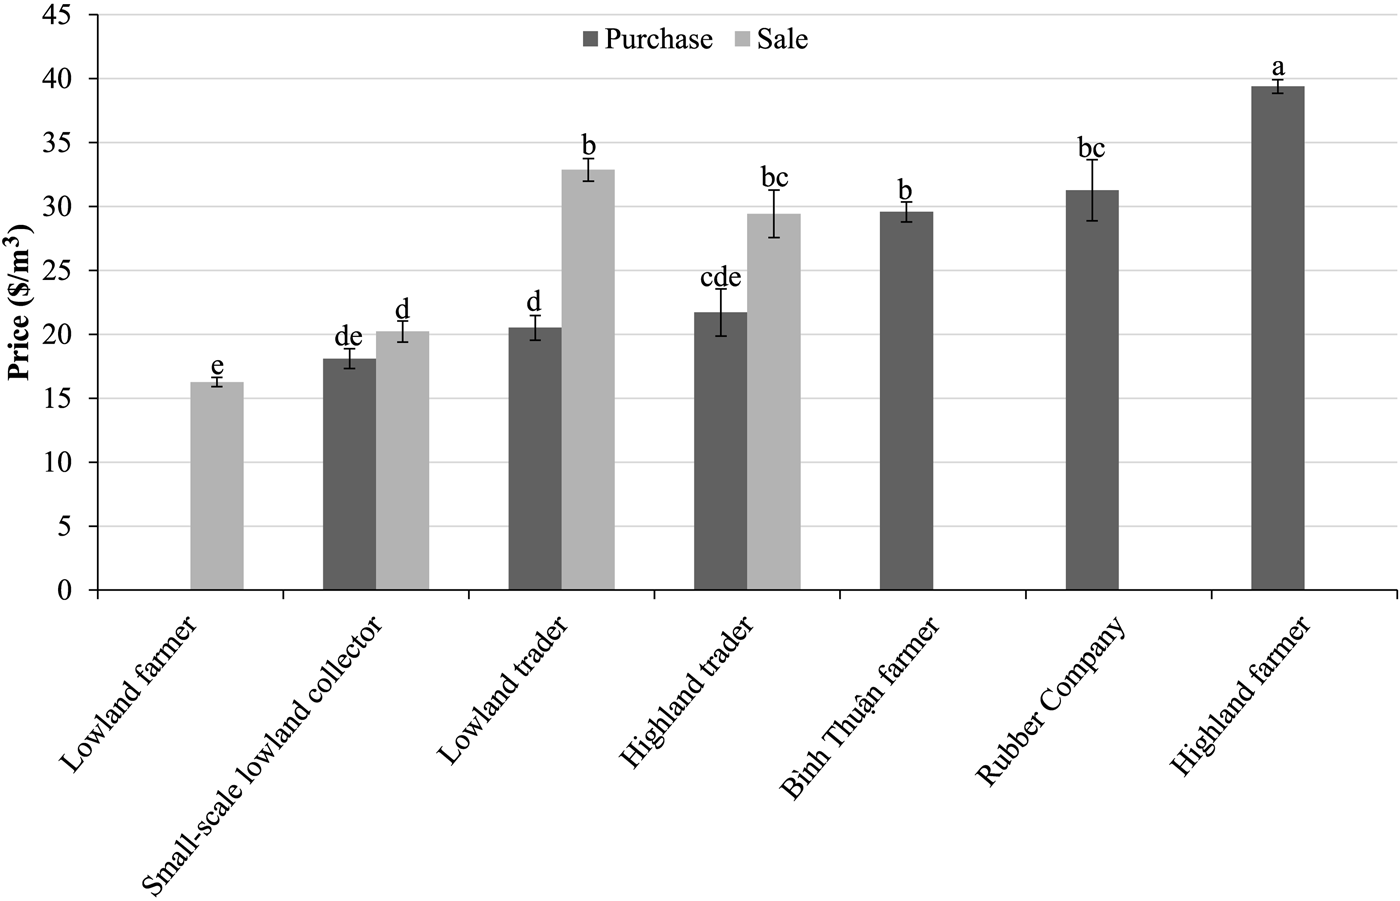
Manure purchase and sale prices in transactions were combined in a single statistical model to demonstrate price progression through value chain participants, and to provide qualitative evidence for value addition at different steps (Fig. 5). The difference between purchase and sale prices was higher for lowland traders than other intermediaries due to manure transport over long distances (100–400 km). Highland pepper and coffee farmers purchased manure for a significantly higher price than rubber companies and dragon fruit farmers. Annual manure expenditures by end users (Supplementary Material, Table A21) represented 0.3, 1.2 and 1.3 times the annual rural per capita income for Đắk Lắk, Gia Lai and Bình Thuận Provinces, respectively (Binh Thuan Statistics Office, 2013; Dak Lak Statistics Office, 2013; Gia Lai Statistical Office, 2013). This indicates the value of manure trade to these higher value cropping systems, although these farms probably have much higher net incomes than their provincial rural averages.
Purchase and sale price least-squares means for manure value chain participants through the value chain. Error bars represent 1 SE of the mean. Means connected by the same letter did not differ.

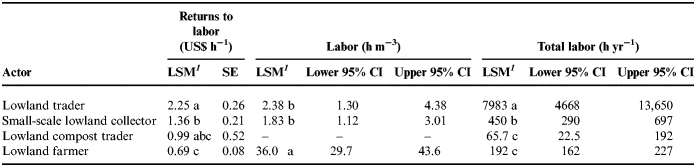
Lowland traders earned significantly more income per hour than small-scale lowland collectors and lowland farmers (Table 3), primarily due to the cost of transportation over long distances (100–400 km) to manure trade destinations. Small-scale lowland collectors also received significantly greater returns than lowland farmers. Labor invested in manure trade (h m−3) was significantly higher for lowland farmers than collectors or traders. Total yearly labor invested in manure by cattle farmers and traders followed a similar pattern to returns to labor (Table 3), suggesting the relative importance of manure to actor livelihoods [e.g., returns (US$ h−1) for large traders more than tripled returns for lowland cattle farmers].
Least-squares means (LSM) and standard errors for returns to labor model (P < 0.0001, Power = 0.9989) and back-transformed LSM (geometric means) and 95% confidence intervals for log-transformed labor use model (P < 0.0001, Power = 1.0) and log-transformed total labor model (P < 0.0001, Power = 1.0) by actor (n = 101 for each model).

1 Means in each labor column not connected by the same letter are significantly different (P ≤ 0.05).
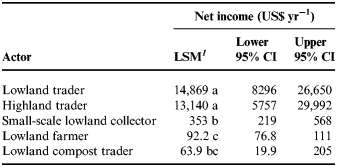
Manure net incomes for manure value chain participants that sell manure were also combined for comparison (Table 4). Manure trader net incomes were significantly higher than small-scale lowland collectors, lowland farmers and compost traders. Small-scale lowland collector net incomes were significantly higher than lowland farmer net incomes. Net incomes (Table 4) again may indicate the relative importance of manure trade participation to livelihoods. Lowland farmers sold manure as an important supplemental form of seasonal income from cattle byproduct after accounting for household crop fertilization needs. Lowland farmer annual net incomes from manure trade were about 1.4 times the monthly average rural income per capita in Bình Định and Phú Yên (Binh Dinh Statistics Office, 2013; Phu Yen Statistics Office, 2013). Small-scale lowland collectors employed in manure trade on a seasonal basis, often in an agreement with traders. They were usually farmers, and manure collection income supplemented farming income. The same was true for lowland compost traders, although these participants also worked as oxcart drivers. In contrast, manure trade represented a primary source of income for lowland and highland traders. Truck owners combined seasonal manure trade with commercial trucking of other products. Some lowland traders were also farmers, but farming was not usually their primary income source. We were not able to evaluate the importance of manure-related income versus alternatives, but labor investment in manure suggests the perceived importance of the activity to actor livelihoods. Furthermore, seasonal fluctuation in manure-related labor indicated that manure trade was more important during pre-rainy season periods of peak trade activity.
Least-squares (geometric) means (LSM) and 95% confidence intervals for log-transformed net income from cattle manure model for manure value chain participants (n = 103, P < 0.0001, Power = 1).

1 Means not connected by the same letter are significantly different (P ≤ 0.05).
Participant net incomes and labor (Table 3; Table 4) suggest that farmers and small-scale collectors are in different socio-economic strata than large-scale lowland and highland traders. Income inequalities, while not investigated in this study, were consistent with expectations for larger businesses relative to more risk-averse lowland farmers and collectors. Furthermore, large-scale lowland and highland traders play a key role in connecting lowland communes that supply manure with destination end users. Value chains originating in these lowland communes would not exist without larger-volume traders, and farmers and small-scale lowland collectors would not be able to participate or benefit from the supplementary income from manure without the linkages facilitated by larger-volume traders. Nonetheless, there could be opportunities to reduce income inequality for value chain actors, particularly in terms of returns to labor. A well-informed, farmer-driven lowland cooperative could act as a larger-volume trader with the aim of increasing farmer incomes. Assessment of the feasibility of this strategy via simulation modeling [e.g., McRoberts et al. (Reference McRoberts, Nicholson, Blake, Tucker and Díaz Padilla2013)] would be an important step prior to implementation.
Manure price and fertilizer equivalence
We assumed 350 kg manure m−3 based on farmer and collector reports. Average DM content of sold (dry) manure (89%), N concentration (12.7 g kg−1 DM) and P2O5 concentration (5.9 g kg−1 DM) were used with average transaction price to calculate fertilizer equivalencies. Price of N in manure sold from farmers to collectors and traders was US$4.11 kg−1 N based on manure transaction rates or US$4.40 kg−1 N for annual rates, which was substantially more expensive per N unit than chemical urea (46:0:0) (US$1.21 kg−1 N, 2013 rates). Price of P2O5 in manure sold was US$8.85 kg−1 P2O5 for transactions or US$9.47 kg−1 P2O5 for annual rates, and was also much more expensive per P2O5 unit than chemical P2O5 in diammonium phosphate (18:46:0; N:P2O5:K2O) (US$1.97 kg−1 P2O5, 2013 rates). Large differences in N and P fertilizer value equivalents indicated that something other than these nutrients was valued in manure. In fact, farmers were unaware of the actual nutrient concentrations in manure, but believed its properties as an organic soil amendment were more important than potential nutrient supply.
Equivalency rates for manure sold to highland farmers by traders were even higher when compared with economical N and P fertilizer sources (6.5–7.5 times the cost of N in urea and 8.5–10 times the cost of P2O5 in diammonium phosphate), due to higher sales prices. A more reasonable highland comparison was with OM in commercial phân vi sinh, which ranged from 13 to 22%. A representative commercial phân vi sinh contained 15% OM and was priced at US$0.21 kg−1 (2013 rates, pre-tax). Thus, the cost of OM in phân vi sinh was US$1.43 kg−1 OM. The cost of OM in manure sold to highland farmers and rubber companies was US$2.07 kg−1 OM and US$1.78 kg−1 OM, respectively (1.2–1.5 times the price of OM in this specific phân vi sinh). Farmers reported that cattle manure was strongly preferred to commercial phân vi sinh, which, combined with high demand for manure and high prices early in the year, increased manure value well above the equivalent price of chemical constituents in alternative commercial products.
Manure prices reported in this study were somewhat different from those reported in the literature for Vietnam. Dan et al. (Reference Dan, Hoa, Hung, Tri, Hoa, Hien and Tri2004) reported 2003 manure prices in southeastern provinces near Ho Chi Minh City at US$5.33 to 8.00 m−3, versus US$16.27 m−3 in lowland farmer transactions in our study. Colson and Boutonnet (Reference Colson, Boutonnet, Porphyre and Coi2006) reported composted hog manure prices at US$3.23/500 kg in north Vietnam, considerably lower than the US$9.00/500 kg composted manure reported here. The 2003 price of composted manure reported by Dan et al. (Reference Dan, Hoa, Hung, Tri, Hoa, Hien and Tri2004) was US$7.23/500 kg. They also observed the price of N in cattle manure at US$3.39 kg−1 and N in compost prepared by farmers at US$0.98 kg−1, under the US$4.11 or 4.40 kg−1 reported by farmers in this study. McRoberts (Reference McRoberts2015) calculated the price of N in composted cattle manure in south-central coastal Vietnam at US$2.86 kg−1.
Colson and Boutonnet (Reference Colson, Boutonnet, Porphyre and Coi2006) observed in north Vietnam that N in cattle manure was five times more expensive than N in urea. Lekasi et al. (Reference Lekasi, Tanner, Kimani and Harris2001) reported that the organic fertilizer value of cattle manure was about five times more expensive than urea and triple superphosphate equivalents. In our study, N in manure sold by lowland farmers to traders was about 3.5 times the cost of N in urea, which destination farmers and rubber companies purchased from traders for 7.5 and 6.5 times the cost of N in urea, respectively. Most farmers in the Colson and Boutonnet (Reference Colson, Boutonnet, Porphyre and Coi2006) study speculated that the high value of manure from a chemical equivalence standpoint reflected farmer perceptions about the role of manure in maintaining soil fertility and crop yields over time. We hypothesize that this is also the case in Vietnam, although it may not be a rational decision for buyers.
Colson and Boutonnet (Reference Colson, Boutonnet, Porphyre and Coi2006) suggested that the high price of organic N in hog manure limited manure value chain development. We did not detect this constraint in south-central and southeast Vietnam. Colson and Boutonnet (Reference Colson, Boutonnet, Porphyre and Coi2006) also observed that cattle manure traders regarded manure trade as a primary source of income and achieved incomes of about US$2.90 day−1, much higher than the reported agricultural daily wage in 2006 (US$1.33 day−1). This is consistent with our study, where trader incomes were higher than agricultural daily wages. Manure trade was a quite lucrative primary source of income, exceeding US$13,000 yr−1 for lowland and highland traders.
Van et al. (Reference Van, Ba, Tung, Smith, Lane and Parsons2014) calculated the economic tradeoff between selling manure or applying it to forages in Bình Định Province. The income generated from sales of 20 Mg manure DM was approximately US$952, while the value of increased forage yield from fertilization with 20 Mg manure DM ha−1 yr−1 was US$962. Calculations assumed 4.76 ¢ kg−1 dry manure (slightly higher than 4.51 ¢ kg−1 in AC to 4.65 ¢ kg−1 in NK calculated in our study) and 23.8 ¢ kg−1 forage DM. Using lowland manure value in our study, income generated from sales of 20 Mg DM manure was estimated at US$902 (transaction price) or US$930 (reported average yearly price). Van et al. (Reference Van, Ba, Tung, Smith, Lane and Parsons2014) suggested lower perceived risk of immediate returns from manure sales as a principal reason to sell. The resulting certainty equivalence was small, between US$10 and 50 yr−1. McRoberts (Reference Lekasi, Tanner, Kimani and Harris2015) did not detect a forage yield response to composted cattle manure treatments if added without additional urea. Combined with low calculated certainty equivalence, this suggests low short-term opportunity cost to manure sales. The economics of tradeoffs in manure use versus sale are influenced by manure and forage value, labor and manure and inorganic fertilizer application rates and prices and the characteristics of decision makers, all of which merit further study to fully evaluate tradeoffs in manure allocation decisions (i.e., sale, application on cash crop or forage soils).
Economic opportunities for origin and destination farmers
Highland farmers can benefit from buying manure when prices are lower, and by buying non-bagged manure at a significantly lower cost than bagged manure. Highest prices were reported early in the year, and prices decreased at the onset of the highland rainy season in June or July. Cash availability often limits manure investment to post-harvest periods for coffee and pepper (early in the year). Similarly, lowland farmers could increase revenue from manure sales by storing manure from June or July onward to dry and sell early in the following year (dry season onset in January to March, when manure prices are highest). The benefits and pitfalls of these strategies require further investigation. Highland farmers may perceive elevated risk to invest during periods of constrained cash flow and uncertainty about future harvest returns. Credit may be required, but current availability and terms of credit systems in the region are not known. Cramb et al. (Reference Cramb, Purcell and Ho2004) reported available formal and informal credit in Đắk Lắk Province, but loan acquisition was often a difficult process with unattractive terms for farmers. Investigation of crop response to manure application over time in lowland and highland regions can shed light on the decision to buy or sell manure versus other alternatives.
Better understanding of appropriate manure and fertilizer application rates could help mitigate over- (or under-) application, thus improving sustainability of agricultural production and possibly raising farmer net incomes. Excessive manure and fertilizer use has been documented in southern Vietnam (Hedlund et al., Reference Hedlund, Witter and Xuan An2003), and this could elevate nutrient losses from runoff, volatilization, leaching and/or denitrification. In regions where manure is overapplied, further development of manure trade systems can help redistribute nutrients from areas with high animal density relative to agricultural land (e.g., Ho Chi Minh City, south-central coastal Vietnam; see Fig. 3). Conversely, regions with negative nutrient balances could benefit by retaining more manure on farms (McRoberts et al., Reference McRoberts, Ketterings, Parsons, Hai, Quan, Ba, Nicholson and Cherney2016). The probability of negative nutrient balances would increase if lowland farmers decide to sell more manure, but additional plot- and farm-level research would be required to assess these risks quantitatively. Consequently, sustainable, environmentally conscious application rates must be established from field experiments and modeling to support these nutrient management decisions.
Chain-level implications and possible value chain evolution
This study generated information about manure value chains in Vietnam that could inform future quantitative analysis of value chain dynamics via simulation modeling (as in Rich et al., Reference Rich, Ross, Baker and Negassa2011). Under current conditions, cattle manure value chains that have developed to support the demand for manure use on higher value crops in highland and southeast coastal regions drive sustained operation and chain participants did not report discontentment with the manure trade system. However, our static analysis does not directly address the dynamics of manure value chains, which can be markedly influenced by changes in pepper, coffee, rubber and dragon fruit acreages. For example, pepper acreages increased by approximately 60% from 2008 to 2012 in Gia Lai and Đắk Lắk, and dragon fruit acreages nearly doubled in Bình Thuận during the same period (Binh Thuan Statistics Office, 2013; Dak Lak Statistics Office, 2013; Gia Lai Statistical Office, 2013), which has increased demand for manure and fomented growth of the manure trade system. Lowland manure availability for fertilizer use and sale can be affected by government regulation of the currently informal manure trade sector (e.g., formal taxation), natural disasters or diseases affecting crop production (demand shock) or animal numbers (supply shock), and further transition from extensive grazing systems to semi-intensive or intensive cattle management systems (Ba et al., Reference Ba, Lane, Parsons, Van, Khanh, Corfield and Tuan2013, Reference Ba, Van, Scandrett, Vy, Tung, Nghi, Tuan, Lane and Parsons2014). The impact of these developments on manure value chains, crop–livestock systems, and actors at various levels should be better understood. Simulation modeling of factors impacting manure trade system resiliency and weaknesses also merits consideration. Finally, assessment of the long-term economic and soil fertility impact of farmer participation in manure trade will indicate if trade is a favorable short- and long-term strategy under dynamic agricultural production conditions.
Similar to cattle manure markets in Africa and Asia that link cattle owners and pastoral regions with crop farmers and crop-production regions (Hoffmann et al., Reference Hoffmann, From and Boerma2014), value chains operating in south-central Vietnam link crop–livestock systems in different regions and support redistribution of organic matter and nutrients in manure from regions with excess to regions experiencing shortfalls. This resulting interconnectedness of agricultural regions aids in the ability to maintain crop production and supports regional agricultural economies. This study supports the viability of manure transfer over distances in Vietnam and elsewhere to effectively redistribute organic matter and nutrients to sustain inter-regional production systems linked by manure trade. Locations in developed countries where manure applications are regulated (high number of cattle relative to cultivated land) due to potential N and P contamination of water sources (e.g., Chesapeake Bay watershed in the USA) could also benefit from development of similar manure trade systems or consideration of other economically viable options to redistribute nutrients in manure.
Detailed descriptive data from this study revealed several key questions for future investigation. First, the organic matter in manure is worth 20–50% more than alternative sources of organic matter. We hypothesize that this can be attributed to farmer perceptions about the ability of manure to maintain soil fertility and improve water holding capacity over time relative to other organic matter alternatives. Future research should evaluate if this is a rational decision for manure buyers. Second, our study suggests that the opportunity cost for lowland farmers to sell manure is low relative to using it as an organic amendment on forages. Opportunity cost of manure use on other cash crops also merits consideration, although we hypothesize similar low short-term opportunity costs. Third, we did not fully evaluate the importance of participation in manure trade versus other income-generating activities for chain participants. This is an important step to understanding the relative importance of manure trade versus income generating alternatives, especially for lowland traders that rely on manure as a primary income source. Fourth, aside from regional estimates of nutrient supply from lowland farms and shortfalls in regions cultivating higher value crops, we did not assess the importance of nutrient flows in manure from the supplying farms to the end users. Future efforts should assess nutrient inflows from cattle manure purchased by end users and nutrients removed from lowland cattle systems relative to other nutrient sources.
Conclusions
The quantitative information generated during our descriptive assessment illustrated the importance of manure trade in crop–livestock systems and demonstrated the broad range of data for effective chain characterization. This information provides a basis for further analyses of key questions such as chain efficiency, sales participation decisions, determinants of prices and returns to labor. Our results provide a basis to implement simulation modeling methods to assess important inter-temporal issues such as tradeoffs in manure use, sustainability of nutrient flows, options for chain upgrading, likely evolution of the chain, and to evaluate the impact of production and environmental shocks.
Supplementary Material
The supplementary material for this article can be found at https://doi.org/10.1017/S1742170517000072
Acknowledgements
This work was partially supported by a Fulbright-Hays Doctoral Dissertation Research Abroad Fellowship and a Cornell University Graduate School Travel Grant. We would like to thank Dr. Nguyễn Hữu Văn at Huế University of Agriculture and Forestry and Hoang Văn Tùng at the Research and Development Centre for Animal Husbandry in the Central Region for assistance in obtaining permission to undertake the study in different regions. We also thank Dr. Laurie Bonney at the University of Tasmania and Dr. J. H. Cherney at Cornell University for preliminary discussions leading to the development of this study. Finally, we are grateful to Tim Gorman at Cornell University for assistance with map construction.