Implications
This study indicated that heat production and energetic nutrients’ release across the portal and splanchnic tissues differed with varying levels of dry matter intake (DMI) of the same forage. In addition, the contribution of propionate, amino acids and lactate to gluconeogenesis differed with DMI. Such quantitative information describing animal biological response to feed intake will contribute to developing models for accurate prediction of nutrient supply from the diet.
Introduction
In many ruminant production systems, the energy value of feeds is still defined by their metabolizable energy (ME) content measured at maintenance levels as an aggregated unit. According to the Agricultural and Food Research Council (AFRC, 1993), it is well known that ME value of feeds vary with the feed intake level, and the utilization efficiency of ME is lower at above-maintenance than at below-maintenance levels. However, the pattern and availability of individual energetic nutrients to the animal are seldom considered. Therefore, describing energy by the amount of energetic nutrients available to the animal may improve dietary formulations for ruminants (Reynolds, Reference Reynolds2000). Thus, recently, net flux of nutrients by the portal-drained viscera (PDV; includes gastrointestinal tract, pancreas, spleen and associated mesenteric fat) has been related to feed characteristics (Loncke et al., Reference Loncke, Nozière, Amblard, Léger, Vernet, Lapierre, Sauvant and Ortigues-Marty2010). The PDV and liver (together called the total splanchnic tissues, TSP) are extremely active metabolically, accounting for as much as up to 50% of whole body O2 consumption (Lindsay and Reynolds, Reference Lindsay and Reynolds2005). The O2 consumption and nutrient net flux across the PDV and TSP have been shown to vary with the feeding level and with the nature of the diet (Huntington, Reference Huntington1990; Ortigues and Durand, Reference Ortigues and Durand1995), and models have been developed to predict their net portal appearance (NPA) from dry matter intake (DMI) and dietary characteristics (Bermingham et al., Reference Bermingham, Nozière, Vernet, Lapierre, Le′ger, Sauvant and Ortigues-Marty2008; Loncke et al., Reference Loncke, Ortigues-Marty, Vernet, Lapierre, Sauvant and Nozière2009). However, to advance the new feed evaluation systems, O2 consumption by the TSP and energy availability to peripheral tissues must be investigated at a wider range of DMI, with special attention to intake levels below maintenance requirements. Therefore, the objective of this study was to assess the impact of DMI ranging from below to above maintenance on the PDV and TSP release of energetic nutrients in mature sheep. We hypothesize that the availability of individual energetic nutrients to peripheral tissues would vary across DMI levels.
Material and methods
Animals and treatments
Four Suffolk mature sheep (61.4 ± 3.6 kg BW, 4.1 ± 1.9 years old) were surgically fitted with chronic indwelling catheters in the hepatic portal vein, hepatic vein, mesenteric vein and caudal aorta. Catheters were prepared and maintained as described by Katz and Bergman (Reference Katz and Bergman1969) and Huntington et al. (Reference Huntington, Reynolds and Stroud1989). The experiment was approved by Hiroshima University Animal Research Committee (No. D08-21). Sheep were allowed 4 weeks to recover from surgery while they were adapted to lucerne hay cubes. After recovery, sheep were kept in metabolic crates, randomly allocated to a 4 × 4 Latin square design and fed by automatic feeder (12 × 2-h intervals) four equally spaced levels of lucerne hay cubes [8.82 MJ ME/kg of dry matter (DM), 19.0% CP and 40.6% NDF], ranging from 0.4- to 1.6-fold the ME requirements for maintenance (AFRC, 1993). The diets also supplied 0.75, 1.43, 2.11 and 2.88 of metabolizable protein (MP) for maintenance (AFRC, 1993). Each period lasted 12 days: 7 days for diet adaptation and 5 days for digestibility and nutrient net flux determinations.
Sample collection and analyses
Digestibility
The samples of lucerne hay cubes and total feces were collected during a 5-day digestion trial and were analyzed for DM, organic matter (OM), nitrogen (N) and NDF according to the Association of Official Analytical Chemists (AOAC, 1990).
Nutrient net flux
Blood flow across the splanchnic tissue bed was determined by downstream dilution using p-amino-hippuric acid (PAH; 4%, wt/vol; pH 7.4; Katz and Bergman, Reference Katz and Bergman1969) infused continuously (0.6 ml/min) through a sterile 45-μm filter into the mesenteric vein catheter following a prime injection (15 ml). PAH infusion began 1 h before blood sampling. Six sets of heparinized blood samples (10 ml) were simultaneously taken at 30-min intervals from the arterial and venous catheters on the last day of the 5-day digestion trial. Immediately after sampling, hematocrit was determined by centrifugation of blood in capillary tubes. The pO2 and pH of blood were determined within 30 min of sampling using a blood gas analyzer (Bayer 248, Japan). A portion of whole blood was deproteinized for ammonia-N determination by the phenol–hypochlorite method (Okuda et al., Reference Okuda, Fujii and Kawashima1965). Plasma was obtained from remaining whole blood by centrifugation at 2360 × g (15 min at 4°C). Plasma samples were assayed for urea-N by the diacetyl monoxime–antipyrine method (Ceriotti, Reference Ceriotti1971) and PAH using standards prepared from infusion solutions without the deacetylation step (Harvey and Brothers, Reference Harvey and Brothers1962) even if the incomplete recovery of PAH across the liver quantitatively has impacts on some hepatic nutrient fluxes (Kristensen et al., Reference Kristensen, Røjen, Raun, Storm, Puggaard and Larsen2009). Plasma concentrations of β-hydroxybutyric acid (BHBA; ketone test B, Sanwa Chemical Institute Co. Ltd, Nagoya, Japan), non-esterified fatty acids (NEFA; NEFA-C test; Wako Co., Ltd, Tokyo, Japan), lactic acid (lactate dehydrogenase reaction using UV/VIS spectrophotometer, V-530, JASCO Co., Tokyo, Japan), and glucose using glucose analyzer (GA-1151, Arkray Co. Ltd, Kyoto, Japan) were determined. Volatile fatty acids (VFA) were determined in plasma according to Murase et al. (Reference Murase, Kimura and Nagata1995) using gas chromatography (GC-17A, Shimadzu). For VFA extraction, plasma samples with internal standard (crotonic acid and methacrylic acid) were deproteinized with 10% (W/W) sulfosalicylic acid and then extracted with diethyl ether. The VFA in the ether phase was concentrated by adding NaOH solution. Immediately before injection to GC, the concentrated extract was acidified with phosphoric acid. The recovery rates were 0.84, 1.17 and 1.27 for acetate, propionate and butyrate, respectively. Plasma-free amino acids (AA) concentrations were determined in samples bulked for each sampling period by ion-exchange chromatography after deproteinization of plasma with an equal volume of sulfosalicylic acid (3%, wt/vol), with ninhydrin as the colorimetric reagent (Hamilton, Reference Hamilton1963) using an Amino Acid Analyzer (JLC-500, JEOL, Tokyo, Japan).
Calculations
ME intake (MEI) was estimated using the equation: MEI (MJ/kg) = 0.0157 × digestible OM intake (DOMI, g/kg DM; AFRC, 1993). Blood (or plasma) flow (l/h) and nutrient net fluxes (mmol/h) across the portal vein, hepatic artery and hepatic vein were calculated as described by Katz and Bergman (Reference Katz and Bergman1969). Plasma flow (l/h) was calculated by dividing PAH infusion rate (mg/h) by PAH venous–arterial concentration difference (mg/l). Plasma flow was divided by 1- (0.01 × Hematocrit) to calculate blood flow. Venous–arterial concentration differences were multiplied by blood (or plasma) flows to calculate nutrient net fluxes across the PDV and TSP. Nutrient net fluxes across the liver were calculated as the differences between TSP and PDV fluxes. A positive net flux indicates a net release, whereas a negative net flux indicates a net uptake.
Gluconeogenesis potentially coming from propionate, AA and lactate was calculated on the basis of dividing net hepatic uptake of carbons from propionate, AA and lactate by the net hepatic release of carbons from glucose, respectively.
Whole-blood O2 concentration was calculated using the following equation: O2 (mM) = Hgb × 1.34 × % O2 × (1/22.4), where Hgb is blood hemoglobin (g/l), 1.34 is ml of O2/g of hemoglobin, % O2 is the O2 saturation percentage and 22.4 is O2 volume at standard temperature and pressure (ml of O2/mmol of O2) (Huntington and Tyrrell, Reference Huntington and Tyrrell1985). The O2 consumption by the PDV and TSP was calculated as the product of blood flow through PDV and TSP times portal–arterial and hepatic–arterial differences in O2 concentration, respectively. The O2 extraction ratio was calculated as (AO2 – VO2)/AO2, where AO2 and VO2 are arterial and venous O2 concentrations, respectively (Jones et al., Reference Jones, Longworth, Lindholm, Conley, Karas, Kayar and Taylor1989). Heat production was calculated assuming 4.89 kcal/l of O2 consumed (Huntington and Tyrrell, Reference Huntington and Tyrrell1985).
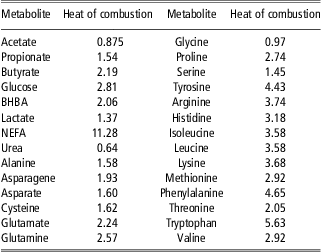
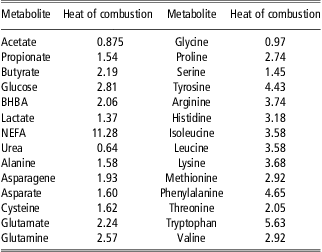
Net splanchnic energy flux regarding the estimated MP intake was calculated using heats of combustion (MJ/mol) of metabolites shown in Table 1. Negative value of net flux for each energy substrate including each AA was regarded as zero for the energy summation. Net fluxes of individual AA are detailed in the companion paper (EL-Sabagh et al., 2013).
Heats of combustion (MJ/mol) of metabolites used in calculating net energy fluxes
Statistical analysis
One sheep lost hepatic catheter patency. Therefore, balanced data (n = 3) were reported for hematocrit, blood flows and nutrient net fluxes across the PDV, liver and TSP. Conversely, all available data were reported for intake, digestion, arterial concentrations, energy release and regression analyses. Data were analyzed using the GLM procedure of SAS (SAS, 2000), with treatment, period and sheep as main factors. Treatment means were compared with orthogonal contrasts. Differences were considered significant when P < 0.05 and tendencies are discussed when P < 0.1.
Results
Digestibility
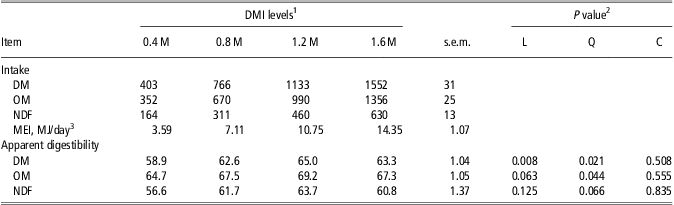
Apparent total tract digestibility increased linearly and quadratically for DM (P < 0.05), increased quadratically (P < 0.05) with a linear tendency (P < 0.1) for OM and tended to increase quadratically for NDF (P < 0.1), with increasing DMI (Table 2).
Nutrient intake (g/day) and digestibility (%) in mature sheep fed lucerne hay cubes at four levels of DMI (n = 4)
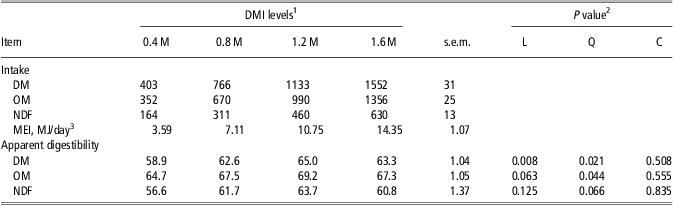
DMI = dry matter intake; s.e.m. = standard error of means; DM = dry matter; OM = organic matter; MEI = metabolizable energy intake.
1Multiple of MEm requirement (AFRC, 1993).
2L = linear effect; Q = quadratic effect; C = cubic effect.
3MEI was estimated by 0.0157 times digestible OM intake (AFRC, 1993).
Blood flow and nutrient concentrations
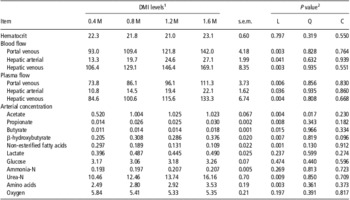
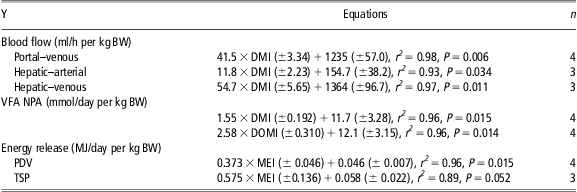
Blood flow and nutrient concentrations are presented in Table 3. Hematocrit was not influenced by variation in DMI (P > 0.1), whereas blood and plasma flows across the portal vein, hepatic artery and hepatic vein increased linearly (P < 0.05) with increasing DMI. The hepatic arterial/venous blood flow was not significantly related to increases in DMI and amounted on average to 15.1%. In this study, regression analysis revealed a linear relationship between DMI (g/d per kg BW) and blood flows (ml/h per kg BW) across the portal vein, hepatic artery and hepatic vein (Table 4).
Hematocrit (%, n = 3), splanchnic blood and plasma flows (l/h, n = 3) and blood metabolite concentrations (mM, n = 4) in mature sheep fed lucerne hay cubes at four levels of DMI

DMI = dry matter intake; s.e.m. = standard error of means.
1Multiple of MEm requirement (AFRC, 1993).
2L = linear effect; Q = quadratic effect; C = cubic effect.
Prediction equations of blood flow, NPA of VFA and energy release by the PDV and TSP in response to intake
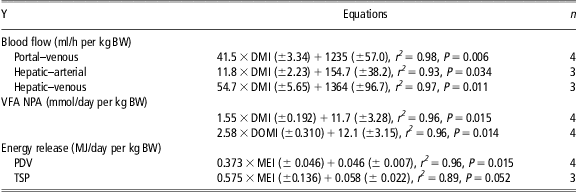
NPA = net portal appearance; VFA = volatile fatty acids; PDV = portal-drained viscera; TSP = total splanchnic tissues; DMI = dry matter intake (g/day per kg BW); DOMI = digestible organic matter intake (g/day per kg BW); MEI = metabolizable energy intake (MJ/day per kg BW).
Arterial concentration of acetate, propionate, butyrate and BHBA increased linearly (P < 0.05), whereas that of NEFA decreased linearly (P < 0.01), and that of lactate, glucose and O2 did not change (P > 0.1) with increasing DMI.
Nutrient net flux
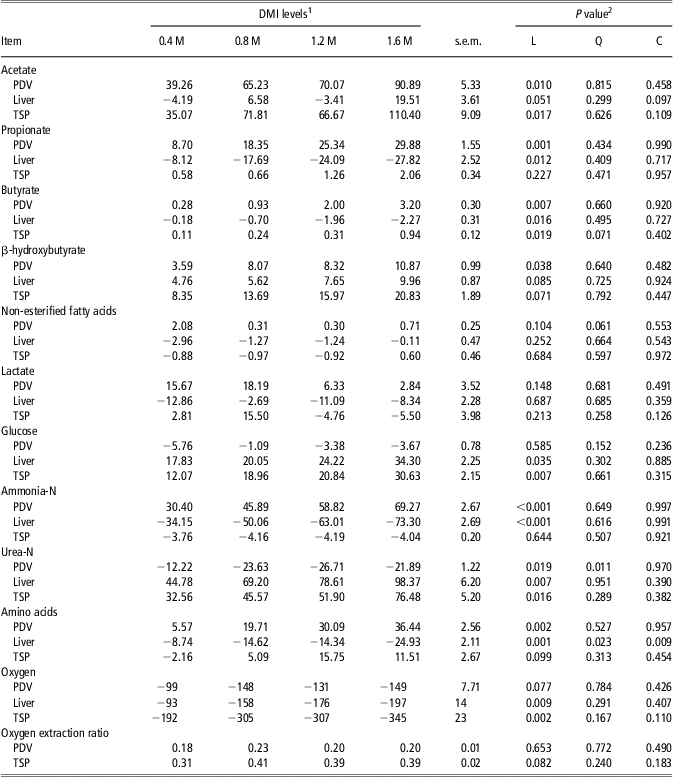
Net portal, hepatic and total splanchnic fluxes of nutrients are presented in Table 5. The NPA of acetate, propionate, butyrate and BHBA was relatively low at 0.4 M and then increased linearly (P < 0.05) with increasing DMI, whereas that of NEFA showed a quadratic (P < 0.1) decrease from 0.4 to 1.2 M and then increased at 1.6 M; however, no changes were observed in NPA of lactate and glucose. The PDV O2 uptake tended to increase linearly (P < 0.1) with increasing DMI, whereas the PDV O2 extraction ratio was similar among treatments. Regression analysis revealed a linear relationship (P < 0.05) between NPA of total VFA (mmol/day per kg BW) and both of DMI and DOMI (g/day per kg BW). The linear slopes indicated that 1 g/day per kg BW increase in DMI or DOMI induced an increase in total VFA NPA of 1.55 (±0.192) and 2.58 (±0.310) mmol/day per kg BW, respectively (Table 4). The respective proportions of each VFA appearing in the portal blood expressed as a proportion of total NPA of VFA were different (P < 0.05) among treatments representing 81%, 78%, 73% and 74% for acetate; 18%, 21%, 25% and 24% for propionate and 0.7%, 1.2%, 1.9% and 2.5% for butyrate, respectively.
Net portal, hepatic and total splanchnic flux (mmol/h) of nutrients in mature sheep fed lucerne hay cubes at four levels of DMI (n = 3)
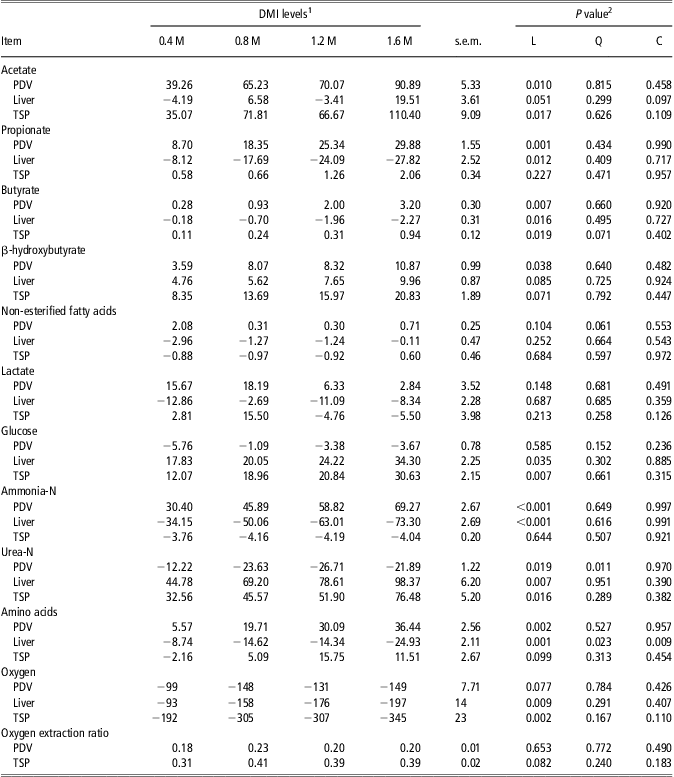
DMI = dry matter intake; s.e.m. = standard error of means; PDV = portal-drained viscera; TSP = total splanchnic tissues.
1Multiple of MEm requirement (AFRC, 1993).
2L = linear effect; Q = quadratic effect; C = cubic effect.
A net removal by the liver was observed for acetate at 0.4 and 1.2 M, whereas a net release was observed at 0.8 and 1.6 M, respectively. Increasing DMI induced linear increases in hepatic uptake of propionate, butyrate and O2 (P < 0.01); linear increases in hepatic release of BHBA (P < 0.1) and glucose (P < 0.05) with no changes in hepatic uptake of NEFA and lactate (P > 0.1).
Increasing DMI linearly increased splanchnic release of acetate, butyrate and glucose (P < 0.1), quatratically increased that of butyrate (P < 0.1) and tended to linearly increase that of BHBA (P < 0.1), with no changes in net splanchnic flux of NEFA and lactate. The TSP uptake of O2 increased linearly (P < 0.01), whereas TSP O2 extraction ratio tended to increase linearly (P < 0.1) with increasing DMI.
Energy metabolism
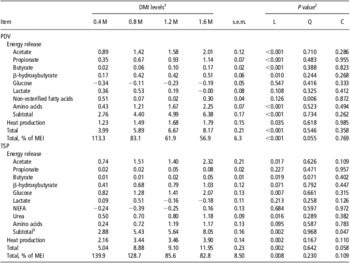
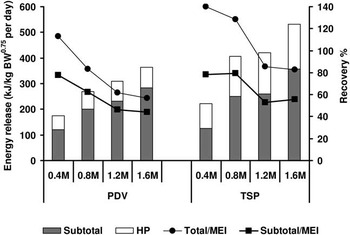
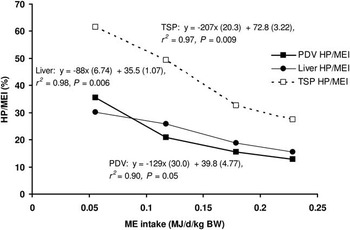
Energy release and heat production by the PDV and TSP are summarized in Table 6. The net portal release of energy (n = 4) as acetate, propionate, butyrate, BHBA, AA and heat production by the PDV estimated from O2 use increased linearly (P < 0.01) with increasing DMI. However, energy release as lactate tended to increase linearly (P = 0.11) with the increase between 0.4 and 0.8 M and then decreased at 1.2 M. In addition, the energy released as NEFA decreased quadratically (P < 0.01) from 0.4 to 1.2 M, and then increased again at 1.6 M diet. The summation of energy supplied by NPA of nutrients (acetate, propionate, butyrate, BHBA, lactate, NEFA and AA) increased linearly (P < 0.01) with increasing DMI. However, relative to MEI, this summation decreased linearly (P < 0.05) with increasing intake accounting for 78%, 62%, 46% and 44% of MEI at 0.4, 0.8, 1.2 and 1.6 M, respectively (Figure 1). Heat production by the PDV tissues as a percentage of MEI increased linearly (P < 0.05) in response to underfeeding accounting for 13%, 16%, 21% and 37% of MEI at 1.6, 1.2, 0.8 and 0.4 M, respectively (Figure 2). Total PDV energy release (energy supplied by nutrients release and heat production) increased linearly (P < 0.05) with increasing DMI. Total PDV energy release (MJ/day per kg BW) was linearly linked to MEI (MJ/day per kg BW; Table 4). As % of MEI, however, the total PDV energy recovery decreased linearly (P < 0.05) and quadratically (P < 0.1) with increasing DMI (Figure 1).
Daily net energy release and heat production (MJ/day) across the PDV (n = 4) and TSP (n = 3) in mature sheep fed lucerne hay cubes at four levels of DMIFootnote #

PDV = portal-drained viscera; TSP = total splanchnic tissues; DMI = dry matter intake; s.e.m. = standard error of means; MEI = metabolizable energy intake.
1 Multiple of MEm requirement (AFRC, 1993).
2 L = linear effect; Q = quadratic effect; C = cubic effect.
3 Subtotal = total minus heat production.
# Only energy nutrients with a positive net flux are considered in calculation.
Energy summation and recovery ratio of MEI by PDV and TSP of mature sheep fed lucerne hay cubes at four levels of dry matter intake (MEI = metabolizable energy intake; PDV = portal-drained viscera; TSP = total splanchnic tissues; HP = heat production; subtotal = total-HP; 0.4, 0.8, 1.2 and 1.6 M = 0.4, 0.8, 1.2 and 1.6 times the maintenance energy requirements, respectively).

Relations between heat production and MEI across the PDV, liver and TSP of mature sheep fed lucerne hay cubes at four levels of dry matter intake (MEI = metabolizable energy intake; PDV = portal-drained viscera; TSP = total splanchnic tissues; HP = heat production).

Across the TSP, energy release as acetate, butyrate, glucose and urea increased linearly (P < 0.05), while energy release as BHBA and AA tended to increase linearly (P < 0.1) with increasing DMI. However, the energy released as NEFA was considered as zero, except at 1.6 M, because of negative net flux at other treatments. Similarly, energy released as lactate was considered only at 0.4 and 0.8 M diets because of negative net flux at 1.2 and 1.6 M diets, respectively. The summation of energy supplied by nutrients release across the TSP (acetate, propionate, butyrate, BHBA, glucose, lactate, NEFA, urea and AA) increased linearly (P < 0.05) with increased DMI. Relative to MEI, however, this summation decreased linearly (P < 0.05) with increasing intake accounting for 78%, 79%, 53% and 55% of MEI at 0.4, 0.8, 1.2 and 1.6 M, respectively (Figure 1). Heat production by the TSP as a percentage of MEI increased linearly (P < 0.05) in response to underfeeding accounting for 27%, 33%, 49%, and 62% of MEI at 1.6, 1.2, 0.8 and 0.4 M, respectively (Figure 2). Total energy release across the TSP (energy supplied by nutrients release and heat production) increased linearly (P < 0.01) with increasing DMI. There was a linear relationship between MEI (MJ/day per kg BW) and total energy release across the TSP (MJ/day per kg BW; Table 4). As a % of MEI, however, total TSP energy recovered decreased linearly (P < 0.05) with increasing DMI (Figure 1).
Discussion
Digestibility
The tendency toward decreased forage digestibility at 1.6 M is likely a reflection of increases in ruminal passage rate that occurred when intake increased (Galyean and Owens, Reference Galyean and Owens1991). The drop in digestion at 0.4 M may relate to lower available energy for microbes (Doreau et al., Reference Doreau, Michalet-Doreau, Grimaud, Atti and Nozière2003) and lower water intake.
Nutrient net flux
In this study, increasing DMI resulted in a linear increase in the NPA of VFA. This increase may be because of increased VFA production rate owing to increased MEI and digested OM. Alternatively, the increase in ruminal passage rate that occurred when intake increased may be counterbalanced for by an increase in postruminal production and absorption of VFA (Merchen et al., Reference Merchen, Firkins and Berger1986; Goetsch, Reference Goetsch1998). However, pattern of changes in NPA of VFA did not follow the same pattern of changes in DMI. Furthermore, the profile of VFA released by the PDV was different (P < 0.05) among treatments. These variations in the NPA of VFA with changes in DMI may relate to the extent of ruminal fermentation and PDV tissue metabolism of energy substrates (Bermingham et al., Reference Bermingham, Nozière, Vernet, Lapierre, Le′ger, Sauvant and Ortigues-Marty2008; Loncke et al., Reference Loncke, Ortigues-Marty, Vernet, Lapierre, Sauvant and Nozière2009).
Increasing DMI induced linear increases in NPA of BHBA. NPA of BHBA results from both ruminal ketogenesis from butyrate and from PDV uptake of arterial BHBA (Loncke et al., Reference Loncke, Ortigues-Marty, Vernet, Lapierre, Sauvant and Nozière2009). In our study, the BHBA: butyrate NPA decreased linearly (P < 0.05) with increasing DMI, suggesting that ketogenesis from butyrate in the rumen wall was limited at higher DMI, probably partly because of increased ruminal butyrate production with increasing DMI. Alternatively, increased BHBA NPA may be because of decreased uptake of arterial BHBA by PDV as a result of ketogenesis from acetic acid or NEFA carbon skeleton in the liver (Majdoub et al., Reference Majdoub, Vermorel and Ortigues-Marty2003). The NPA of NEFA showed a curvilinear decrease from 0.4 to 1.2 M and then increased at 1.6 M. The increased NPA of NEFA at 0.4 M may reflect lypolysis of visceral and peripheral adipose tissues that is classically observed in underfed state (Chilliard et al., Reference Chilliard, Bocquier and Doreau1998), whereas the increase at 1.6 M may indicate increased lipogenesis at overfed state. Interestingly, the NPA of BHBA and NEFA was relatively constant between 0.8 and 1.2 M and did not follow changes in DMI. Moreover, the butyrate and NEFA are converted into BHBA in the liver but the contribution rates may differ between both substrates. That is, hepatic uptake of NEFA was 26 times higher at 0.4 than 1.6 M, whereas hepatic uptake of butyrate was 13 times higher at 1.6 than 0.4 M. This variation is probably mediated by changes in BW and metabolism from below to above maintenance. The BW decreased at below-maintenance and increased at above-maintenance levels of DMI accounting for −4.7, −0.6, 2.2 and 3.6 kg during the experimental period at 0.4, 0.8, 1.2 and 1.6 M, respectively.
Net hepatic glucose production was increased at elevated intakes probably because of higher availability and uptake of glucogenic precursors such as propionate, lactate and AA. However, respective potential contribution of these precursors to gluconeogenesis varied with DMI representing 23%, 44%, 46% and 33% for propionate (P < 0.05, quadratic response); 36%, 11%, 21% and 10% for lactate (P > 0.1) and 30%, 42%, 34%, 36% for AA (P < 0.05, cubic response) at 0.4, 0.8, 1.2 and 1.6 M, respectively. Despite the calculated contributions of gluconeogenic substrates being independent of each other, the lower propionate contribution at 0.4 M may indicate low availability of propionate with greater spare from lactate and AA, whereas the higher contribution of AA at 0.8 M may be because of the lowest contribution from lactate. It has been suggested that gluconeogenesis from propionate is markedly depressed in underfed ruminants owing to a decrease in propionyl-CoA carboxylase activity (Baird and Young, Reference Baird and Young1975). Total potential contribution from propionate, lactate and AA to gluconeogenesis averaged 88%, 94%, 100% and 80% at 0.4, 0.8, 1.2 and 1.6 M, respectively. The contribution to glucose from glycerol and pyruvic acid was not measured in this study, but their contribution to gluconeogenesis can not be dismissed particularly in underfeeding conditions (Bergman et al., Reference Bergman, Starr and Ruelins1968). In addition, transamination among individual AA and its contribution to gluconeogenesis was not considered in calculation.
Increasing DMI induced linear increases in O2 uptake by the PDV, liver and TSP. The TSP O2 extraction at 0.4 M was 9% lower than other treatments indicating a decrease in the metabolic rate of the PDV and liver at lower energy intake. Previous studies showed that O2 consumption by the PDV and liver is related to metabolic activity (e.g. ureagenesis, gluconeogenesis, protein turnover) and tissue mass as well as blood flow, which are varied with level of intake (Kelly et al., Reference Kelly, Southorn, Kelly, Milligan and McBride1993).
On the basis of these data, the nature and amount of absorbed energy substrates may vary with different levels of DMI. Therefore, it may be necessary for current feed evaluation systems to consider the demand for specific energetic nutrients in ration formulation.
Energy metabolism
In this study, MEI actually recovered by the PDV and TSP decreased with increasing DMI with recovery ranges from 113% to 57% for PDV and from 140% to 83% for TSP, respectively. The relative increase of energy recovered by the PDV and TSP at levels below maintenance corresponds mainly to relative higher heat production by these tissues and energy release by extrasplanchnic tissues to maintain the metabolic activity of splanchnic tissues. This is consistent with the findings of Chilliard et al. (Reference Chilliard, Bocquier and Doreau1998) who reported that the amount of total energy released by the splanchnic tissues exceeded MEI at intake levels below maintenance, probably because of mobilizing NEFA and AA or because of less energy used for maintenance and turnover as a result of BW loss and reduction in organ size (McLeod and Baldwin, Reference McLeod and Baldwin2000). However, the lower than 100% recovery of energy at levels above maintenance may be because of loss of heat of fermentation or energy retained in the PDV and liver as a result of BW gain. In addition, maintenance energy expenditure and metabolic activity of the gut increase with increasing intake of forages (Gill et al., Reference Gill, France, Summers, McBride and Milligan1989) because of increased gut tissue mass from fibrous feeds (McLeod and Baldwin, Reference McLeod and Baldwin2000). However, technical limits in the estimation of blood flow and arterial–venous differences or lack of data for unmeasured energy substrates such as nucleic acids and peptides cannot be excluded (Lindsay, Reference Lindsay1993).
Overall, the considerable variations in splanchnic net flux of energetic nutrients observed with changes in DMI of the same forage reflect the effects of digestive interactions and modulations of TSP metabolism on nutrient net availability to postabsorptive tissues, and emphasize the importance of considering the pattern and availability of individual energy nutrients when defining the energy value of diets.
Conclusions
The results of this study demonstrated that the respective contributions of intermediary metabolites to energy release by the PDV and TSP vary with the level of DMI. Despite the fact that the diet composition was constant and sheep were fed four equally spaced levels of dietary intake, the PDV and TSP net fluxes of energy-yielding nutrients did not follow the same pattern of difference in DMI. As % of MEI, energy release by the PDV and TSP decreased linearly with increasing DMI. The most significant change in heat production and energy release was from 0.4 to 0.8 M for PDV and from 0.8 to 1.2 M for TSP. This study provides additional information on the partitioning of energy substrates net fluxes among the splanchnic tissues of forage-fed ruminants. This contributes to development of new rationing tools for ruminants on the basis of nutrient net fluxes.
Acknowledgment
This study was carried out as a part of the research project (Technical Development of Livestock Production System Based on Domestic Feed) supported by MAFF, Japan.