

INTRODUCTION
Religion has an enormous effect on individuals' political opinions and actions.Footnote 1 Whether religion is private or public, individual or group-oriented, inward- or outward-focused, religious beliefs profoundly affect political behavior. Scholars have long noted the political differences between religious traditions, and accounting for individuals' religious affiliations is an important part of understanding and predicting political choices (Smidt, Kellstedt, and Guth Reference Smidt, Kellstedt, Guth, Smidt, Kellstedt and Guth2009). Research has also shown a clear divide in political attitudes between those with high religious commitment and those with less/no religion, with religious devotion leading to greater identification with the Republican Party, and lack of religious conviction leading to greater identification with the Democratic Party (Layman Reference Layman1997; Reference Layman2001; Kaufmann Reference Kaufmann2004; Kohut et al. Reference Kohut, Green, Keeter and Toth2000; Green et al. Reference Green, Guth, Kellstedt and Smidt1996; Fiorina, Abrams, and Pope Reference Fiorina, Abrams and Pope2010). Thus, religion — or the lack thereof — has profound political consequences worth careful examination.
In contrast, the related concept of secularism has received less nuanced treatment. A common — if implicit — assumption of many analyses of secularism and secularization is that secularism represents an absence of religious influences and tendencies. In other words, secularism is often viewed as merely a lack of religiosity. Along these lines, a growing literature has sprung up to describe the beliefs, demographic trends, and political orientations of so-called “religious nones” — especially as the number of such identifiers has grown significantly over the past few decades (Putnam and Campbell Reference Putnam and Campbell2010; Baker and Smith Reference Baker and Smith2009; Lim, MacGregor, and Putnam Reference Lim, MacGregor and Putnam2010; Hout and Fischer Reference Hout and Fischer2002). Despite the voluminous literature on secularization trends in the United States and around the world, scholars of religion and politics have rarely examined secularism in the detail that has been accorded to religion. But since the term “secularism” has a profound religious connection, it is necessary to carefully define and examine secularism in order to understand the power of religion in politics. This examination, however, must flow from a realistic and workable description of what it means to be secular, and providing such a description is a primary purpose of this article. Although secularism is often viewed as “the other side of the religious coin,” this “binary” approach is actually logically inconsistent with much of the recent learning regarding the nature and measurement of religiosity. Numerous scholars, following Guth et al. (Reference Guth, Green, Schmidt, Kellstedt and Poloma1997), have persuasively argued that religiousness is not a single factor, but is in fact comprised of several related, but distinct categories. Many recent analyses have fruitfully applied precisely this sort of taxonomy. Given this, it is clearly an over-simplification to regard secularism merely as the absence of religion. Going farther, it is quite plausible that secularism may be, in fact, an independent social category, containing multiple dimensions, which cannot be effectively described solely or even primarily with respect to religious behavior.
This article has several aims. First, we will argue that secularism is not the absence of religiosity: people can be both secular and religious in some important respects. We begin with an account of the analysis of religiosity by social scientists, and next we briefly analyze the history of the notion(s) of secularism, identifying alternative meanings from contemporary religious, and non-religious perspectives. We conclude that while secularism is intricately related to religiousness, it is not merely a state of weak religious attachment. Second, using a data set of nearly 21,000 observations from the United States Religious Landscape Survey (Pew Forum 2008), we explore empirically the relevant meanings of secularism through the use of factor analysis, and we confirm that secularism is a multi-dimensional social impulse. Third, we investigate the role of secularism in political attachment and political behavior, particularly party affiliation and ideology. Utilizing our empirically derived definitions — culminating in two variables, Religious Secularism and Social Secularism — we explore the impact of secularism in its two identified components on political party identity and on political ideology. Finally, our results allow us to assess the implications of secularism for the growth and evolution of political parties in the United States.
THE NATURES AND MEANINGS OF “RELIGIOSITY” AND “SECULARISM”
Is secularism a “turning away from religious belief?” Is it a “worldly, rather than a spiritual attitude?” Is it skepticism or indifference to things religious or to membership in any particular religious organization? Is a secular person simply one who is not a “religious” person? Can one be a spiritual or religious believer (say, in Christ) and be counted as secular if the individual “self-spiritualizes” and belongs to no organized church? Is someone such as Thomas Jefferson, who believed in a sharp separation between organized churches and the state, a secularist? Is it possible for one who supports abortion rights, same-sex marriage, and the teaching of evolution in public education to be labeled or self-label as a Christian, i.e., a religious person? The rising number of individuals who answer “none” when asked for religious affiliation includes a sizeable number who also self-identify as “Christian.” Are they then to be identified as secularist?
In light of such questions, it is not surprising that secularism has been inconsistently defined and applied in social and political discourse. Hansen (Reference Hansen2011) argues that a “movement” and “counter-movement” process initiated by the Religious Right under Ronald Reagan has been countered to some extent by a Secular are pushback. “Seculars” defined as atheists, agnostics, those with no religious affiliation, and those who never attend religious services and who claim that religion is not a major part of their lives (Hansen Reference Hansen2011, 8). In this analysis, secularism is seen as the inverse of religiosity with critical implications for the “culture wars.”Footnote 2 We will argue that “secularism” may be given sharper distinctions and definitions. The concept of political and religious secularism is as old as Greek and Roman philosophy and reaches back to the Enlightenment in its more modern incarnations. British thinker George Holyoake (1817–1906) invoked the term in the mid-19th century to promote the idea that society, its functioning and its government, should be based upon the principles of science and reason, completely eschewing the supernatural. In his Origin and Nature of Secularism, Holyoake (Reference Holyoake1896) did not attack Christianity; he merely argued that human society in all respects should not be based upon supernatural and non-scientific principles (Grugel 2007). Secularism, for Holyoake, was not a negation of Christianity; it was independent of it. Reason and science are simply a means of arriving at secular “truth,” whereas Christian or religious principles were founded on theological premises and faith, without definition in a scientific sense. In contrast, Bradlaugh (1833–1891), an ardent atheist and also a Member of Parliament in Britain, brought an anti-religious element to secularism (Bonner and Robertson Reference Bonner and Robertson2009). Bradlaugh saw church establishment as a threat to freedom of all kinds and, most especially, perceived great danger in the influence that the Roman Catholic Church held over certain European governments.
The struggle to formulate a definition of secularism continues to this day. Some modern historians (e.g., Sommerville Reference Sommerville1998, 249) readily distinguish between secularism applicable, “to a society, a population, an institution, an activity, or a mentality.” One can easily imagine individuals, for example, who strongly support the separation of church and state, but who are also religious or spiritual in some sense, and would roundly reject any “secularist” designation. Yet, some sociologists decry the bifurcation of “religious versus secular attitudes,” suggesting that there is no unvarying relationship between religiosity and secular attitudes because social attitudes determine belief systems. These issues, and the conceptual ambiguity pertaining to secularism, are discussed in many studies (e.g., Moreno-Riano, Smith, and Mach Reference Moreno-Riano, Smith and Mach2006), particularly so in studies relating to growth, modernization, and values-related behavior in an international context (Inglehart and Baker Reference Inglehart and Baker2000; Georgellis and Lange Reference Georgellis and Lange2011; Li and Bond Reference Li and Bond2010). A dichotomy of religious versus political secularism is in many ways attractive, but the untying of the two concepts appears, as a theoretical matter, difficult. The question is evidently an empirical one, and that is the approach we take here.
Given the nexus — whether weak or strong — between religion and secularism, the formulation of a workable concept of secularism, and discernment of its role in political choices and outcomes, can benefit from a review of the literature on religiosity and politics. This literature suggests that religiosity, and its influences, are multi-dimensional in nature. Scholars have traditionally examined religion and its role in politics in terms of three broad categories: beliefs, behaviors, and belonging. First, much research suggests that religious beliefs are strongly connected to political beliefs, providing individuals with rationales for supporting various parties and positions (Barker and Carman Reference Barker and Carman2000; Jelen Reference Jelen1991; Layman Reference Layman2001). Second, religious behavior provides a mechanism to link belief and belonging to political activity (Wald, Owen, and Hill Reference Wald, Owen and Hill1988; 1990; Layman Reference Layman1997; Verba, Schlozman, and Brady Reference Verba, Schlozman and Brady1995), perhaps because individuals “pick up political cues from clergy and fellow (parishioners).” Third, research suggests that belonging to specific religious traditions explains much of individuals' political orientations, as group membership provides a particular worldview, exposes individuals to elite religious voices (i.e., clergy, and generates social networks) (Fowler et al. Reference Fowler, Hertzke, Olson and den Dulk2010; Kellstedt and Green Reference Kellstedt, Green, Leege and Kellstedt1993; Kellstedt et al. Reference Kellstedt, Green, Guth, Smidt, Green, Guth, Smidt and Kellstedt1996; Beyerlein and Chaves Reference Beyerlein and Chaves2003; Guth et al. Reference Guth, Green, Schmidt, Kellstedt and Poloma1997; Layman Reference Layman2001; Djupe and Gilbert Reference Djupe and Gilbert2009). Proposed mechanisms of influence include the “ethnoreligious” perspective, which emphasizes the group-centric nature of religion (Layman Reference Layman2001; Smidt, Kellstedt, and Guth Reference Smidt, Kellstedt, Guth, Smidt, Kellstedt and Guth2009), and the “culture wars” perspective, which argues that secular Americans generally have come to share each other's political attitudes and partisan attachments, just as individuals with orthodox (or traditionalistic) religious beliefs now see each other as political allies, despite their often totally incompatible religious doctrines (Layman Reference Layman2001; Wuthnow Reference Wuthnow1988; Hunter Reference Hunter1991). Such perspectives have naturally been criticized for ignoring significant variation among those who consider themselves religious, leading some to call for a hybrid approach (Smidt, Kellstedt, and Guth Reference Smidt, Kellstedt, Guth, Smidt, Kellstedt and Guth2009). What we learn from the literature is that religion is indeed a complex human behavior, and that religion should be viewed in its constituent parts, if the goal is to better understand religion's political significance. We seek to incorporate these lessons into our analysis of secularism and its role in politics.
A useful approach is provided by the philosopher and ethicist Taylor (Reference Taylor1989). Taylor, in a concise summary of a long intellectual history, identifies secularism as having two different meanings: (1) diminution in religious practice and beliefs and (2) reductions in religion in the political and public environments. Based on Taylor and motivated in part by the sorts of data available on the topic, we believe secularism, in a loose sense, may be fruitfully regarded as of (at least) three types — religious or “theological,” political, and social. Religious or theological secularism concerns religious concepts such as the belief in God or an afterlife, or religious activity such as prayer. Political Secularism, in contrast, concerns the proper role of religious beliefs in political life, and includes ideas such as the separation of church and state or the legislation of morality. Moral Secularism involves beliefs about such ethical issues as homosexuality and abortion. Of course, the dividing lines among these forms of secularism may be quite murky. Certainly, these types are often mixed in both scientific discourse and in popular parlance.Footnote 3 Thus, the intended meaning of secularism is often flexible, hinging critically upon the particular context. As we detail in the following sections, it is possible to use empirical methods to evaluate the reasonableness of our definition of secularism, and to determine how secularism, in its potentially many forms, influences political choices and outcomes.
RELIGIOUS CHOICE AND SECULARISM: EMPIRICAL EXPLORATIONS
We utilize a well-recognized (and large) United States data set to identify, and distinguish between, types of secularism, and then examine their impacts on political affiliation and the intensity of political convictions. This task is necessary given the ambiguity in uses of the word “secularism” as discussed above. Is secularism religious, political or social in nature, and how does one differentiate between and within the concepts? We hypothesize that secularism has potentially three latent factors — which we label religious, political, and moral secularism — and we test this hypothesis with exploratory factor analysis.Footnote 4 Once these latent factors are disentangled, we evaluate the influence of secularism, in its varied forms, on political party affiliation and political ideology.
Data
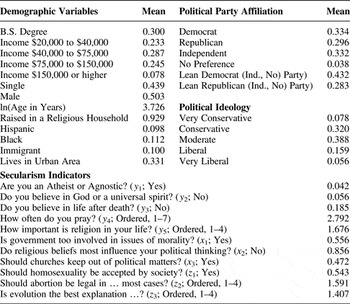
Data available to this study includes the comprehensive survey on religious beliefs and practices collected by the Pew Forum on Religion & Public Life.Footnote 5 The United States Religious Landscape Survey is based on extensive interviews with more than 35,000 adults (18 and older) regarding religious practices, beliefs, and respondent demographics. The data was collected over the summer months of 2007, and it is widely cited in both formal research and the popular media. Our research takes advantage of the broad scope of the Survey, which asks a number of questions that can reasonably be construed as indicators of secularism in one form or another, thereby allowing us to examine several different senses of “secularism” described above. We are therefore able to move beyond the narrow bounds of religious beliefs and church activities, and we can incorporate respondents' views on abortion, homosexuality, and evolution in our analysis. Variables used in our study may be usefully classified into three categories: (1) secularism indicators; (2) respondent demographics; and (3) political affiliation and ideology. Descriptive statistics are summarized in Table 1.
Descriptive statistics (Obs. = 21,153)

All means computing using the sampling weight provided in the Survey.
Secularism Indicators
In an effort to expose the underlying latent variables measuring types of secularist attitudes, factor analysis is conducted on a number of questions from the Religious Landscape Survey. As discussed above, we suspect there are at least two, and possibly three, latent factors, which we term Religious (Theological) Secularism, Political Secularism, and Moral Secularism. Religious Secularism is based on five questions (labeled y 1 through y 5), three of which have Yes/No responses including: (1) Are you an Atheist or Agnostic? (2) Do you believe in God or a universal spirit? (3) Do you believe in life after death? We code these questions with a dummy variable that comports with a secularist attitude (that is, “Yes, No, No” indicates a religious secularist). Reponses to two additional questions are based on ordered Likert scales. The first relates to prayer: (4) Outside of attending religious services, do you pray (a) several times a day; (b) once a day; (c) a few times a week; (d) once a week; (e) a few times a month; (f) seldom, or (g) never? The second question inquires about the importance of religion to the person: (5) How important is religion in your life — (a) very important; (b) somewhat important; (c) not too important; or (d) not at all important? Both answers offer responses ordered by increasing inherent secularism, so we retain the categorical structure of the responses in the order provided.
Political Secularism focuses mainly on the role of religion in political matters. The questions all offer dichotomous responses, and include: (1) Do you worry the government is getting too involved in the issue of morality?; (2) Do religious beliefs most influence your thinking about government and public affairs?; (3) Should churches and other houses of worship keep out of political matters? Consistent with a secularist attitude, the dummy variables x 1, x 2, and x 3, take values of 1 for a Yes, No, and Yes responses, respectively, to these questions.
Moral Secularism is captured by three questions. The first has a dichotomous response: Is homosexuality a way of life that should be accepted by society? The dummy variable z 1 is coded 1 for a positive response. The other two questions are categorical and we retain their structure. On the issue of abortion, the question is: Do you think abortion should be (1) legal in all cases; (2) legal in most cases; (3) illegal in most cases; or (4) illegal in all cases? As for the respondent's attitude toward scientific analysis of human origins, the Survey includes the statements: Evolution is the best explanation for the origins of human life on earth: (1) completely agree; (2) mostly agree; (3) mostly disagree; or (4) completely disagree. Categorical responses to these questions are labeled z 2 and z 3 with the order of responses reversed to comport with a secularist attitude.
With respect to the secularism indicators, we see (from Table 1) that the indicators assumed to represent religious secularism have much lower means than those indicators for Political and Social Secularism. Only about 5% of persons do not believe in God (y 2), for example, yet about 86% indicate that religion is not important in forming political opinions (x 2), and over half (54%) believe homosexuality should be accepted by society (z 1). The distribution of responses for the ordered variables presents a similar story. As for prayer, the distribution is bimodal, but does indicate the activity tends to be frequent (question y 4) for many respondents. People indicate they pray: several times a day (37.4%); once a day (20.4%); a few times a week (14.8%); once a week (2.8%); a few times a month (5.9%); seldom (11.2%), or never (7.5%). Respondents also tend to rate religion as important in their life (question y 5): very important (55.4%); somewhat important (27.6%); not too important (9.6%); and not at all important (7.4%). When it comes to abortion, the views are moderate, with responses that abortion should be: legal in all cases (15.4%); legal in most cases (29.0%); illegal in most cases (36.6%); or illegal in all cases (19.0%). When it comes to evolution as a theory of human origins, however, responses are more evenly spread: completely agree (30.4%); mostly agree (17.9%); mostly disagree (30.5%); or completely disagree (21.2%).
Respondent Demographics
We include 16 respondent demographic variables in the analysis, all of which are dummy variables except for a variable measuring (the natural log of) age in years. A set of dummy variables, each set equal to one for a positive response, is developed for the characteristics that the respondent: (1) has at least a Bachelor degree; (2) has an income between $20,000 and $40,000; (3) has an income between $40,000 and $75,000; (4) has an income between $75,000 and $150,000; (5) has an income exceeding $150,000; (6) is single; (7) is male; (8) was raised in a religious household; (9) is Hispanic; (10) is Black; is an immigrant to the United States; and (11) lives in a urban area. There are also three dummy variables for census regions (Northeast, Midwest, and South; West is excluded).
Political Party Affiliation and Ideology
We employ three Survey questions to create dependent variables related to political party affiliation and political ideology. As for party affiliation, we use the question: In politics today, do you consider yourself a Republican, Democrat, or Independent? Permitted voluntary responses include “No Preference” and “Other Party,” the latter of which is excluded since it is very rare in the sample and points to no particular political ideology. A follow-up question is asked of respondents answering “Independent” or “No Party affiliation”: As of today do you lean more to the Republican Party or more to the Democratic Party? Valid responses also include the broad categories “Other” and “Don't Know.” In this case, we include such responses in the sample, since they indicate no particular leaning toward an established political party. Regarding political ideology, we use answers to the question: In general, would you describe your political views as: (1) Very Conservative; (2) Conservative; (3) Moderate; (4) Liberal; or (5) Very Liberal? This again presents a five point ordered scale. We order the scale from Very Conservative to Very Liberal, so the response is a measure of the intensity of Liberal ideology.
RESULTS
Our estimation procedure involves two steps (Walker and Ben-Akiva 2002; Humlum et al. Reference Humlum, Kleinjans and Neilson2012). In the first, we use factor analysis to identify the underlying latent factors driving secular attitudes. Then, in the second, we use these identified factors to investigate the impact of secularism, of different types if applicable, on political party affiliation and ideology. Since the second stage uses generated regressors obtained from the first, all statistical tests are based on bootstrapped standard errors (400 repetitions). Given the large sample size, the bootstrapped standard errors are not materially different from their asymptotic counterparts, and none of the results of interest are affected by the procedure.
Factor Analysis
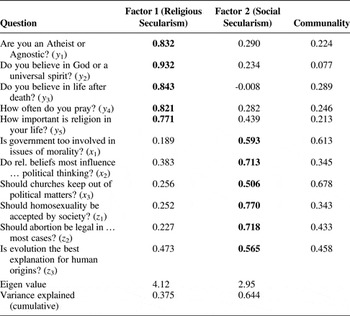
Factor analysis is conducted on the 11 questions listed above. Given that all 11 questions have either dichotomous or categorical responses, factor analysis is conducted using the polychoric correlation matrix, which is suitable for such data (Pearson Reference Pearson1901). Applying principal component factor analysis to the polychoric matrix and Varimax rotation, we find two factors with Eigen values in excess of unity explaining 64% of the variance. The Kaiser-Meyer-Olkin measure of sampling adequacy has a value of 0.88, which is exceptional. We thus conclude that: (1) the model is “working,” and is successful in identifying underlying latent factors, and (2) there appear to be two significant factors, which together explain almost two-thirds of the variance in observed behavior.
The Varimax factor loadings are summarized in Table 2. Using the rule-of-thumb loading cut-off of about 0.40 (Manly Reference Manly and BFJ1994), Table 2 reveals that those questions categorized as indicating religious Secularism (y 1 − y 5) strongly load to factor 1, and, with perhaps one exception (y 5), weakly to factor 2. In contrast, those questions we considered indicators of Political (x 1 − x 3) or Moral Secularism (z 1 − z 3) load heavily to factor 2, but, again with perhaps two exceptions, weakly to factor 1. Factor analysis, therefore, provides two key results. First, secularist views do, in fact, take multiple forms. In this case, the analysis clearly delineates secularism of a religious nature from secularism of a more social or political nature. Second, the factor analysis suggests that what we defined as moral and political forms of secularism arise from a single latent factor. Consequently, we have two factors measuring secularist attitudes, which we can label “Religious Secularism” and “Social Secularism,” the latter of which is a grouping of the Political and Moral Secularism categories previously defined. In order to facilitate the second-stage estimation of political affiliation and ideology, factor scores are predicted for each respondent.
Rotated factor loadings (Obs. = 25,995)

There are a few exceptions worth discussing as these unique cases indicate that survey questions (in the future) should be designed more clearly delineate between secularism of a religious and political or social nature. Take the question “How important is religion in your life?,” (y 5) which loads with a score of 0.77 to factor 1 and a marginally-relevant score of 0.44 to factor 2. This latter loading is very close to the standard threshold of 0.40. The question is, notably, somewhat open ended as to what aspect of life is affected by religion. For example, some very religious individuals may respond that religion is relatively unimportant simply because it is not relevant in their political or social belief systems. Indeed, the responses to this question (y 5) are most strongly correlated (ρ = 0.64) with responses to question x 2 (regarding the importance of religion for political thinking). As would be expected (given the relation to y 5), we likewise see a slightly marginal loading for x 2. Still, in both cases, the loading is essentially equal to a rule-of-thumb cut-off.
The question regarding evolution (z 3) has a factor 1 loading of 0.47 and a factor 2 loading of 0.56. We are not surprised by this result. Evolution is plainly a religious matter, as its antithesis is Creation theory which is biblical in origin. Also, the social concern with evolution is not its scientific nature, but the fact it is taught in public schools. Evolution is both a religious and a political issue. In many respects, therefore, the loading on z 3, and to a large extent y 5 and x 2, supports our delineation of secularism into religious and social types, but also confirms the two may be correlated in some dimensions, perhaps merely due to the phrasing or interpretation of the question. In both cases, the survey questions go to both religion and politics, and the factor analysis indicates this. Overall, however, the evolution issue appears to be more social than religious in nature, and the other two questions load much more heavily to their respective factors.
Demographics and Secularism
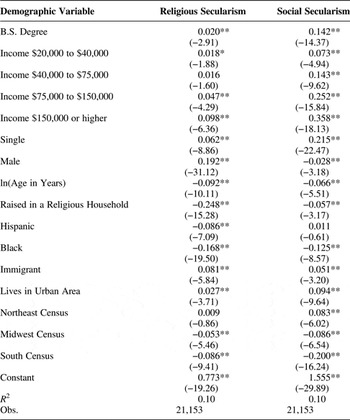
Table 3 presents the results of OLS regression of the factor scores on the demographic variables used later in the party affiliation and political ideology analysis. Based on the work of Skrondal and Laake (Reference Skrondal and Laake2001), the secularism factors, which in this case serve as dependent variables, are generated using the Bartlett method to render consistent parameter estimates. Within each type of secularism, the factor scores generated by Varimax and Bartlett are highly correlated (ρ > 0.96 in both cases).
OLS regression of factors on demographics

Statistical significance: ** 5%. * 10%.
There are some notable differences in the relationships between the demographic variables and the factor scores. First, education and income have a stronger influence on Social Secularism than on the purely religious sort. Social Secularism is more common at higher incomes. The coefficients on income are small or zero in the Religious Secularism equation. While the coefficient on education is positive and marginally significant in the Religious Secularism equation, it is quite small. Single persons have higher secularism scores, but the effect is much larger for Social Secularism, though the effect is again small in an absolute sense. In contrast, males have larger scores for Religious Secularism, but smaller scores for Social Secularism. Older persons are less likely to be secular in either sense, but slightly more so for Religious Secularism. Not surprisingly, being raised in a religious household has a potent influence on Religious Secularism, but only a mild negative effect on Social Secularism. Blacks have lower secularism scores generally, while Hispanics only have lower scores for Religious Secularism. Immigrants have larger secularism scores, but the difference is larger for Religious Secularism.
Table 3 permits the assembly of a profile of those who are likely to be secularist. A “typical” social secularist would tend to be a well-educated, higher-income, youthful Anglo-Saxon male less likely to be raised in a religious household. The opposite sort of person would be less likely to be a social secularist. A religious secularist, on the other hand, is more likely to be less educated, married, black or Hispanic and less likely to be raised in a religious household. We also see some geographic differences in secularism scores with urban dwellers being more secular generally. Persons living in the midwest and south are generally less secular, and those living in the Northeast more socially secular but not more religiously secular than those living in the west.
Political Party Affiliation
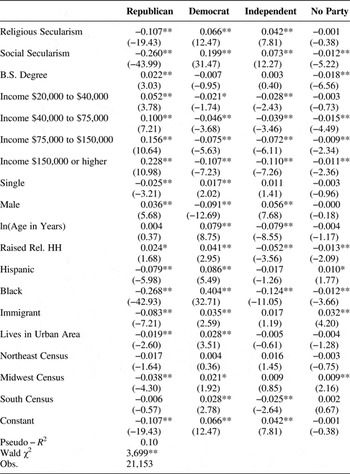
We turn now to the question of political party affiliation and its relation to secularism. Survey respondents are classified into the four types: Republicans, Democrats, Independents, and No Party affiliation. The observations fall into one of the four categories, so we estimate the affiliation choice using multinomial logit (MNL). As the coefficients are difficult to interpret, we present instead the marginal effects (the change in probability of the dependent variable for a one-unit change in the regressor), which are summarized in Table 4. The MNL estimation exhibits a statistically significant improvement in explanatory power (χ2 = 3,699; Prob < 0.01). The Pseudo-R 2 statistic is 0.10. A pair of specification tests is conducted (Long and Freese Reference Long and Freese2005). First, we test the legitimacy of the independence of irrelevant alternatives (IIA) assumption required for the MNL. We cannot reject the null hypotheses of the Small-Hsaio tests for independence. Second, the null hypotheses that any two outcomes can be combined into a single outcome are all strongly rejected, so treating “No Party” separately from “Independent” is necessary.
Marginal effects for party affiliation

The marginal effects (and underlying coefficients) for the Religious and Social Secularism variables are statistically significant at the 5% level or better for all but one choice (Religious Secularism, No Party). Secularism of both types is unpopular in the Republican Party, with well-estimated, negative effects found for both factor variables. The marginal effect for Social Secularism (−0.26) is just over twice as large as the marginal effect for Religious Secularism (−0.11). While both the religious and social secularists eschew the Republican Party (on average), such persons have a strong preference for the Democratic Party. Social Secularism, with a marginal effect of 0.20, again has a substantially more potent influence on party affiliation (three-times as large) than does Religious Secularism, with a marginal effect of 0.066.
Secularists also tend to self identify as Independents. Again, the effect of Social Secularism (0.073) is about 70% larger than the effect of Religious Secularism (0.042). For the few respondents who identify as having “No Party” affiliation, Religious Secularism has no effect, but these persons tend to be less secular in the social sense. The marginal effects are −0.001 for Religious Secularism but −0.012 for Social Secularism, the latter of which is statistically different from zero and is, of course, much larger than the religious effect.
We conclude, therefore, that secularism of a religious nature is more common among those self-identifying as either Democrat or Independent, and less common among Republicans. Social Secularism follows a similar pattern, favoring Democrat and Independent affiliations while reducing both Republican and No Party affiliations. The marginal effect of Social Secularism is, however, much larger than Religious Secularism in all cases. Party affiliation appears to be more about politics than it does religion, but religion does have a statistically-significant influence on affiliation.
Assuming secularism is rising, we can use the estimated marginal effects from the MNL to simulate the consequences for political parties (other things constant). Assume, for example, we have a sample of 1,000 voting age individuals. In the initial state, based on the sample means, there will be (approximately) 330 Democrats, 330 Independents, 300 Republicans, and 4 identifying as “No Party.” Now, assume the degree of secularism (as measured by the latent factors) of both types increases by 10%. As a consequence of the rise in Religious Secularism, we expect to observe about 7.4 Republicans leaving the GOP, of which 4.6 become Democrats and 2.9 become Independents. A similar increase in Social Secularism costs the Republicans about 31.4 members and the “No Party” group 1.4 members, with 24 becoming Democrats and 9 becoming Independents.
Some of the demographic variables are of interest. Respondents with a college degree favor the Republican Party, as do those with higher incomes. A higher income is decidedly unfavorable for the other “parties,” but a college degree only appears to increase Republican affiliation and reduce a “No Party” response. Males are more likely to be Republicans or Independents than they are Democrats. Older persons appear to affiliate more regularly with the Democratic Party, and eschew the Independent label. Those raised religious tend to affiliate with the major parties (both Republican and Democratic), and may be considered more conventionally politically active for doing so. Hispanics and Blacks are prone to Democratic Party affiliation to the detriment of the Republican, Independent, and No Party affiliations, but the marginal effect for Blacks is considerably larger than that for Hispanics. Immigrants do not appear to be politically active, though we suspect this may change over time with rising population shares. Persons in urban areas are more likely to be Democratic than Republican.
The Leaning of the Independents
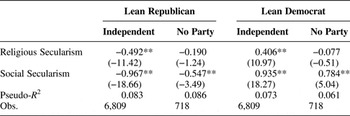
We have additional evidence on the political party preferences of those self identifying as Independent or No Party. Specifically, the Survey asks this subset of the sample whether or not these persons lean toward the Republican or Democratic Party. To see the effect of secularism on such leanings, we estimate logit regressions separately for the Independent and No Party samples. For exposition, we limit the reported statistics to the coefficients for the secularism variables. We see from Table 5 that Secularism of all types disfavors the Republican Party. In contrast, secularism favors the Democratic Party in most cases. As before, Social Secularism has the more potent influence.
Political party leanings by non-partisans

Statistical significance: ** 5%. * 10%.
Political Ideology
We turn now to political ideology. Ideology is measured on an ordinal scale comprising the categories Very Conservative, Conservative, Moderate, Liberal, and Very Liberal. To statistically accommodate this sort of data, we estimate ordinal logit models (OLM), which are specifically tailored for categorical responses of this sort. However, the assumption of proportional odds common to the standard ordered models (that is, the slope coefficients are identical across levels of the outcome variable) is strongly rejected for our data (Long and Freese Reference Long and Freese2005, 150–152). As such, our analysis employs the generalized ordered logit model (GOLM), an estimation approach that does not impose the proportional odds constraint. The GOLM renders results very similar to conducting a series of logistic regressions where the first regression partitions the outcomes as the first category versus all the others, the second regression compares the first and second categories versus all the others, and so forth. As such, we can observe how the regression coefficients change across the categories of the ordered dependent variable. As the estimated coefficients are difficult to interpret on inspection, so we provide instead the estimated marginal effects that have a more direct interpretation.
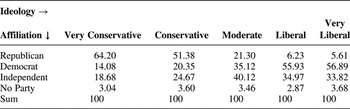
Before summarizing the GOLM results, we first consider the unconditional relationships between party affiliation and political ideology. In Table 6, we see that the Very Conservative are mostly Republican, whereas the Very Liberal are mostly Democrat. Democrats have far more Conservatives than the Republicans do Liberals. Moderates favor, by a factor of about two, Democrat or Independent affiliations. About 3% of each ideological types self identifies as “No Party.” Above, we saw that the more secular attitudes tended to result in Democrat or Independent affiliation. As such, we expect secularism of both types to associate with more Liberal ideologies.
Party affiliation and political ideology (%)

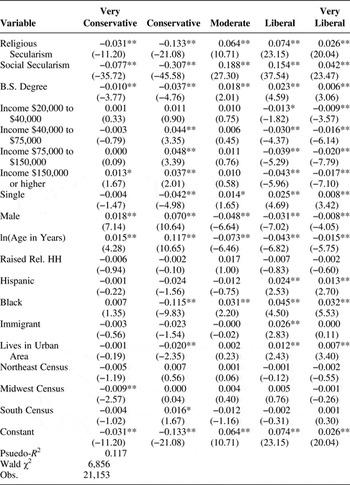
The marginal effects from the GOLM are summarized in Table 7. All the marginal effects for secularism variables are statistically significant at the 5% level or better. The results indicate that secularism is relevant across the full range of political ideology and has its expected effect, moving persons away from the conservative end and toward the liberal end of the ideology continuum. Notably, however, the larger marginal effects are “in the middle,” shifting people among the more moderate ideological stations. Going back to our simple simulation approach, assume we have 1,000 persons in a sample. According to the sample means, there will be 79 identified as Very Conservative, 333 as Conservative, 388 as Moderate, 157 as Liberal, and 54 as Very Liberal. Now, assume a 10% increase in secularism of both types. Based on the increase in Religious Secularism, there will be 2.1 fewer Very Conservatives, 9.2 fewer Conservatives, 4.4 more Moderates, 5.1 more Liberals, and 1.8 more Very Liberals. A larger response is observed for Social Secularism. The increase in secularism produces 9.2 fewer Very Conservative and 37 fewer Conservative types, while increasing the number of Moderates by 22.7, Liberals by 18.5, and the Very Liberal group by 5.1 persons. With regard to the demographics, there are some results which conflict with the party affiliation findings summarized above. For example, a college education tends to move people toward more liberal ideologies, but also tends to lead to Republican Party affiliation. The same is true for the age variable, where older persons are generally more Conservative, but also more likely to be Democrats. Thus, we must conclude that party affiliation is based on far more than just political ideology. Consistent with the results on party affiliation, there is some evidence that those with higher incomes are less likely to embrace the Liberal ideology commonly associated with the Democratic Party. Also, males tend to be more conservative and Republican, while Hispanics, Blacks and those in urban areas tend to be more Liberal and Democratic.
Marginal effects from GOLM for political ideology

Statistical significance: ** 5%. * 10%.
CONCLUSION
The importance of secularism, as both a cause and an effect of fundamental economic and social changes, has been widely assumed and documented in the scholarly literature. Underlying much of this work, however, is the untested hypothesis that “secularism,” however one may precisely define it, is indeed an it: a set of beliefs and associated activities that, however complex and multifaceted, can usefully be represented by some index. The appeal is undeniable: with such an index in hand, one can evaluate the degree to which important social trends are caused by, or perhaps cause, changes in “secularism” in society. Even the more basic problems of measurement, e.g., “is society becoming more secular?”, assume and/or require such a formula. Indeed, it is quite difficult to see how anything very useful can be said if “secularism,” as most people understand it, is so complicated in structure that it largely defies statistical treatment. Thus, our findings have a number of potentially useful implications. Secularism is not “one thing,” as even many studies that have adopted the unitary viewpoint have admitted. There is, however, some counterbalancing “good news”: secularism is evidently two things, at least in the sense that, over a rich and varied set of questions regarding personal religious convictions, views on religion in the public square, abortion, scientific evolution, and so on, these two latent factors alone explain almost two-thirds of variation in the responses. So, although the “unitary view” is not valid, the truth is of evidently manageable complexity.
Having found these two latent factors, and having named them “Religious Secularism” and “Social Secularism” (for the outcomes they primarily affect), we then ask what these factors might tell us about political party affiliation in the United States. The results are partially intuitive, but partially surprising. The surprising findings concern the impact of alternative forms of secularism. Secularists, both social and religious, are not supportive of the Republican Party but social secularists are less supportive than religious secularists. Secularists of both types support the Democratic Party but, again, social secularists are three times more likely to affiliate with Democrats than religious secularists (as they do with Independents). The age distribution of the population does not bode well for Republican affiliation if the trends relating to secularism discovered among the (now) young persist.
The trend to secularism in Western Europe and in developed countries is well documented (Norris and Inglehart Reference Norris and Inglehart2004) as revealed in pooled World Values Surveys since 1990. But one puzzle has always been the “exceptionalism” or paradox of the United States, with high attendance and other indicators of religious participation and belief. While our study is a “still picture” of United States attitudes and factors leading to secularization, there are indications that secularism, both religious and social, may be growing. A growing number of individuals appear to be “self-spiritualizing” as a substitute for organized religion (Bellah et al. 1985). The categories of both “none” and “unspecified” appear to be growing in statistical surveys of affiliations and beliefs in both the Pew and the Religious Identification Surveys (Kosmin and Keysar Reference Kosmin and Keysar2008). The environmental movement may be both a substitute for religion, and a part of “self-spiritualization.” The dichotomous separation of types of secularism may help explain such phenomena and other trends as well. There may well be a move to social secularism in the United States without a change of similar magnitude in religious secularism.
Finally, an important implication of our analysis concerns the relationship between secularism and religiosity. While secularism, by any definition, involves certain attitudes toward religion, the relevant domains of these attitudes differ. It is not accurate to regard secularism as merely the absence of religiosity: both secularism and religiousness have multiple components, and these do not satisfy any easy correspondence. It appears that secularism, as measured here, arises primarily from two component factors (Religious Secularism and Social Secularism). Thus, we need to regard secularism as a phenomenon of independent significance and, although secularism is not a “religion,” its nature is of similar complexity.