Implications
Modern lactating sows are very productive and show a reduced feed intake capacity as a result of the genetic selection for higher feed efficiency. Therefore, lactating sows suffer from excessive BW mobilization. It appears that the intense catabolism of body tissues can negatively impact on their milk production, litter performance and next litter size. The way metabolism is affected by the intense genetic selection implicates in the need of new nutritional strategies to attend the modern lactating sow’s daily needs.
Introduction
Modern sows mature earlier, are more productive, are heavier and have lower body adipose tissue mass reserves than older genotypes. In addition, they have higher nutritional requirements and are less resistant to environmental, immune and nutritional challenges (Silva et al., Reference Schenkel, Bernardi, Bortolozzo and Wentz2009 and Reference Silva, Noblet, Donzele, Oliveira, Primot, Gourdine and Renaudeau2013). The selection for high prolificacy negatively affects sow catabolic status during lactation and, consequently, the performance of their litters (Foxcroft, Reference Foxcroft, Dixon, Dyck, Novak, Harding and Almeida2008). In order to supply the nutritional requirements of sows during lactation, their BW, milk production and composition, and environmental housing conditions must be known. Although it is difficult to measure the nutritional requirements, milk production accounts for 75% to 80% of the total requirements of lactating sows, whereas the remaining 20% to 25% are maintenance requirements (Aherne and Foxcroft, Reference Aherne and Foxcroft2000). In addition, modern sows present reduced feed intake capacity as a result of the genetic selection for higher feed efficiency in growing and finishing pigs (Bergsma et al., Reference Bergsma, Kanis, Verstegen, Van Der Peet-Schering and Knol2009). This reduced feed intake affects mammary gland growth and milk synthesis (Kim et al., Reference Kim, Hurley, Han, Stein and Easter1999).
Although milk production is relatively unaffected by marginal deficiencies in dietary protein and energy because sows are capable of mobilizing body protein and energy to supply amino acid and energy requirements for milk synthesis (Revell et al., Reference Revell, Williams, Mullan, Randford and Smits1998), severe protein and energy deficiency reduces milk production (Knabe et al., Reference Knabe, Brendemuhl, Chiba and Dove1996; Jones and Stahly, Reference Jones and Stahly1999). When sows are not fed adequate amino acid and/or energy in the diet, nutrients from different body tissues, particularly skeletal muscles and fat are mobilized to supply milk production requirements. In addition excessive mobilization of maternal protein commonly results in subsequent reproductive failure (Jones and Stahly, Reference Jones and Stahly1999; Vinsky et al., Reference Vinsky, Novak, Dixon, Dyck and Foxcroft2006).
Sow body condition and its dynamic is an indicator of its physiological status. Adequate nutrient supply for lactating sows may positively influence their body condition, maximizing their productivity in terms of milk production and piglet growth (Oelke et al., Reference Oelke, Dahlke, Beltrani, Pozza, Pazuch and Meurer2008), and minimizing reproductive problems after weaning (Dourmad et al., Reference Dourmad, Etienne, Valancogne, Dubois, van Milgen and Noblet2008). The first objective of this study was to evaluate the impact of feed restriction during the lactation of hyper-prolific sows on their productive and reproductive performance. The second objective was to determine if the body tissue mobilization during lactation imposed by feed restriction could affect litter size and sow performance in the subsequent lactation.
Material and methods
Animals and experimental procedure
The experiment was approved by the Committee of Ethics on Animal Use of the sector of Agricultural Sciences of the Federal University of Paraná, Curitiba, PR, Brazil, under the protocol n. 026/2012. This study was performed between December 2011 and July 2012 at the Beilen do Brasil swine farm (TOPIGS do Brasil Ltd), in Holambra, SP, located in the south-eastern part of Brazil at a latitude of 22°22', and a longitude of 47°1', and altitude of 600 m. According to Köppen’s (Reference Köppen1948) classification, the climate of the region is Cwa (hot, temperate, rainy, and with dry winters and hot summers).
A total of 50 mixed parity sows of a high-prolificacy genetic line (TOPIGS 20®) from five successive replicates of 10 sows each were used in this study. On day 110 of gestation, sows were transferred to a farrowing unit and housed in individual open-fronted farrowing pens (2.1×2.2 m) on a slatted metal floor and fed 2 kg/day of the experimental lactation diet until the day of farrowing. After 24 h of farrowing, sows were weighed and their backfat thickness was measured by ultrasound (Renco Lean-Meater, Renco Corporation, Minneapolis, MN, USA) at P2. Sows were then submitted to a step-up feeding regime to stimulate gradual feed intake increase up to day 7 post-farrowing, starting with 2 kg on day 1 post-farrowing and reaching 8 kg/day on day 7. The allowance increased by 1 kg each day. This feeding management was applied to avoid over-consumption at the beginning of lactation and agalactia problems. The maximum allowance of 8 kg/day was based on historical farm data and on the nutritional requirements of that specific genetic line.
On day 7 post-farrowing, sows were weighed again and their P2 was measured. Sows that gained or lost >4 kg of BW during the first 7 days of lactation were excluded from the experiment. The remaining sows were distributed in a completely randomized experimental design into two treatments, according to parity (1, 2, 3 and 4/5), BW and backfat thickness. Starting from the day after (day 8) sows reached the maximum feed allowance based on the step-up curve, the control sows were fed 8.0 kg feed/day and the restricted sows were fed only 50% of the feed amount offered to the control sows (4.0 kg/day) until weaning. The same suckling pressure was maintained, that is, sows nursed the same number of piglets until weaning on day 28 of lactation.
During the gestation period, sows were housed in individual gestating cages and restrictively fed a conventional diet containing 12.5 MJ ME/kg, 5.5 g SID lysine/kg, 8.9 g Ca/kg, 3.8 g available phosphorus/kg, with an electrolyte balance (EB) of 220 mEq/kg. The diet was based on maize, wheat middling and soybean meal, and was supplemented, with synthetic trace minerals and vitamins. Feed allowance during the first 49 days after mating was calculated to standardize body condition at farrowing, according to the requirements proposed by Rostagno (Reference Rostagno2011). The feeding level was fixed at 2.4 kg/day from days 50 to 84 and at 3.0 kg/day from days 85 to 109 of gestation.
All sows were fed the same lactation diet between day 110 of gestation until weaning, containing 14.4 MJ ME/kg, 10 g SID lysine/kg, 9.8 g Ca/kg, 4.5 g available phosphorus/kg and with an EB of 187 mEq/kg. The diet was based on maize, soybean meal (45% CP), soybean oil and wheat bran, and was supplemented with synthetic trace minerals, vitamins and industrial amino acids. The diet was formulated to supply the nutritional requirements of the sows according to the feeding manual of the genetic company. The ratio between digestible essential amino acids and digestible lysine in the gestation (methionine+cystine: 54%; threonine: 79%; tryptophan: 19%; valine: 72%; arginine: 100%; isoleucine: 60%; leucine: 100%; and phenylalanine+tyrosine: 100%) and lactation (methionine+cystine: 54%; threonine: 64%; tryptophan: 19%; valine: 78%; arginine: 59%; isoleucine: 59%; leucine: 118%; and phenylalanine+tyrosine: 114%) diets were calculated to ensure that when necessary they were not below that of the ideal protein recommended for this animal category by Rostagno (Reference Rostagno2011).
After birth, piglets were handled for tooth cutting, umbilical cord treatment and ear tagged for labeling. On day 3, piglets received an intramuscular injection of 200 mg of iron dextran. As necessary, cross-fostering was conducted within the first 48 h after birth to standardize litter size at 14 piglets. On day 10, male piglets were castrated. Piglets were not offered creep feed during the entire lactation period. Creep housing equipped with IR lights provided supplemental heat for the piglets during the lactation period. At weaning, sows were moved to a breeding facility and were presented to a mature boar twice daily to detect onset of standing estrus. Sows were inseminated when positive in the back-pressure test. During the weaning-to-estrus interval, all sows were submitted to the same feeding management, receiving 3.0 kg/day of the lactation diet. The feeding management and dietary composition during the subsequent gestation followed the same of the previous gestation. During the subsequent lactation period, a step-up feeding management was applied until day 7, after which all sows were offered 8 kg/day of the same diet fed in the previous lactation, independently of the feeding management applied in the previous lactation.
Measurements and collected parameters
Variations in the environmental conditions inside the farrowing unit were recorded daily using data loggers (Model LogTag HAXO-8, LogTag Recorders Limited, Auckland, New Zealand) placed in an empty crate at the center of the farrowing unit at middle-body height. Sows were weighed using a digital scale (Mod. LD 2000E; Líder Balanças Ltd, Araçatuba, SP, Brazil), and backfat thickness was measured at P2 (65 mm from the dorsal line) using ultrasound equipment (Renco Lean-Meater) 24 h post-farrowing, on day 7 of lactation and at weaning in order to determine BW and backfat thickness variation. The following litter parameters were collected at farrowing: total number of piglets born, born alive, stillborn and mummies. Piglets were individually weighed using a digital scale (Mod. B150; Líder Balanças Ltd, Araçatuba, SP, Brazil) 24 h post-farrowing, on day 7 and at weaning to determine litter birth and weaning weights, and daily weight gain during lactation. The dead piglets (i.e. crushed) were also weighed during lactation in order to have a proper estimation of litter development and milk yield.
Every morning, feed refusals were collected, and fresh feed was immediately distributed once per day between 0700 and 0800 h. Feed consumption was determined as the difference between feed allowance and the refusals collected on the next morning. Every day, one sample of feed and feed refusals were collected daily for dry matter (DM) content measurement, and successive samples were pooled and stored at 4°C for further analyses. The feed samples were analyzed for DM, ash, fat content (AOAC, 1990) and CP (N×6.25 for feed) according to Dumas method (AOAC, 1990) and for crude fiber and for cell wall components (NDF, ADF and ADL) according to Van Soest and Wine (Reference Van Soest and Wine1967) at the Animal Nutrition Laboratory of the Federal University of Paraná (Curitiba, PR, Brazil). Dietary amino acids contents were analyzed by Ajinomoto do Brasil (São Paulo, Brazil) using ion-exchange chromatography, except for tryptophan, which was analyzed using HPLC and fluorimetric detection (Waters 600E, St. Quentin en Yvelines, France).
Calculations and statistical analyses
Daily maximum, minimum, mean and variance of daily ambient temperatures and relative humidities were averaged and analyzed for the entire experimental period. Body protein, fat and energy contents at farrowing and at weaning were estimated according to the equations of Dourmad et al. (Reference Dourmad, Etienne, Noblet and Causeur1997). Protein, lipid and energy losses during lactation were estimated as the difference between calculated values determined at farrowing and at weaning. Average daily milk production estimation was based on litter growth rate and size during lactation, according to the equations of Noblet and Etienne (Reference Noblet and Etienne1989). Lactation efficiency was calculated using the equation proposed by Bergsma et al. (Reference Bergsma, Kanis, Verstegen, Van Der Peet-Schering and Knol2009), as the result of the division of energy input (derived from feed intake and body mobilization) by energy use for sow maintenance and litter maintenance and growth. Data were submitted to normality tests and analyzed using the GLM procedure of SAS statistical package (SAS Institute Inc., Cary, NC, USA; version 9.2). The effects of parity order (O), replicate (G) and treatments during lactation (TL) and their interactions (TL×O; TL×P; TL×G) and litter size as a covariate effect were included in the statistical model.
Results
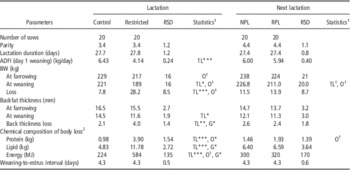
Average, minimum and maximum temperatures and minimum and maximum relative humidity levels measured during the experimental period were 16.5°C and 32.1°C, and 37.1% and 96.1%, respectively. A total of 10 sows were removed from the study due to excessive BW gain or loss during the first 7 days of lactation. According to the experimental design, average parity was 3.4, and did not differ between treatments. No difference in lactation length was observed between treatments (27.7 days on average). The control sows presented significantly higher feed intake (P<0.001) compared with the restricted sows (6.43 v. 4.14 kg/day, respectively; Table 1). Despite being offered 8.00 kg/day of feed, the average feed intake of sows in the control treatment was 6.43 kg/day. There was no effect of treatments on sow feed intake in the subsequent lactation (average of 5.95 kg/day; Table 1).
Impact of feed restriction on the performance of sows during 28 days of lactation and on next lactation performance

NPL=normal feeding previous lactation; RPL=feed restriction previous lactation.
1 Obtained by ANOVA (GLM including the effects of parity (O), treatment (TL) and sow replicate (G) and their interactions (TL×O; TL×G)).
2 Calculated based on the equations of Dourmad et al. (Reference Dourmad, Etienne, Noblet and Causeur1997).
***P<0.001, **P<0.01, *P<0.05, † P<0.10.
Treatments influenced BW loss and backfat thickness (P<0.001), as shown in Table 1. Control sows lost less BW than the restricted-fed sows (7.8 v. 28.2 kg; P<0.001), as well as lower backfat loss (2.07 v. 3.97 mm; P<0.01). Restricted-fed sows tended (P<0.10) to be lighter at weaning in the subsequent lactation compared with the control sows (211.0 v. 226.8 kg; Table 1). There was no influence of treatments on backfat thickness loss in the next lactation (P>0.10). The chemical composition of BW loss was influenced by the treatments (P<0.001; Table 1). The restricted-fed sows lost more body protein, lipids and energy compared with the control sows (3.90 v. 0.98 kg, 11.78 v. 4.83 kg and 584 v. 224 MJ, respectively). There was no effect of treatments on the chemical composition of BW loss in the subsequent lactation (P>0.10).
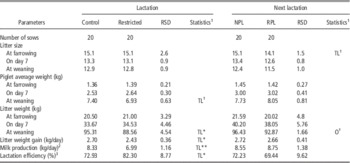
Litter size at birth and weaning and weight at birth were not influenced (P>0.10) by the treatments. Piglet weaning weight tended (P<0.10) to be higher for the control sows when compared with the restricted-fed group (7.4 v. 6.9 kg; Table 2). As for the litter weight gain during lactation, control sows showed a higher (P<0.05) gain when compared with restricted-fed sows (2.70 v. 2.43 kg/day; Table 2). There was no effect of treatment (P>0.10) on birth weight, piglet weaning weight, litter weight gain or litter size at weaning in the subsequent lactation. Litter size tended to be lower at farrowing for the restricted-fed sows (15.1 v. 14.1; P<0.10; Table 2) in the subsequent lactation.
Impact of feed restriction on sows on the performance of their litters during 28 days of lactation and on next lactation performance

NPL=normal feeding previous lactation; RPL=feed restriction previous lactation.
1 Obtained by ANOVA (GLM including the effects of parity (O), treatment (TL) and sow replicate (G) and their interactions (TL×O; TL×G)).
2 Daily milk production (MP) calculated considering litter weight gain (DWG), litter size and milk dry matter content (19%) applied to the equation of Noblet and Etienne (Reference Noblet and Etienne1989). MP (kg/day)=([0.718×DWG−4.9]×number of piglets)/0.19.
3 Lactation efficiency (LE) was calculated by the equation of Bergsma et al. (Reference Bergsma, Kanis, Verstegen, Van Der Peet-Schering and Knol2009). LE (%)=energy input (derived from feed intake and body mobilization) by energy use for sow maintenance and litter maintenance and growth.
**P<0.01, *P<0.05, † P<0.10.
Daily milk production was 19% higher (P<0.01) in the control sows compared with the restricted-fed sows (8.33 v. 6.99 kg/day; Table 2). However, restricted-fed sows presented a higher (P<0.05) lactation efficiency than the sows of the control group (82.3% v. 72.93%; Table 2). Milk production parameters and lactation efficiency in the next lactation were not affected (P>0.10) by the treatments. The weaning-to-estrus interval did not differ among treatments and averaged 4.29 days (P>0.10; Table 1). There was no influence of treatments (P>0.10) on the weaning-to-estrus interval of the next lactation.
Discussion
In the present study, restricted-fed sows presented a 2.43 kg/day lower feed intake compared with the control sows due to the feed restriction imposed from day 7 of lactation. The effects of nutrient restriction and consequent catabolism during lactation on sow reproduction and longevity have been extensively studied in the last few years (Foxcroft et al., Reference Foxcroft1995; Vinsky et al., Reference Vinsky, Novak, Dixon, Dyck and Foxcroft2006; Quesnel, Reference Quesnel2009; Schenkel et al., Reference Silva, Taveira, Pinto and Araujo2010; Patterson et al., Reference Patterson, Smit, Novak, Wellen and Foxcroft2011). However, the metabolic behavior of sows under intense catabolism needs to be further understood (Bergsma et al., Reference Bergsma, Kanis, Verstegen, Van Der Peet-Schering and Knol2009; Patterson et al., Reference Patterson, Smit, Novak, Wellen and Foxcroft2011).
In our experiment, sows submitted to feed restriction presented higher BW loss than the control sows, corresponding to 12.9% and 3.3% of the initial BW, respectively. Similarly, other studies evaluating the effects of feed restriction in primiparous sows during lactation reported BW losses of 3.1% and 8.7% (Vinsky et al., Reference Vinsky, Novak, Dixon, Dyck and Foxcroft2006) and 3.7% and 11.0% (Patterson et al., Reference Patterson, Smit, Novak, Wellen and Foxcroft2011) in sows fed ad libitum compared with sows fed restrictively, respectively. The greater BW loss observed in restricted-fed sows in our study can be attributed to the fact that they produced, on average, 34% more milk than that reported in the above-mentioned studies, explaining their higher nutritional requirements, and consequent greater BW loss. In addition, the sows submitted to feed restriction presented greater backfat thickness loss (+1.9 mm). This result is consistent with the findings of other authors (Foxcroft et al., Reference Foxcroft1995; Eissen et al., Reference Eissen, Apeldoorn, Kanis, Verstegen and Greef2003; Vinsky et al., Reference Vinsky, Novak, Dixon, Dyck and Foxcroft2006; Quesnel, Reference Quesnel2009; Schenkel et al., Reference Silva, Taveira, Pinto and Araujo2010; Patterson et al., Reference Patterson, Smit, Novak, Wellen and Foxcroft2011). Although backfat thickness does not reflect total fat body reserves, changes in this parameter may indicate that the sow is in negative energy balance (Jittakhot et al., Reference Jittakhot, Hasinnarong and Kaeoket2012). Therefore, these findings indicate that the observed backfat thickness reduction reflects insufficient energy intake during lactation.
When sows are not fed adequate nutrient amounts, particularly of protein and lipids, skeletal muscle proteins are mobilized to supply milk production needs. Restricted-fed sows presented higher protein (+2.92 kg) and lipid (+6.95 kg) losses compared with control-group sows. Vinsky et al. (Reference Vinsky, Novak, Dixon, Dyck and Foxcroft2006) and Patterson et al. (Reference Patterson, Smit, Novak, Wellen and Foxcroft2011) observed similar losses in sows submitted to feed restriction during lactation. Several authors suggest that the nutritional and metabolic changes in lactating sows may have deleterious effects on dam biology, with negative impacts on follicle development, and consequently on embryo development and on the number of piglets born in the next litter (Foxcroft et al., Reference Foxcroft, Aherne, Clowes, Miller and Zak2007; Ashworth et al., Reference Ashworth, Toma and Hunter2009; Quesnel, Reference Quesnel2009; Schenkel et al., Reference Silva, Taveira, Pinto and Araujo2010; Hoving et al., Reference Hoving, Soede, Graat, Feitsma and Kemp2011). According to Foxcroft et al. (Reference Foxcroft, Vinsky, Paradis, Tse, Town, Putman, Dyck and Dixon2009), the mechanisms affecting fertility may involve hormonal changes, as well as epigenetic changes and/or changes in the expression of genes related to embryo development. Sows under severe catabolism present reduced IGF-1 levels (Patterson et al., Reference Patterson, Smit, Novak, Wellen and Foxcroft2011), inducing the mobilization of endogenous protein (Zak et al., Reference Zak, Cosgrove, Aherne and Foxcroft1997). Protein mass losses >12% during lactation may reduce follicle number and diameter, and decrease IGF-1 levels in sows submitted to dietary protein restriction during lactation (Clowes et al., Reference Clowes, Aherne, Foxcroft and Baracos2003a and Reference Clowes, Aherne, Schaefer, Foxcroft and Baracos2003b). Schenkel et al. (Reference Silva, Taveira, Pinto and Araujo2010) recently reported reduced size of the next litter when sow’s body mass and protein mass losses exceeded 8% and 9%, respectively.
The size of the next litter of the sows previously submitted to feed restriction tended to be lower relative to the control group (15.16 v. 14.13 piglets). The observed −1.03 piglet difference may be related to the 12.9% and 13.8% losses in body mass and protein mass, respectively, observed in restricted-fed sows of the present study. It must be noted that these losses are greater than the 12% reported in literature. This indicates that the predisposition of excessive mobilization of protein mass in hyper-prolific sows submitted to feed restriction may have a negative impact on the next litter size.
In our study, restricted-fed sows lost more energy (+38%) than those in the control group. Their body energy mobilization, however, was not sufficient to supply litter energy requirements for maintenance and growth and therefore, the restricted-fed sows produced less milk (−16%) on a daily basis, resulting in lower litter daily weight gain (−7%), and consequently, in lower piglet weight (−6%) and lighter litters at weaning (95.31 v. 88.56 kg for control and restricted-fed sows, respectively). Although restricted-fed sows mobilized more energy on a total basis when compared with control sows, they lost less energy per kg of BW when compared with the control (20.7 v. 28.7 MJ/kg BW loss). The same was observed for lipid contribution to BW loss, which decreased from 62% to 42%, respectively, for control and restricted-fed sows. These findings indicate that restricted sows are more efficient in using energy from feed and body mass when compared with sows fed ad libitum. Bergsma et al. (Reference Bergsma, Kanis, Verstegen, Van Der Peet-Schering and Knol2009) mentioned that lactation efficiency expresses the ratio between sow energy input (feed intake and body mobilization) and output for litter growth.
The definition applied to the restriction model used in the present study clearly indicates that restricted-fed sows were more efficient (+13%) than the control sows, that is, for each kg of feed intake, restricted-fed sows produced 1.49 kg of milk per kg of feed intake, whereas the control sows produced 1.13 kg. Patterson et al. (Reference Patterson, Smit, Novak, Wellen and Foxcroft2011) also observed that restricted-fed sows were more efficient (+14%) relative to those fed ad libitum (controls). Those authors suggest that the control sows were able to produce more milk while protecting themselves from catabolism and its negative impacts, and therefore presented longer longevity. Based on our findings and literature reports (Vinsky et al., Reference Vinsky, Novak, Dixon, Dyck and Foxcroft2006; Bergsma et al., Reference Bergsma, Kanis, Verstegen, Van Der Peet-Schering and Knol2009; Schenkel et al., Reference Silva, Taveira, Pinto and Araujo2010; Patterson et al., Reference Patterson, Smit, Novak, Wellen and Foxcroft2011), it is evident that genetic improvement programs should seek the enhancement of energy efficiency of lactating sows in order to obtain dams with good maternal ability, lean carcasses and higher milk production at a determined feed intake and body reserve mobilization.
Literature studies have shown the relationship between weaning-to-estrus interval and energy intake during lactation (Foxcroft et al., Reference Foxcroft1995; Patterson et al., Reference Patterson, Smit, Novak, Wellen and Foxcroft2011). However, independently of feed intake pattern, 90% of the sows tend to present estrus within 3 to 5 days after weaning (Patterson et al., Reference Patterson, Cameron, Smith, Kummer, Schott, Greiner, Connor and Foxcroft2010 and Reference Patterson, Smit, Novak, Wellen and Foxcroft2011; Schenkel et al., Reference Silva, Taveira, Pinto and Araujo2010). The results of the present study confirm the observations of Vinsky et al. (Reference Vinsky, Novak, Dixon, Dyck and Foxcroft2006) and Patterson et al. (Reference Patterson, Smit, Novak, Wellen and Foxcroft2011) that hyper-prolific sows, despite experimentally restricted-fed to 50% of the expected voluntary intake and extensive body tissue catabolism, presented estrus almost immediately after weaning and acceptable farrowing rates after breeding. This may be partially due to the genetic selection against weaning-to-estrus interval (Vinsky et al., Reference Vinsky, Novak, Dixon, Dyck and Foxcroft2006; Bergsma et al., Reference Bergsma, Mathur, Kanis, Verstegen, Knol and Van Arendonk2013). However, although energy balance may become positive after weaning, sows with rapid return to estrus may not have fully recovered from the damages caused by catabolism during lactation, with possible negative impacts on follicle and embryo quality, and consequently on the size and quality of the next litter (Quesnel et al., Reference Quesnel, Etienne and Père2007; Quesnel, Reference Quesnel2009).
In conclusion, the present study demonstrates that feed restriction during lactation causes severe catabolism of body tissues of sows, negatively impacting on their milk production yield, and on litter weight gain and possibly on the number of piglets born in the next litter; however, the fertility of the weaned sow is not affected. On the other hand, restricted-fed sows are more efficient, producing more milk per amount of feed intake. The higher lactation efficiency observed in these sows indicated that there was more available energy through mobilization from body reserves above maintenance of the sow used for piglet growth and maintenance than from feed intake. These results suggest that the intense selection pressure to which modern sows have been submitted changed their biology and metabolism.
Acknowledgments
The authors gratefully acknowledge TOPIGS do Brasil Ltd (Curitiba, PR, Brazil) for the opportunity of performing this study in the company’s experimental farm and for their financial support; and TOPIGS Research Center IPG (Beuningen, The Netherlands) for the statistical analyses support. The authors also gratefully acknowledge Ajinomoto do Brasil Ind. e Com. de Alimentos Ltd (São Paulo, SP, Brazil) for donating the amino acids used during the experiment and for funding the laboratory analyses of the experimental diets.