Introduction
Stroke is a significant global health issue, ranked as the third leading cause of death and disability worldwide, after cardiovascular disease and cancer. Each year, about 16 million individuals suffer strokes, resulting in 6 million deaths and an additional 6 million cases of long-term disability [Reference Frykberg, Lavery, Pham, Harvey, Harkless and Veves1–Reference Boulton3]. In the United States, approximately 796,000 people have strokes annually [Reference Farahpour, Jafarnezhad, Damavandi, Bakhtiari and Allard4], with 650,000 being first-time incidents and 187,000 being recurrent. Strokes occur due to disrupted blood flow to the brain [Reference Farahpour, Jafarnezhad, Damavandi, Bakhtiari and Allard4, Reference Sacco, Picon, Macedo, Butugan, Watari and Sartor5] and are primarily classified into two types: ischemic (∼80%) and hemorrhagic (∼20%) [Reference Alam, Riley, Jugdey, Azmi, Rajbhandari, D’Août and Malik6].
Current imaging techniques, such as magnetic resonance imaging (MRI) and computed tomography (CT) scans, are costly and less accessible, particularly in rural areas, and are usually available only after hospital admission. According to the World Health Organization (WHO), almost 75% of the global population lacks access to dependable and affordable imaging systems [Reference Corbee, Maas, Doornenbal and Hazewinkel7]. Additionally, CT scans pose radiation exposure and cancer risks, while MRI is costly and less accessible [Reference Vilela and Rowley8, 9]. Ultrasound and PET imaging demand specialized expertise and are not commonly utilized. There is an immediate need for developing a portable, affordable, nonionizing, and precise imaging system for detecting strokes.
Microwave imaging (MWI) is an advanced technology that provides a portable, noninvasive, nonionizing, and cost-effective approach for detecting brain strokes [Reference Tournier, Bonazzoli, Dolean, Rapetti, Hecht, Nataf, Aliferis, El Kanfoud, Migliaccio, De Buhan and Darbas10–Reference Shao and McCollough15]. This technology can detect early cancerous tissues, hemorrhages, and other head changes, providing rapid diagnosis while patients are still en route to the hospital. MWI capitalizes on the differing dielectric properties of diseased and healthy tissues to diagnose stroke types [Reference Li, Porter, Santorelli, Popović and Coates16].
Severe brain injuries, whether acquired or traumatic, can result from external forces like falls or accidents, as well as internal events such as strokes and tumors. Strokes occur when a blood vessel supplying the brain becomes blocked or bursts, causing either ischemia or hemorrhage. The symptoms of transient ischemic attacks (TIA), strokes, and other medical conditions, such as migraines, fainting, heart issues, and seizures, frequently overlap [Reference Zasler, Katz and Zafonte17]. Thus, it is crucial to avoid misdiagnosing these conditions as strokes. Immediate medical attention is vital for patients with brain injuries. Each passing second is crucial, as millions of brain cells begin to perish immediately after the injury, increasing the risk of irreversible damage or death.Prompt and accurate detection within 4 hours of symptom onset is vital for differentiating between ischemic and hemorrhagic strokes. This timely identification is crucial for administering effective treatment and ensuring optimal recovery, which ultimately enhances survival rates [Reference Jauch, Saver, Adams, Bruno, Connors, Demaerschalk, Khatri, McMullan, Qureshi, Rosenfield and Scott18]. Therefore, it is crucial to have a portable diagnostic system for the swift detection of brain injuries. A general practitioner performs a neurological assessment, but this alone is insufficient for a definitive diagnosis due to the similarity of stroke symptoms with other conditions. Therefore, medical professionals depend on CT and MRI scans, but these devices are neither fast nor portable, making them impractical for smaller medical centers. In contrast, MWI offers a portable system for the early detection of critical conditions like strokes, even during ambulance transport, saving valuable time [Reference Ireland and Bialkowski19]. Recently, MWI has been proposed [Reference Semenov and Corfield20, Reference Tobon Vasquez, Scapaticci, Turvani, Dassano, Joachimowicz, Duchêne, Casu, Crocco and Vipiana21] for detecting brain abnormalities, utilizing the variations in tissues’ dielectric properties [Reference Mohammed, Abbosh, Mustafa and Ireland11]. Hemorrhagic strokes significantly increase the permittivity and conductivity of the affected tissue due to the high water content and ion concentration of blood (by up to 20%) compared to white/gray matter [Reference Semenov22], whereas ischemic strokes result in a decrease in these properties compared to white/gray matter.
The detection of traumatic brain injuries using noninvasive techniques has become a rapidly growing research area, highlighting the potential of MWI to revolutionize brain stroke detection and imaging [Reference Wu and Pan23–Reference Mobashsher, Abbosh and Wang25]. This paper examines advancements in microwave and antenna-based imaging systems for accurate, portable, and timely brain stroke diagnosis, aiming to enhance patient outcomes and access to medical care.
In one study [Reference Wu and Pan23], a folded directional antenna was presented for distinguishing between intracerebral hemorrhage and ischemic stroke. This design features a planar dipole, folding technology, and π-shaped parasitic patches. Another study [Reference Islam, Tariqul Islam and Almutairi26] introduced a compact 3D metamaterial antenna designed for a portable and cost-effective microwave head imaging system. The optimized metamaterial unit cell improved the bandwidth, gain, and efficiency of the device. The system’s capability for detecting brain hemorrhages was validated using a setup with nine antennas and a head phantom. Additionally, a coplanar waveguide-fed monopole antenna [Reference Bhardwaj and Kumar Badhai27] designed for biomedical applications demonstrated low specific absorption rate values on a human phantom, making it suitable for brain stroke detection and wearable devices, with consistent measured and simulated results. Another paper [Reference Sohani, Khalesi, Ghavami, Ghavami, Dudley, Rahmani and Tiberi28] utilized a wideband microstrip antenna for low-complexity MWI to detect hemorrhagic strokes. Validation through simulations and measurements with a human head model and phantom showed effective image reconstruction and stroke detection using Huygens’ principle and artifact removal methods.
This article presents a triple hollow rectangular patch with a hexagonal-shaped slotted ground compact monopole antenna, measuring 70 × 60 × 1.6 mm3, designed for head imaging. The antenna boosts an operating bandwidth ranging from 1.35 to 3.51 GHz and a peak gain of 5.1 dBi at 3.5 GHz, all within a compact design. It delivers optimal performance in terms of reflection coefficient, gain, directivity, and efficiency, fulfilling the requirements for effective brain stroke detection and imaging.
The manuscript is organized as follows: The “Antenna development and evaluation” section presents the modeling and analysis of the antenna, including parametric, time, and frequency domain analyses. The “Head phantom with hemorrhage fabrication and performance assessment in the simulator” section covers the design and simulation of the stroke model, along with its E-field and H-field analyses. The “Hemorrhage modeling and imaging” section covers the fabrication of the stroke model and image reconstruction using the delay and sum (DAS) approach. The “Conclusion” section presents the final overview and conclusions of the research.
Antenna development and evaluation
The preliminary design of the monopole antenna was based on the core principles and equations that govern microstrip antennas. These antennas are notable for their low profile, compact size, and lightweight nature, occupying minimal space. The fabrication process is straightforward, which simplifies the overall production, making it both easy and cost-effective. Due to these economic advantages, microstrip antennas can be mass-produced using advanced modern printed circuit technologies. The initial antenna dimensions were calculated using Equations (1)–(3) [Reference Asok, Sowmya, Ummer Faisa, Fathima, Harikrishnan, Sumi and Dey29].
 \begin{equation}W_p = \frac{c}{{2{f_r}}}\sqrt {\frac{2}{{{\varepsilon _r} + 1}}} \end{equation}
 \begin{equation}{\varepsilon _{reff}} = \frac{{{\varepsilon _r} + 1}}{2} + \frac{{{\varepsilon _r} - 1}}{2}{\left[ {1 + 12\frac{h}{W}} \right]^{ - 1 / 2}}\end{equation}
 \begin{equation}{L_P} = \frac{c}{{2{f_r}\sqrt {{\varepsilon _{reff}}} }}\end{equation}
Here, fr stands for the design frequency, c is the speed of light, ϵr represents the permittivity of the substrate material, and h signifies the height of the substrate. For antenna design, especially in biomedical applications, it is crucial to ensure the antenna’s dimensions are compact. The design started with initial patch dimensions of 30 mm in width (Wp) and 25 mm in length (Lp), calculated using standard equations. Utilizing an FR-4 substrate with a thickness of 1.6 mm and a central frequency of 1.82 GHz, the design was optimized through several iterations to enhance bandwidth. This process resulted in evolving the antenna into a triple hollow rectangular patch, with final dimensions of Wp = 35 mm and Lp = 30 mm, tailored for optimal performance in medical imaging applications.
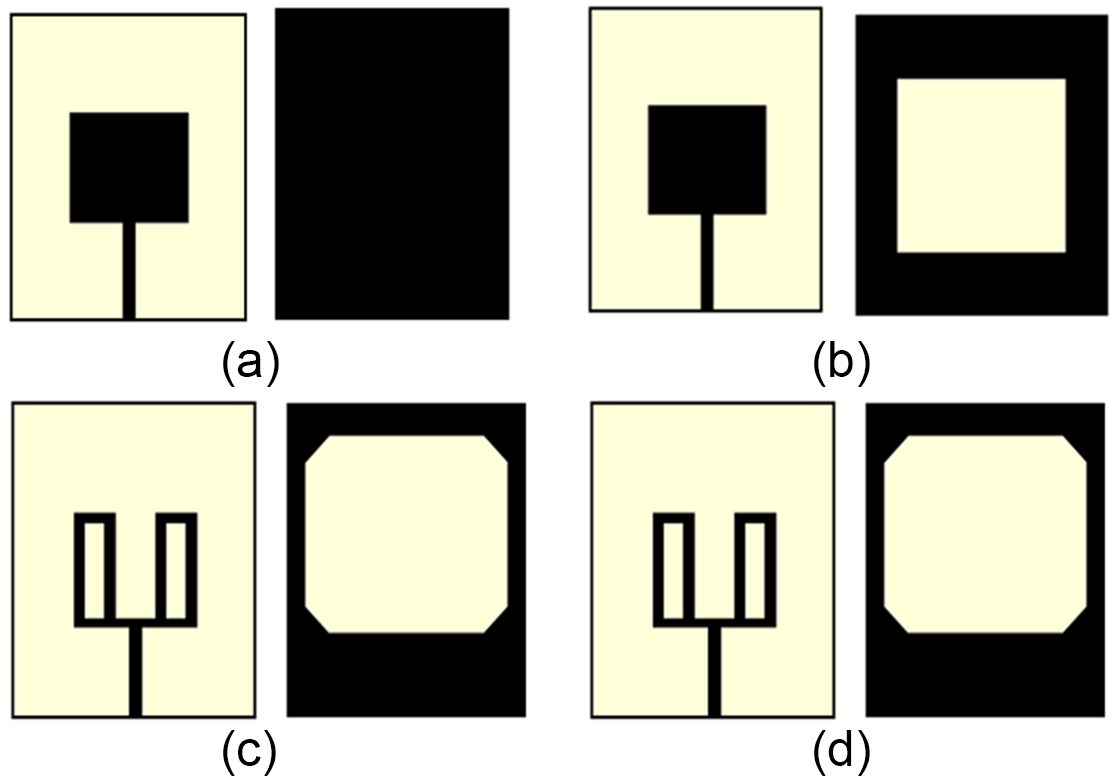
Figure 1(a–d) depicts the progression of design changes and the ultimate configuration of the proposed antenna. Initially, in stage 1, the design starts with a basic patch and a full ground plane as shown in Fig. 1(a). Next, in stage 2, a rectangular slot is carved into the ground plane, as depicted by Fig. 1(b). In stage 3, the ground plane corners are trimmed, and the patch is reshaped into a double hollow rectangular form, as shown in Fig. 1(c). Finally, in the last stage, the patch is further adjusted to create a triple hollow rectangular shape with a hexagonally slotted ground plane, as illustrated in Fig. 1(d).
The various stages in the development of the antenna design. (a) Stage 1, (b) stage 2, (c) stage 3, and (d) stage 4.

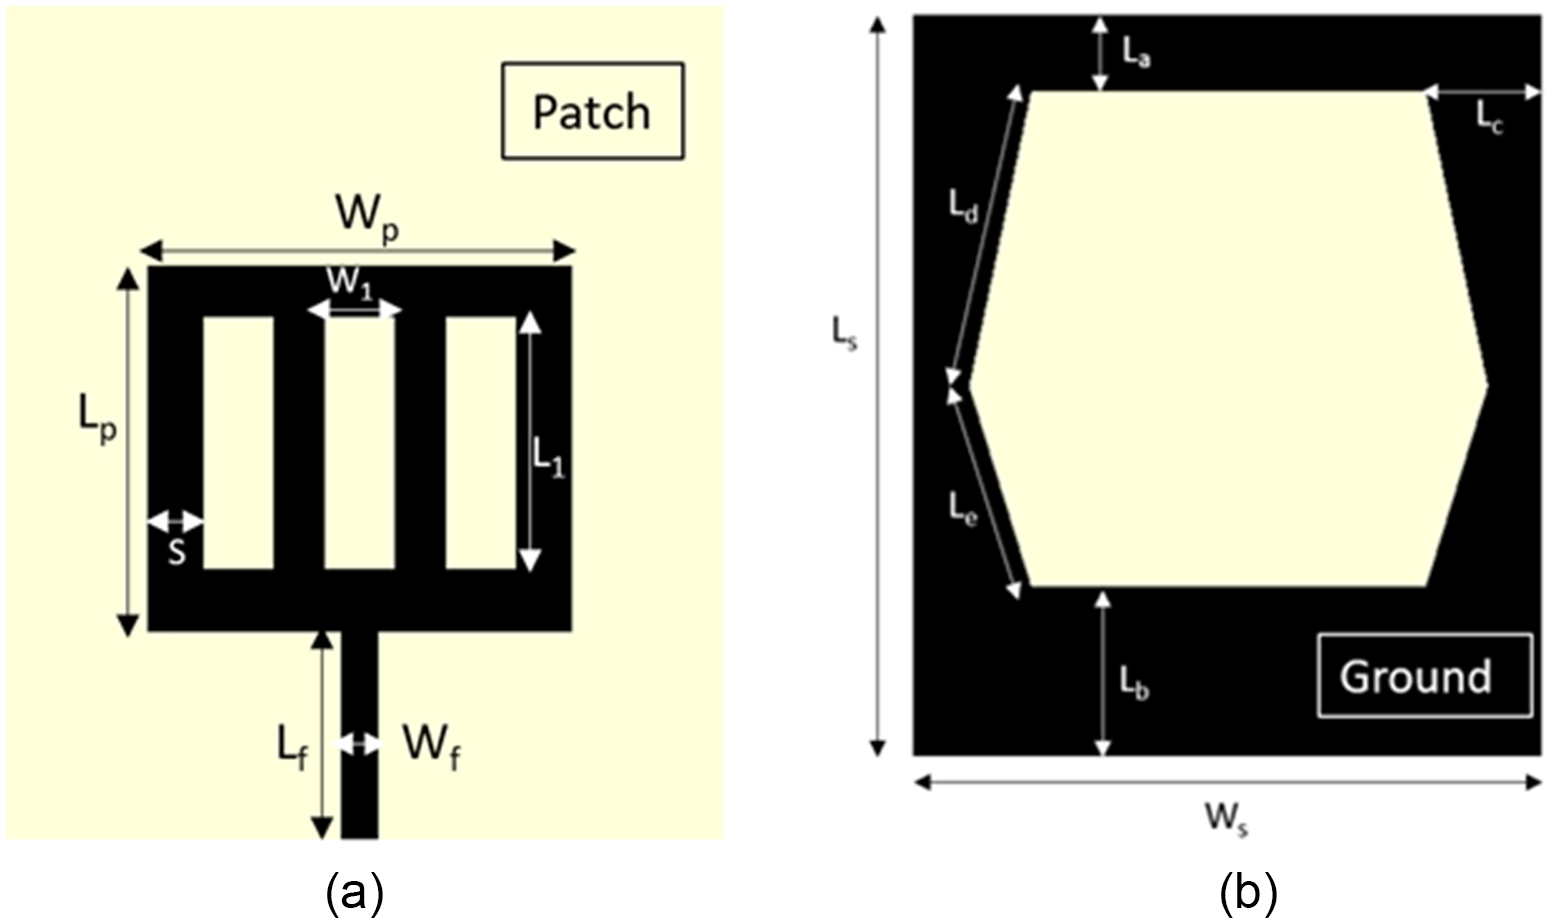
Figure 2 depicts the geometrical construction of the antenna with parameter specifications. The CST Microwave Studio 2016 simulator refines the antenna parameters to achieve optimal bandwidth, gain, and performance necessary for biomedical applications. Table 1 details the key dimensions and parameters of the suggested antenna design. The parameters are adjusted to meet the required operating bandwidth, gain, and radiation pattern. Here, Ls and Ws refer to the antenna’s length and width, respectively, while Lp and Wp denote the triple hollow rectangular patch’s length and width. L 1 and W 1 represent the length and width of the patch arms, respectively, and S denotes the edge width of the hollow patch. The bottom surface is designed as a slotted full ground plane. The breadth of the upper and lower edges of the ground plane are indicated as La and Lb, respectively, while the lateral edge width is represented by Lc. Additionally, Ld and Le specify the dimensions of the hexagonal slots relative to the ground plane.
The configuration of the suggested antenna. (a) Frontal view and (b) rear view.

The specifications of the suggested antenna

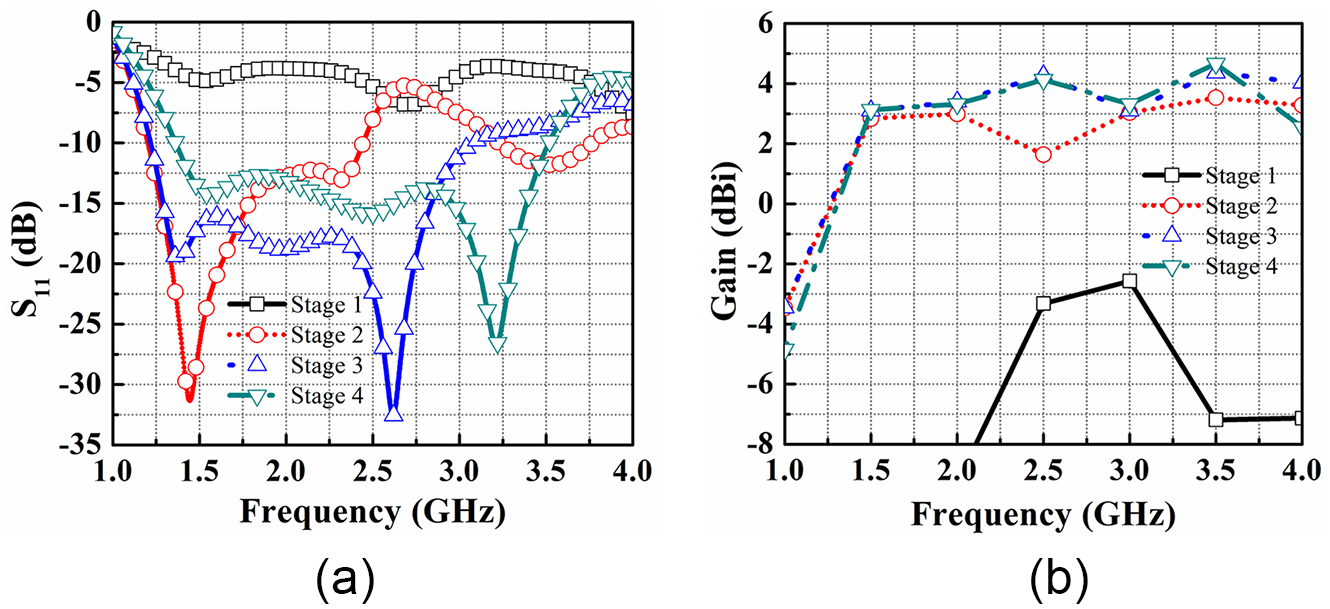
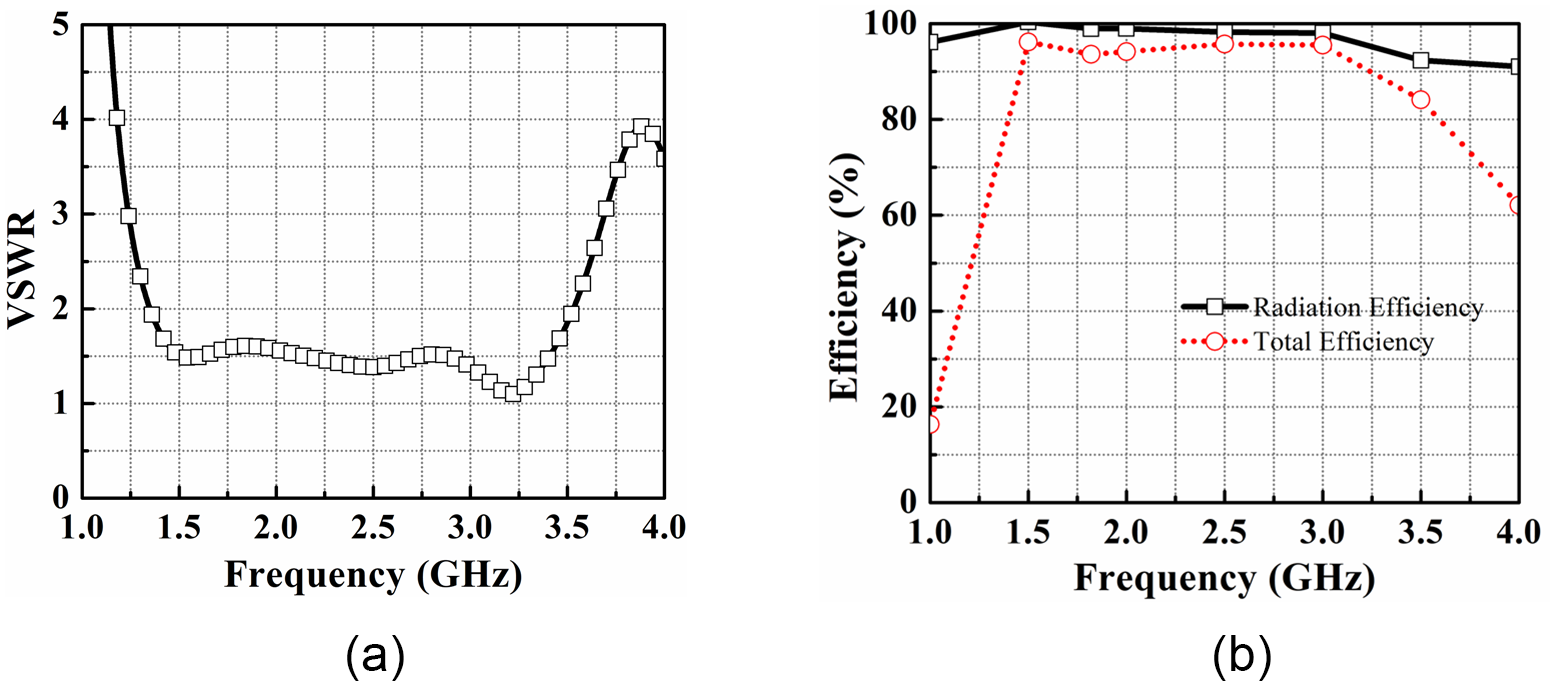
Figure 3(a) shows the antenna’s return loss at various development stages, culminating in the final design. In stage 1, the design incorporating a square patch along with a complete ground plane did not achieve a −10 dB operating band due to the impedance mismatch and the poor coupling between the patch and the underlying ground plane. In stage 2, the design with a standard patch and perforated ground plane resonated at around 1.44 GHz, covering 1.2–2.4 GHz. For head imaging, the antenna needs a 1–4 GHz bandwidth and higher gain. Given the effective operating band of the slotted ground design, the slotted patch was selected for further optimization. Refining the shape of the patch and base plane in this way significantly enhances the antenna’s performance, resulting in a broader bandwidth within the desired frequency range. To further increase the bandwidth, additional design modifications were made. In the final stage, the patch was adjusted to create a triple hollow rectangular shape with a hexagonally slotted ground plane. By integrating these design modifications, the suggested antenna resulted in a broad frequency range from 1.35 to 3.51 GHz. Figure 3(b) effectively shows how each adjustment influences the antenna’s total performance, especially regarding gain across the operating frequency range. The initial design (stage 1), featuring a standard patch and a complete ground plane, exhibited significantly low gain performance. In stages 2 and 3, the configurations featuring a standard patch with a slotted ground plane and a double-sided slotted patch with a slotted base achieved maximum gains of 3.5 and 4.3 dBi, respectively. The antenna design in stage 4 reached a maximum gain of 5.1 dBi, with its VSWR and radiation efficiency depicted in Fig. 4. Figure 4(a) illustrates the VSWR plot for the device. The radiation efficiency is depicted in Fig. 4(b), where it is shown that the peak radiation efficiency reaches approximately 98.88%.
(a) The return loss and (b) gain across various design stages.

The simulated (a) VSWR and (b) efficiency of the proposed antenna.

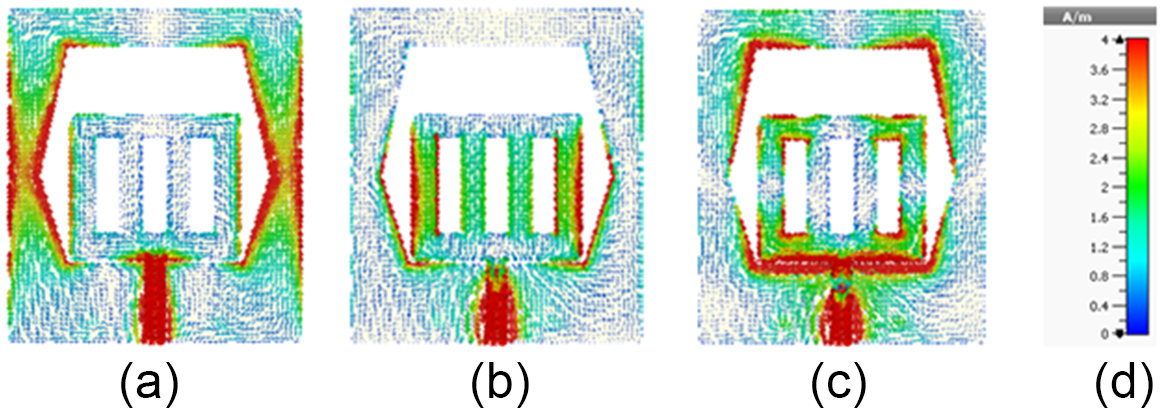
Figure 5 provides a clear depiction of the antenna’s surface current distribution. Specifically, Fig. 5(a) depicts the current flow pattern at 1.5 GHz, where currents are primarily concentrated around the feed area and the inner and outer edges of the ground plane. The currents in this section create resonance at 1.5 GHz. Figure 5(b) displays the surface current flow pattern at 2.5 GHz, where the current is predominantly focused around the feed area and along the edges of the triple hollow slot. This length causes the resonance at 2.5 GHz. Finally, Fig. 5(c) shows the surface current flow pattern at 3.2 GHz. It is evident that the current is primarily concentrated around the upper and lower edges of the ground plane and close to the feed area, resulting in resonance at 3.2 GHz.
The distribution of surface currents at (a) 1.5 GHz, (b) 2.5 GHz, and (c) 3.2 GHz. (d) Illustrates the scaling.

Parametric analysis
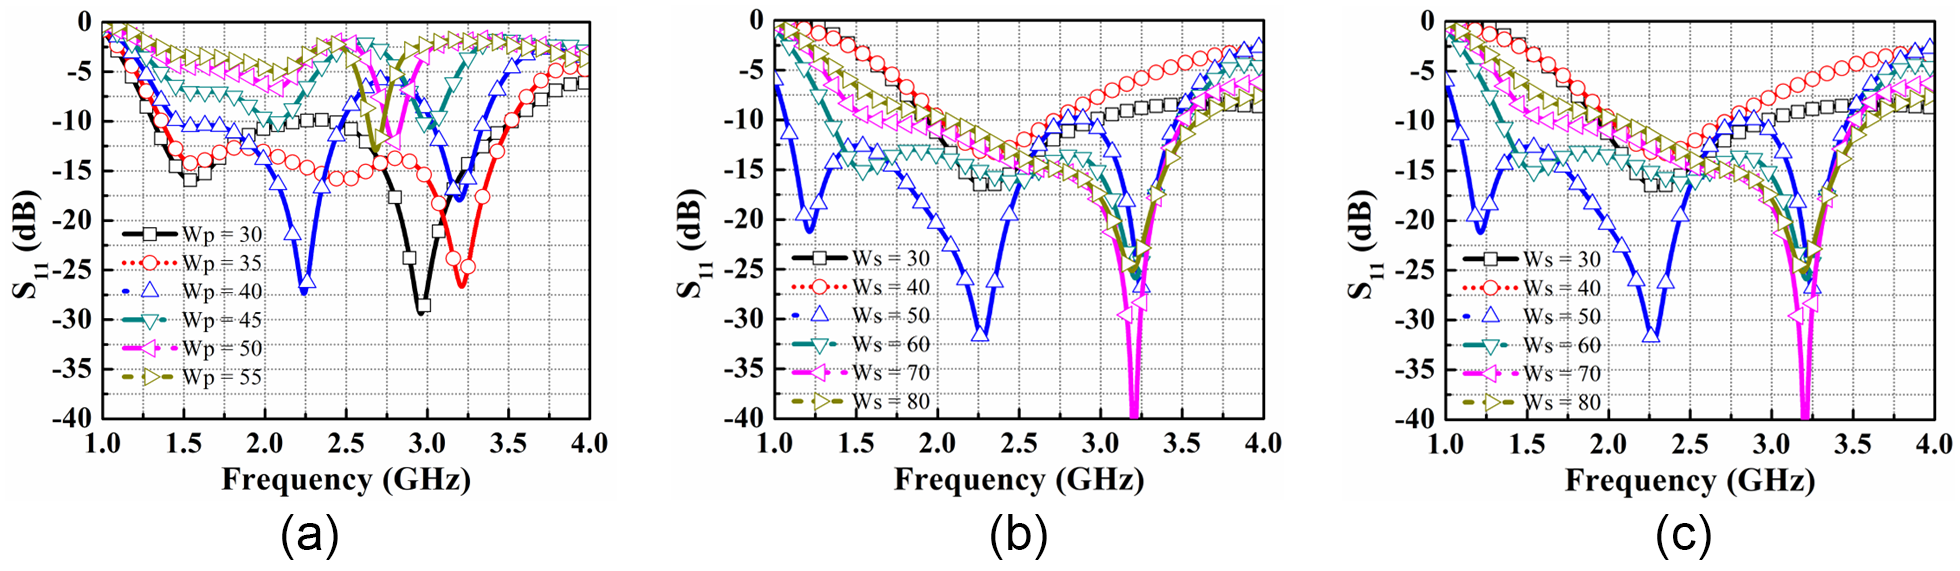
The return loss variation in Fig. 6 delineates the iterative refinement process undergone by the prototype. The reflection coefficient will serve as the main metric for assessing different parameter values. Figure 6(a) illustrates the simulation results for varying the patch width parameter, Wp. Optimal performance is observed at Wp = 35 mm, within the range of 30–55 mm. Figure 6(b) demonstrates how changing the width of the substrate, Ws, affects the antenna performance. The parameter Ws is varied from 30 to 80 mm, and the best result is obtained at Ws = 60 mm. Next, Fig. 6(c) shows the effect of changing the width of the feed line of the antenna, denoted as Wf. The optimal performance is achieved at Wf = 3 mm within the range of 3–3.5 mm.
The return loss variation due to (a) Wp, (b) Ws, and (c) Wf for different lengths.

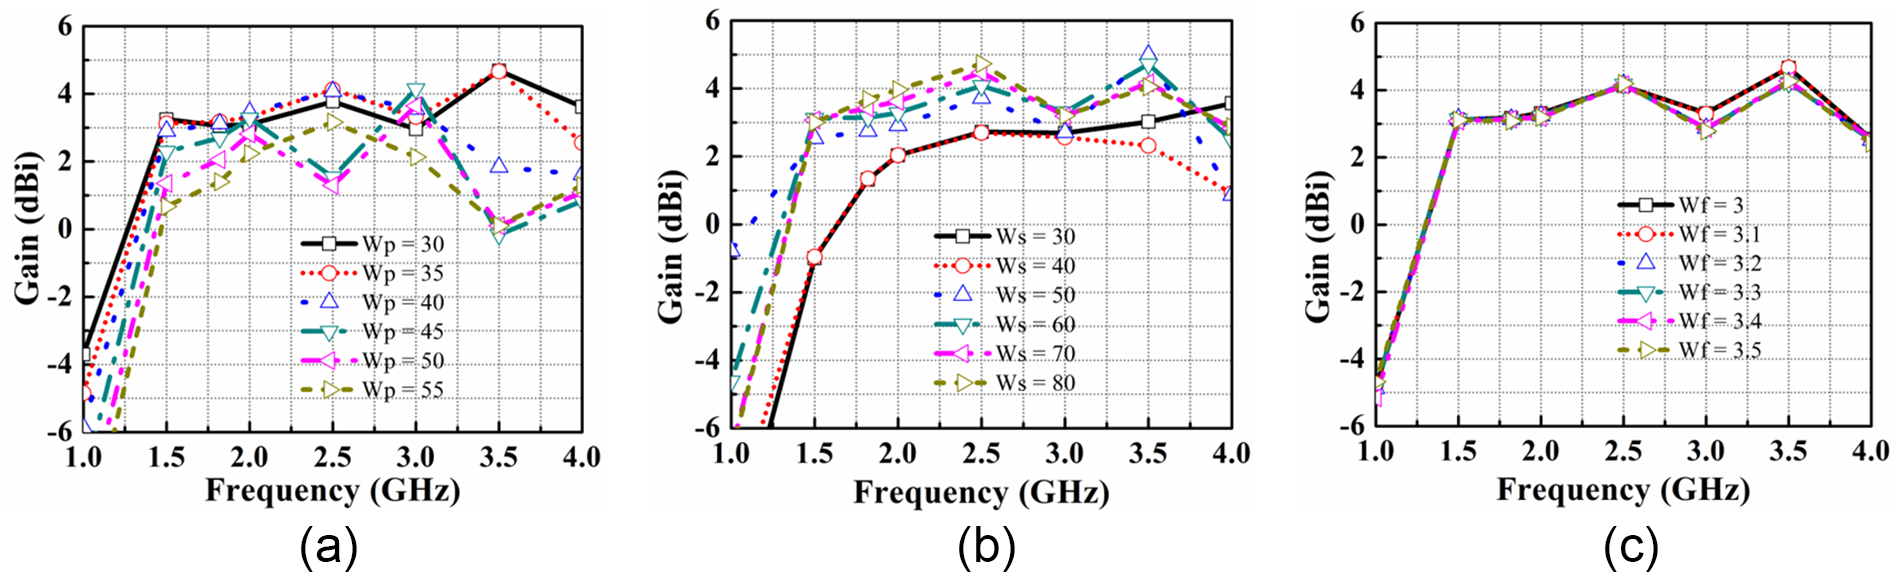
Figure 7 shows how gain performance changes with adjustments in design parameters, such as Wp, Ws, and Wf. Figure 7(a) demonstrates the impact of varying Wp from 30 to 55 mm, indicating that maximum gain is attained at Wp = 35 mm. Figure 7(b) reveals how adjustments to Ws affect the gain performance from 30 to 80 mm, with the optimal gain achieved at 60 mm. Subsequently, Fig. 7(c) illustrates the influence of altering Wf, showing that optimal gain performance is achieved at Wf = 3 mm within the range of 3–3.5 mm.
The gain variation due to (a) Wp, (b) Ws, and (c) Wf for different lengths.

Therefore, the suggested antenna has undergone parametric analysis using the CST simulation tool, and optimal performance parameters have been achieved, making the antenna suitable for head imaging applications.
Fabricated antenna and frequency domain analysis
The research aims to develop an optimized antenna for brain stroke detection. Initially, the suggested antenna undergoes simulation before testing with the head model. Scattering parameters, notably S 11, gauge the reflected power. Additionally, parameters like VSWR, efficiency, radiation pattern, and current distribution are examined. Antenna gains, indicating signal transmission strength in specific directions, are also evaluated. This comprehensive analysis ensures the antenna’s effectiveness in brain stroke applications, contributing to improved diagnostic accuracy.
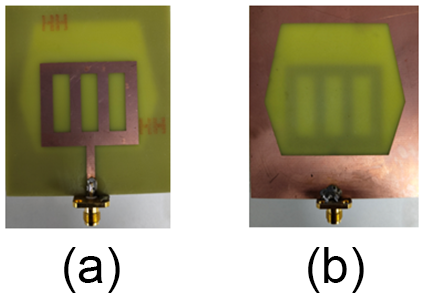
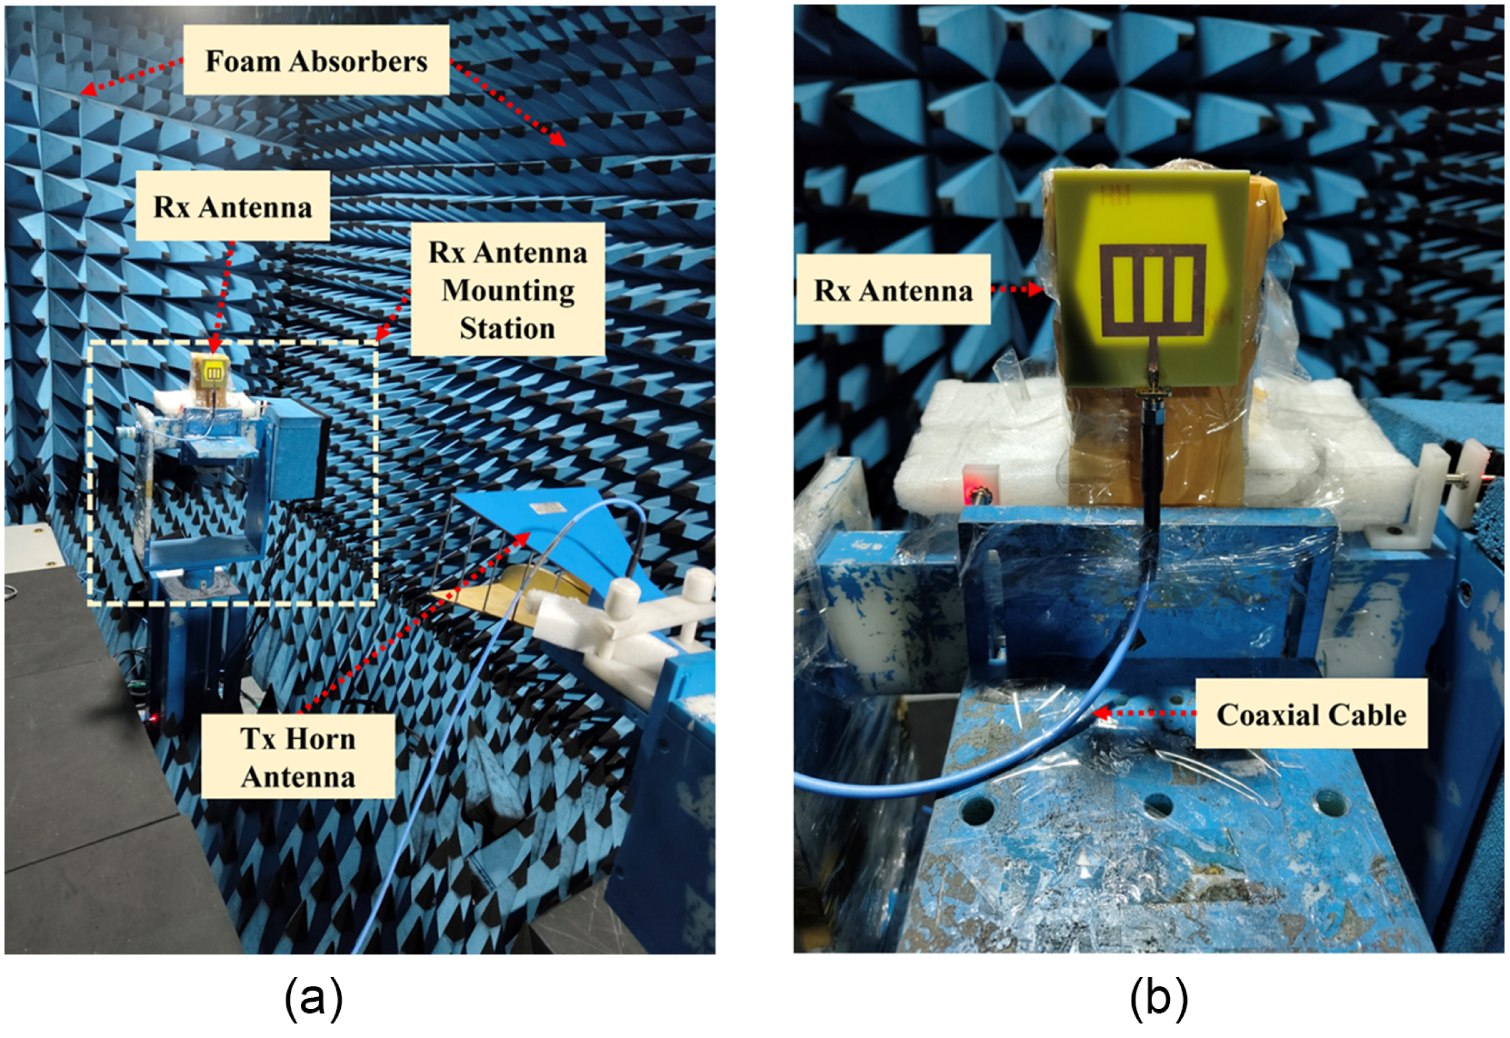
Figure 8 displays the manufactured antenna, with Fig. 8(a) presenting the front view and Fig. 8(b) showing the rear view. The antenna is assembled on an FR-4 substrate, characterized by a thickness of 1.6 mm, a dielectric constant of 4.4, and a loss tangent of 0.025. The testing of the antenna was carried out in an anechoic chamber, as outlined in Fig. 9. Figure 9(a) presents the overall antenna measurement setup, illustrating the transmitting horn antenna as well as the surrounding foam absorbers, while Fig. 9(b) provides a magnified view of the antenna’s arrangement, highlighting its configuration and setup in the testing environment.
The fabricated antenna structure. (a) The front view and (b) the rear view.

The antenna testing configuration. (a) The entire setup and (b) the zoomed-in view of the antenna.

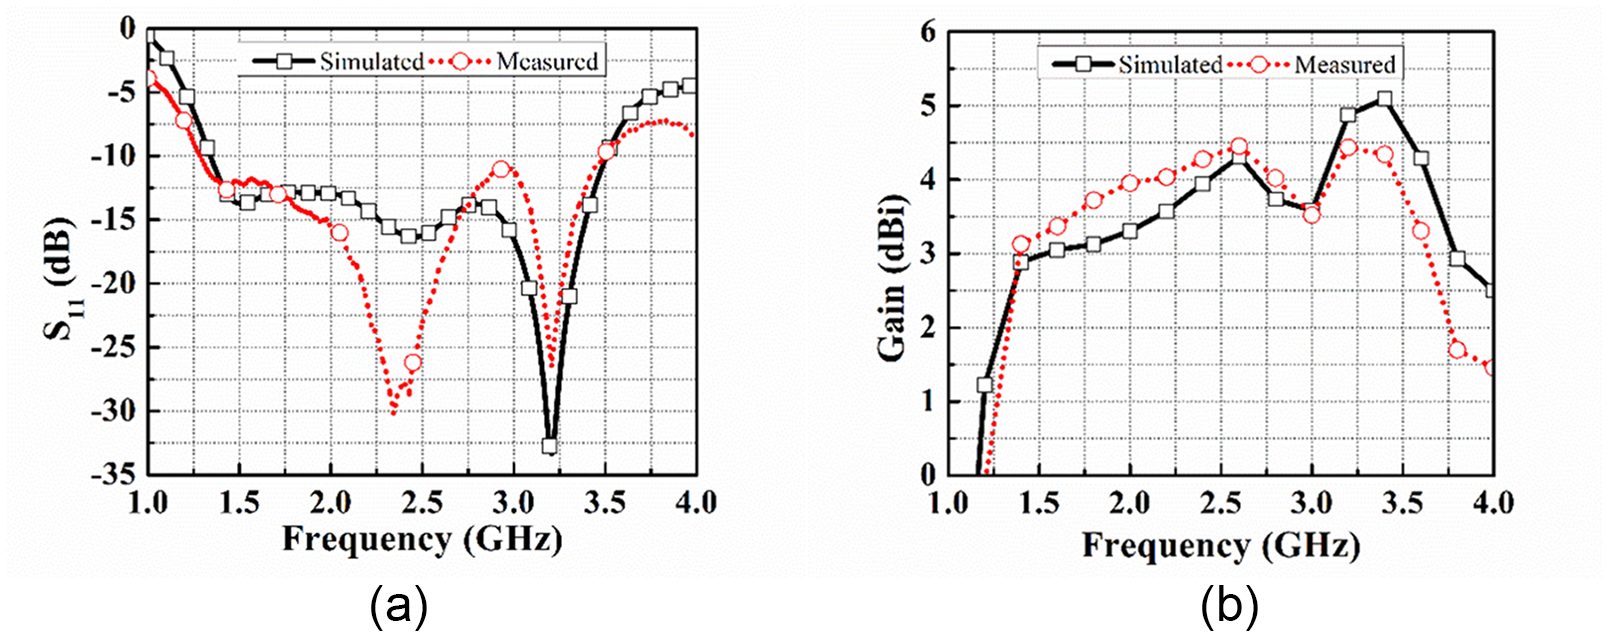
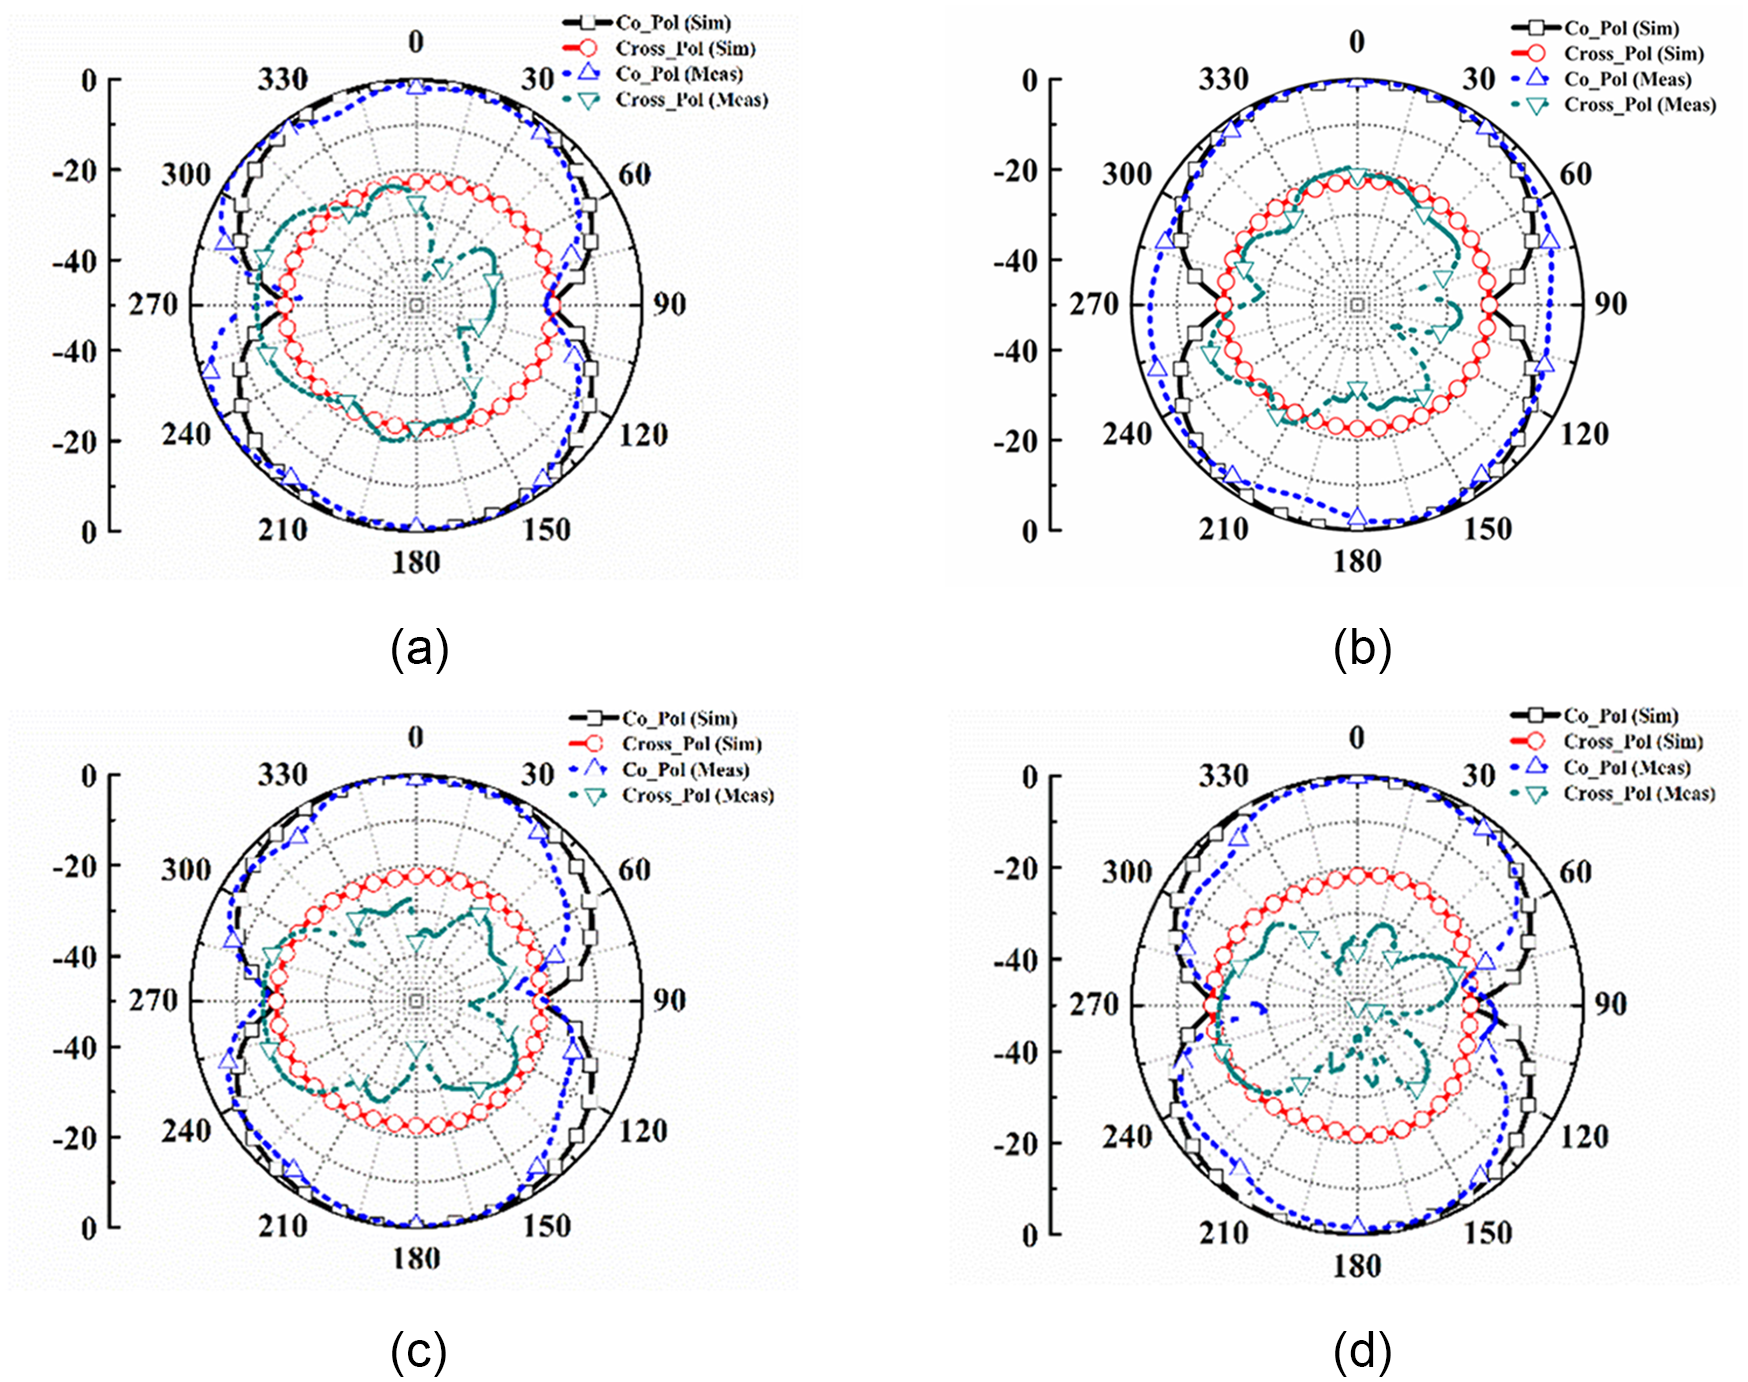
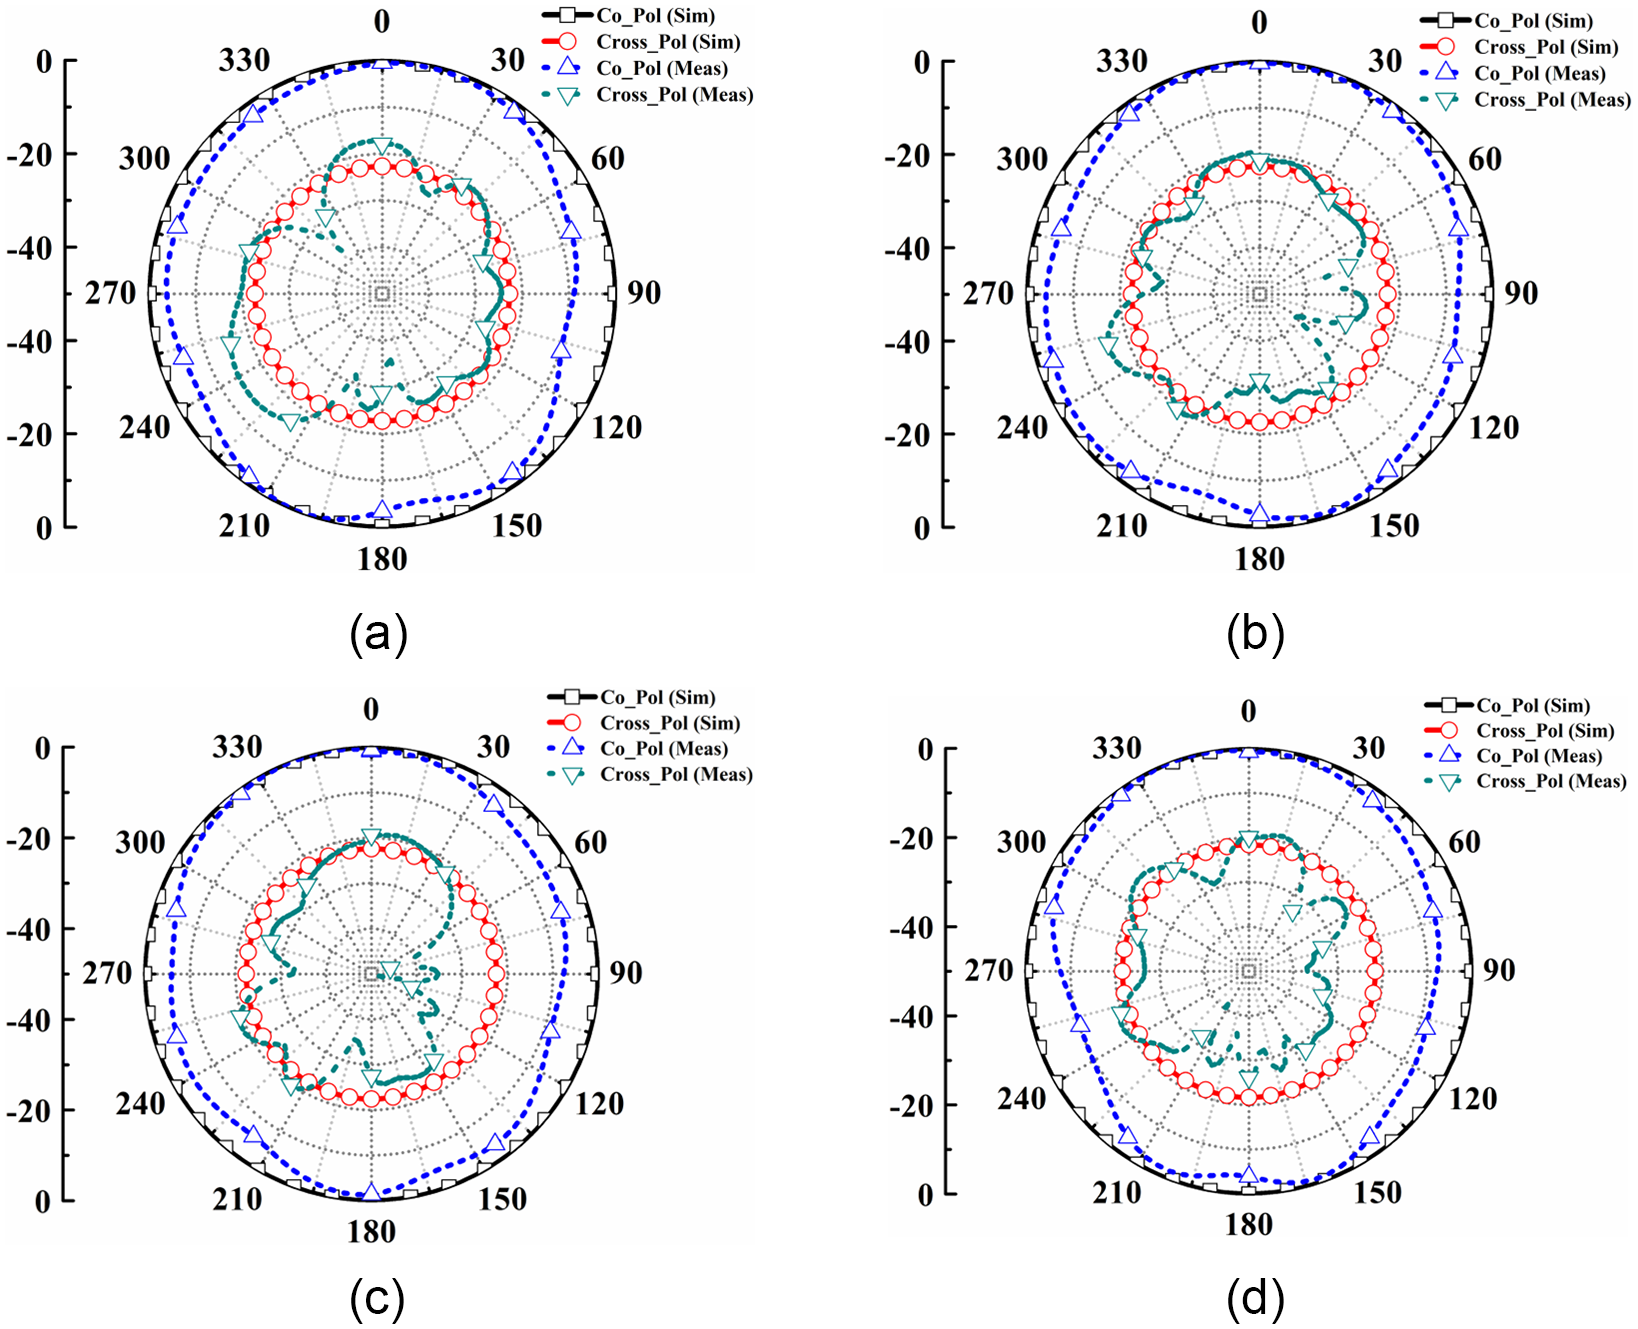
Figure 10(a) displays the return loss plot for the suggested antenna, comparing simulated and experimental results. The simulated and experimental responses show strong agreement, with the antenna showing a return loss of over 10 dB across the frequency range from 1.35 to 3.51 GHz. Figure 10(b) shows the antenna’s gain performance, comparing the results from simulations with those obtained from experiments. The data reveal a close match between the simulated and experimental gains, with the antenna achieving a peak gain of 5.1 dBi. The radiation pattern of the suggested antenna has been plotted and examined at different frequencies within its broadband range. Figure 11 displays the E-plane radiation pattern of the suggested antenna, comparing simulated and experimental results. The figure shows the radiation pattern at frequencies of (a) 1.5 GHz, (b) 1.75 GHz, (c) 2 GHz, and (d) 2.25 GHz. Both simulated and experimental responses are consistent, as shown. Furthermore, Fig. 12 presents the radiation pattern in the H-plane of the suggested antenna at these aforementioned frequencies. It can be observed that the simulated and actual results align closely. Minor differences between the simulated and experimental responses are attributed to soldering, coaxial cable, and connector losses.
The measured vs simulated response. (a) Return loss and (b) gain.

The E-plane radiation pattern of the suggested antenna at (a) 1.5 GHz, (b) 1.75 GHz, (c) 2 GHz, and (d) 2.25 GHz.

The H-plane radiation pattern of the suggested antenna at (a) 1.5 GHz, (b) 1.75 GHz, (c) 2 GHz, and (d) 2.25 GHz.

Time domain analysis
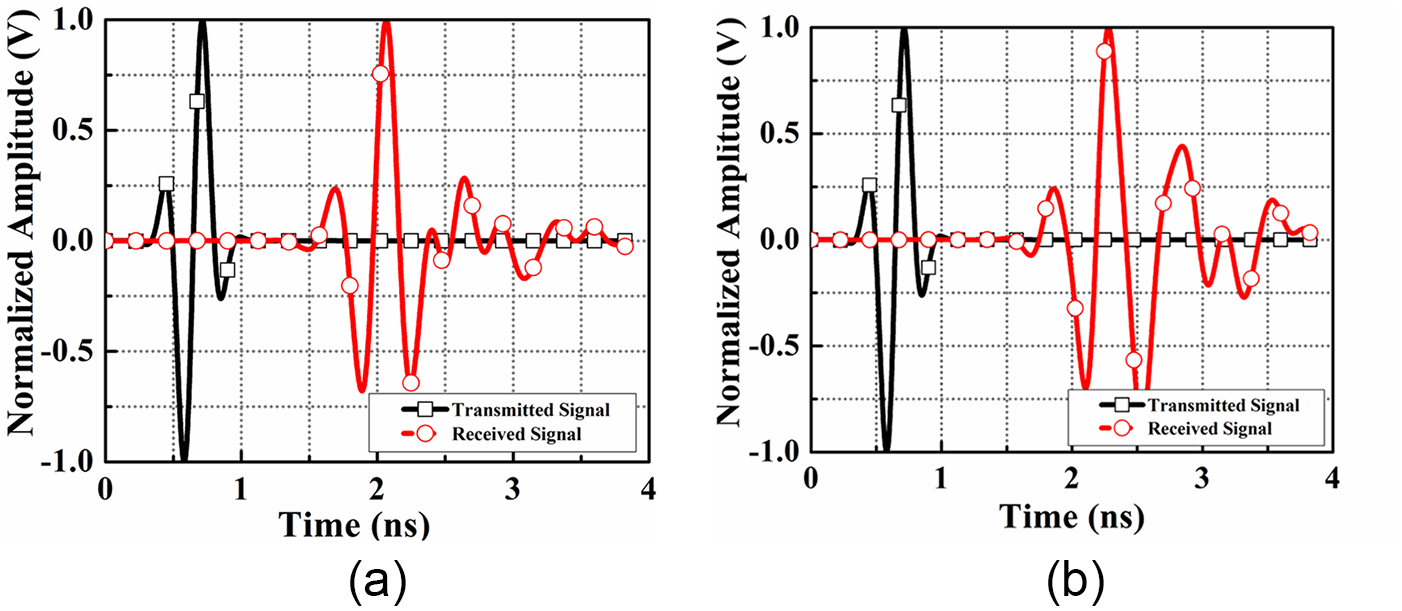
A comprehensive analysis of the antenna’s time-domain characteristics was conducted to assess its suitability for MWI. This included assessing transmitted and received signals, as well as metrics such as fidelity factor (FF) and group delay. The evaluations were conducted with two setups: face-to-face and lateral, with a 200 mm separation between the antennas in each configuration. Figure 13(a) depicts the normalized magnitude for the face-to-face arrangement, and Fig. 13(b) shows it for the lateral arrangement. The face-to-face configuration demonstrates better signal alignment and stronger guided radiation compared to the lateral setup, making it more effective for brain stroke imaging applications.
Normalized magnitude plots of the transmitted and received signals are shown for (a) face-to-face configuration and (b) lateral configuration.

Equation (4) is used to assess the cross-correlation between the transmitted and received signals, a measure known as the FF [Reference Talukder, Samsuzzaman, Islam, Azim, Mahmud and Islam30]. This factor quantifies the degree of similarity and accuracy between the two signals.
 \begin{equation}FF = max_{\tau} \left| \frac{{\smallint \nolimits_{ - \infty }^{ + \infty } s\left( t \right)r\left( {t\, - \,\tau } \right)dt}}{{ \smallint \nolimits_{ - \infty }^{ + \infty } s{{\left( t \right)}^2}. \smallint \nolimits_{ - \infty }^{ + \infty } r{{\left( t \right)}^2}dt\,}} \right|\end{equation}
In this analysis, s(t) and r(t) correspond to the transmitted and received signals, respectively, and τ represents the group delay. The FF measurements show 76.9% for the face-to-face configuration and 59.8% for the lateral configuration. The high FF value for the face-to-face arrangement indicates that the transmitted signal is minimally distorted in this setup. This indicates that the arrangement effectively preserves the integrity of the transmitted signal, resulting in a clearer and more accurate reception.
Another important aspect in assessing the antenna’s time-domain performance is the group delay, which reflects the phase distortion of the signal. Defined as the negative rate of change of the phase of the transfer function, φ(ω), with respect to frequency [Reference Talukder, Samsuzzaman, Islam, Azim, Mahmud and Islam30]. The group delay estimates the duration a signal requires to traverse the antenna. It is determined using equation (5), as shown below:
 \begin{equation}\tau \left( \omega \right) = - \frac{{{\text{d}\varphi }\left( {{\omega }} \right)}}{{{\text{d}\omega }}} = - \frac{{{\text{d}\varphi }\left( {{\omega }} \right)}}{{2\pi df}}\end{equation}
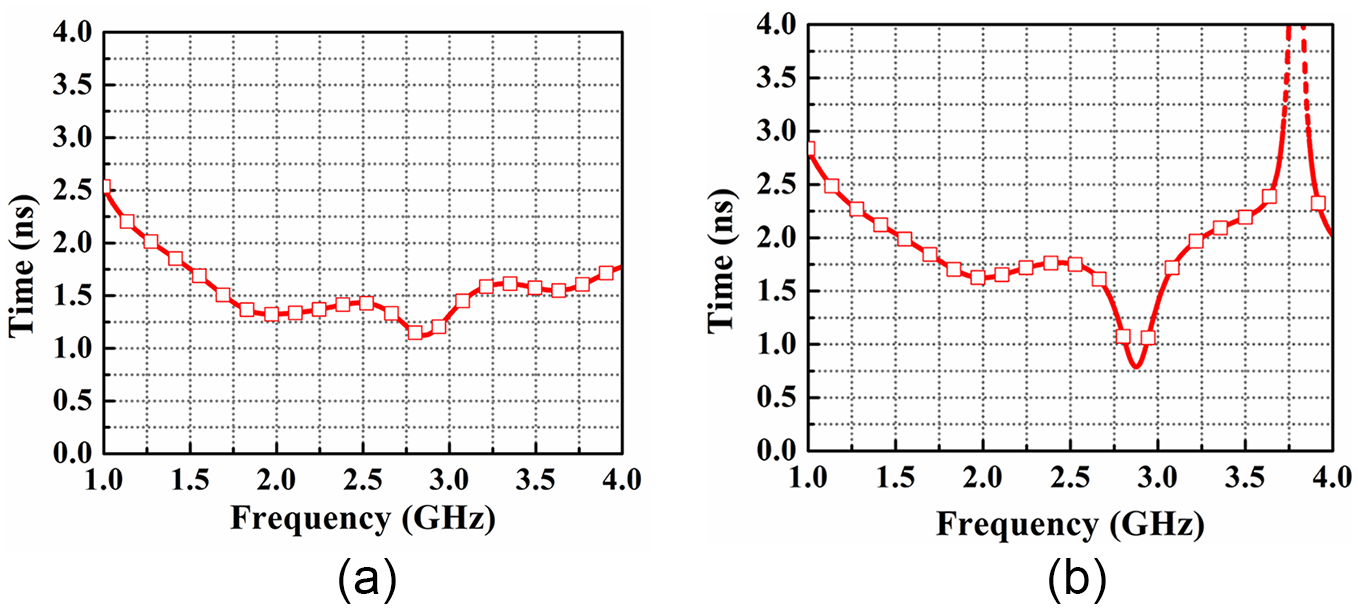
For wideband applications, a consistent group delay response is vital to preserve signal quality. Figure 14 shows the measured group delay for the proposed antenna across two different setups. The face-to-face setup maintains group delay variations within 1.6 ns, indicating stable performance, while the lateral configuration exhibits significant distortion, affecting signal quality. Thus, for brain stroke detection, the face-to-face configuration is preferred due to its improved accuracy and consistency.
The simulations of group delay for (a) the face-to-face configuration and (b) the lateral configuration.

Head phantom with hemorrhage fabrication and performance assessment in the simulator
Head phantom with hemorrhage fabrication in the simulator
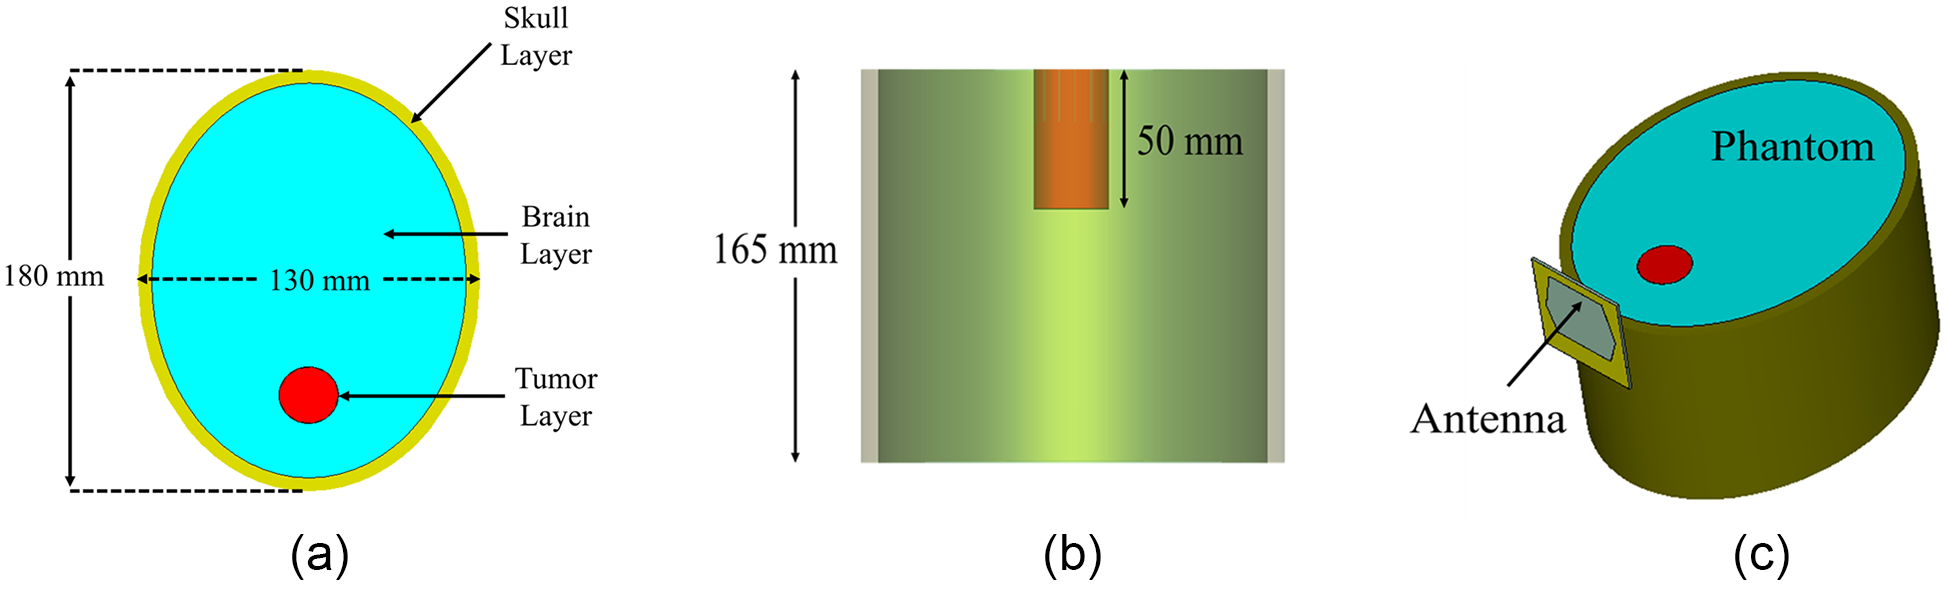
To check the signal penetration in the brain, an appropriate model has been made in the simulator. The designed model consists of an elliptical structure with two layers. The outer layer is the skull layer with a thickness of 7 mm, and within the skull layer, a material of dielectric constant 44 is placed, depicting the brain layer. Within the brain layer, a cylinder of radius 15 mm and depth of 50 mm is placed, depicting the hemorrhage model. All the different views of the phantom model have been depicted in Fig. 15. The designed setup has been utilized to perform various analyses of the antenna to ultimately enable the detection of brain hemorrhages.
The modeled labeled head model in the simulator. (a) Top view, (b) side view, and (c) perspective view.

E-field and H-field analysis
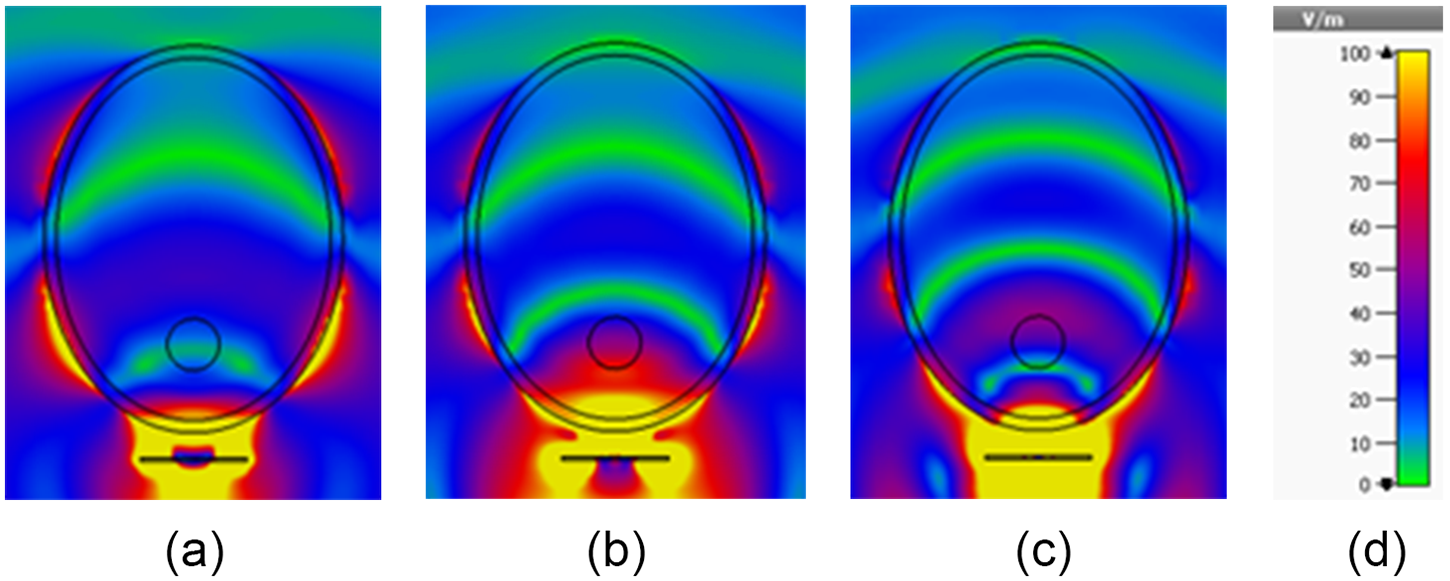
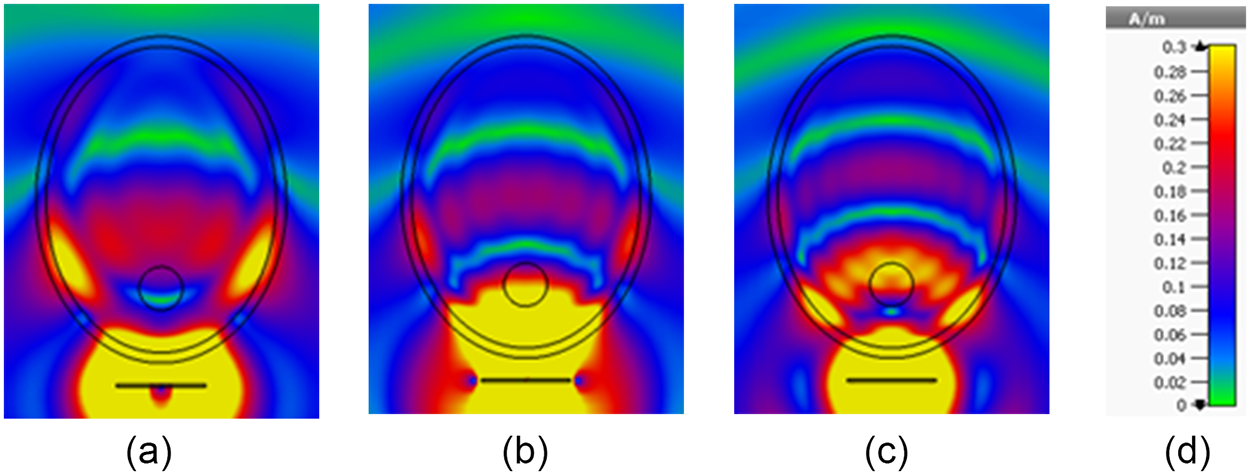
An in-depth study of how the electric field (E-field) and magnetic field (H-field) penetrate materials was conducted to thoroughly evaluate the antenna’s performance for MWI. Figure 16(a–c) displays the penetration of the E-field through the YZ-plane of the modeled hemorrhage model at 1.5, 2, and 2.5 GHz. These visuals demonstrate that the E-field penetrates the model thoroughly, reaching substantial depths at each frequency. Figure 17(a–c) shows H-field penetration at the same frequencies. While H-field intensity decreases due to the lossy nature of the model, the antenna’s directional propagation enhances field infiltration. This comprehensive analysis confirms the antenna’s capability to penetrate the model effectively, which is essential for capturing critical information for accurate hemorrhage imaging. The antenna’s strong electromagnetic field penetration across various frequencies is crucial for high-quality MWI applications, ensuring effective imaging and diagnostic capability.
The distribution of the electric field produced by the antenna with the hemorrhage model at (a) 1.5 GHz, (b) 2 GHz, and (c) 2.5 GHz. The scaling is provided in (d).

The distribution of the magnetic field produced by the antenna with the hemorrhage model at (a) 1.5 GHz, (b) 2 GHz, and (c) 2.5 GHz. The scaling is provided in (d).

Hemorrhage modeling and imaging
Hemorrhage modeling
To experimentally validate microwave-based detection of brain hemorrhage using antennas, a realistic phantom is required. The phantom fabricated in this study closely replicates the physical shape of the human head. The outer layer of the phantom is made of an artificial skull made from fiberglass material. Inside the skull cavity, a mixture simulating both gray and white matter fills the space (an average conductivity of 1.01 S/m and a permittivity of 44 at 1.6 GHz [Reference Sohani, Khalesi, Ghavami, Ghavami, Dudley, Rahmani and Tiberi28]). To model a brain hemorrhage, a cylindrical structure containing blood-equivalent material (a conductivity of 1.79 S/m and a permittivity of 60 at 1.6 GHz [Reference Sohani, Khalesi, Ghavami, Ghavami, Dudley, Rahmani and Tiberi28]) is embedded within the gray and white matter layer. The dielectric properties of each layer are summarized by Sohani et al. [Reference Sohani, Khalesi, Ghavami, Ghavami, Dudley, Rahmani and Tiberi28].
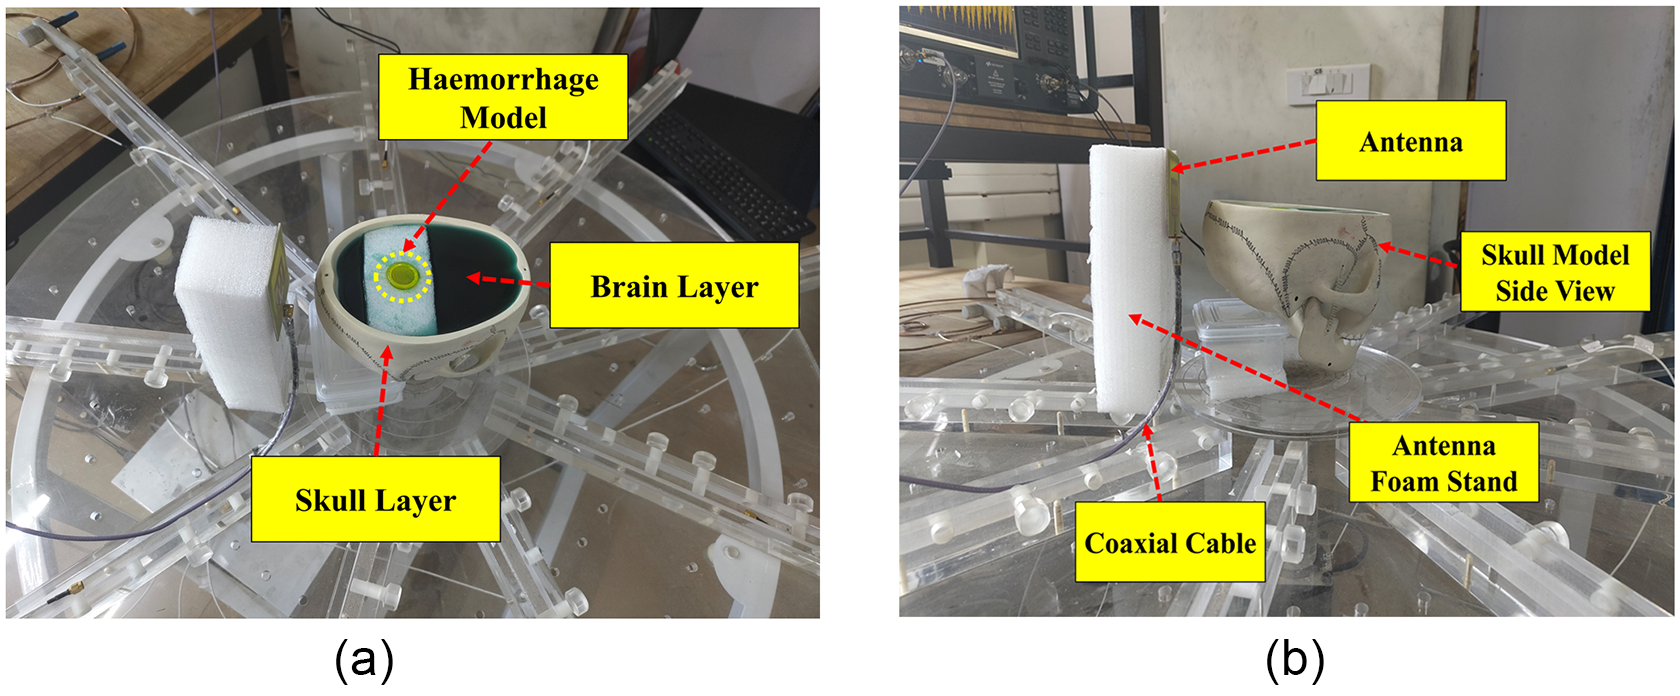
The top view of the skull has an ellipsoidal shape, with horizontal axial diameters of 130 mm (side to side) and 180 mm (front to back) and a height of 165 mm from the table. The brain mold is poured into the cavity present inside the skull model. A small tube containing blood-equivalent material, with a circular cross-sectional diameter of 30 mm and a depth of 50 mm, is positioned inside the brain mold. Figure 18(a) shows the top view of the phantom model with the brain and hemorrhage layers, while Fig. 18(b) illustrates the side view of the developed head model.
The fabricated hemorrhage model. (a) The phantom top view and (b) the phantom side view.

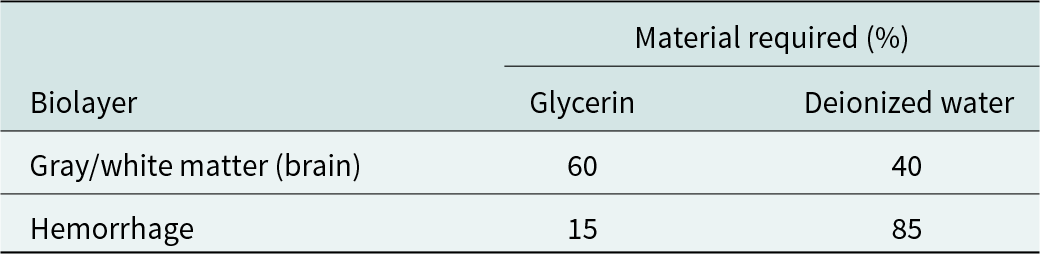
To accurately replicate the dielectric properties of the head and hemorrhagic stroke tissues, various materials were selected based on their similarity to reported values. The materials used were chosen not only for their dielectric relevance but also for their affordability, accessibility, and long-term stability. Each layer of the phantom (brain layer and hemorrhage layer) was fabricated using specific mixtures of constituent materials, as detailed in Table 2. To create the brain-mimicking tissue, a combination of 40% deionized water and 60% glycerin was used to replicate brain tissue properties. The glycerin and deionized water were stirred to ensure thorough blending and then poured into the skull model. For the blood-mimicking tissue, a mixture of 85% glycerin and 15% deionized water was prepared to simulate blood properties. After thorough mixing, it was poured into the cylinder-shaped structure representing the hemorrhage. The fabrication process ensures that the mixtures achieve the required dielectric properties for accurate simulation. After embedding the various layers in the head model, the phantom is placed in the imaging setup to clearly image the hemorrhage embedded inside the brain layer of the head phantom.
Tissue-mimicking materials

Imaging of the hemorrhage model
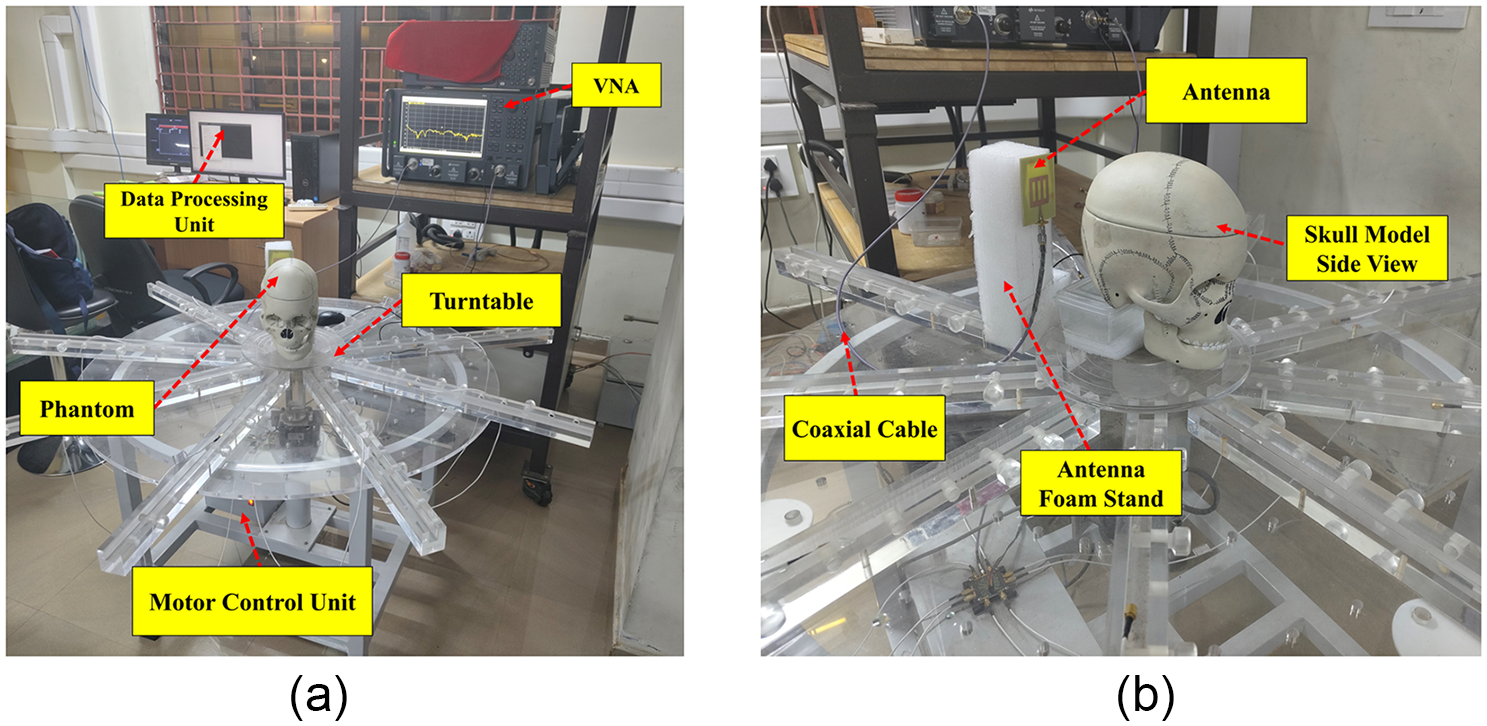
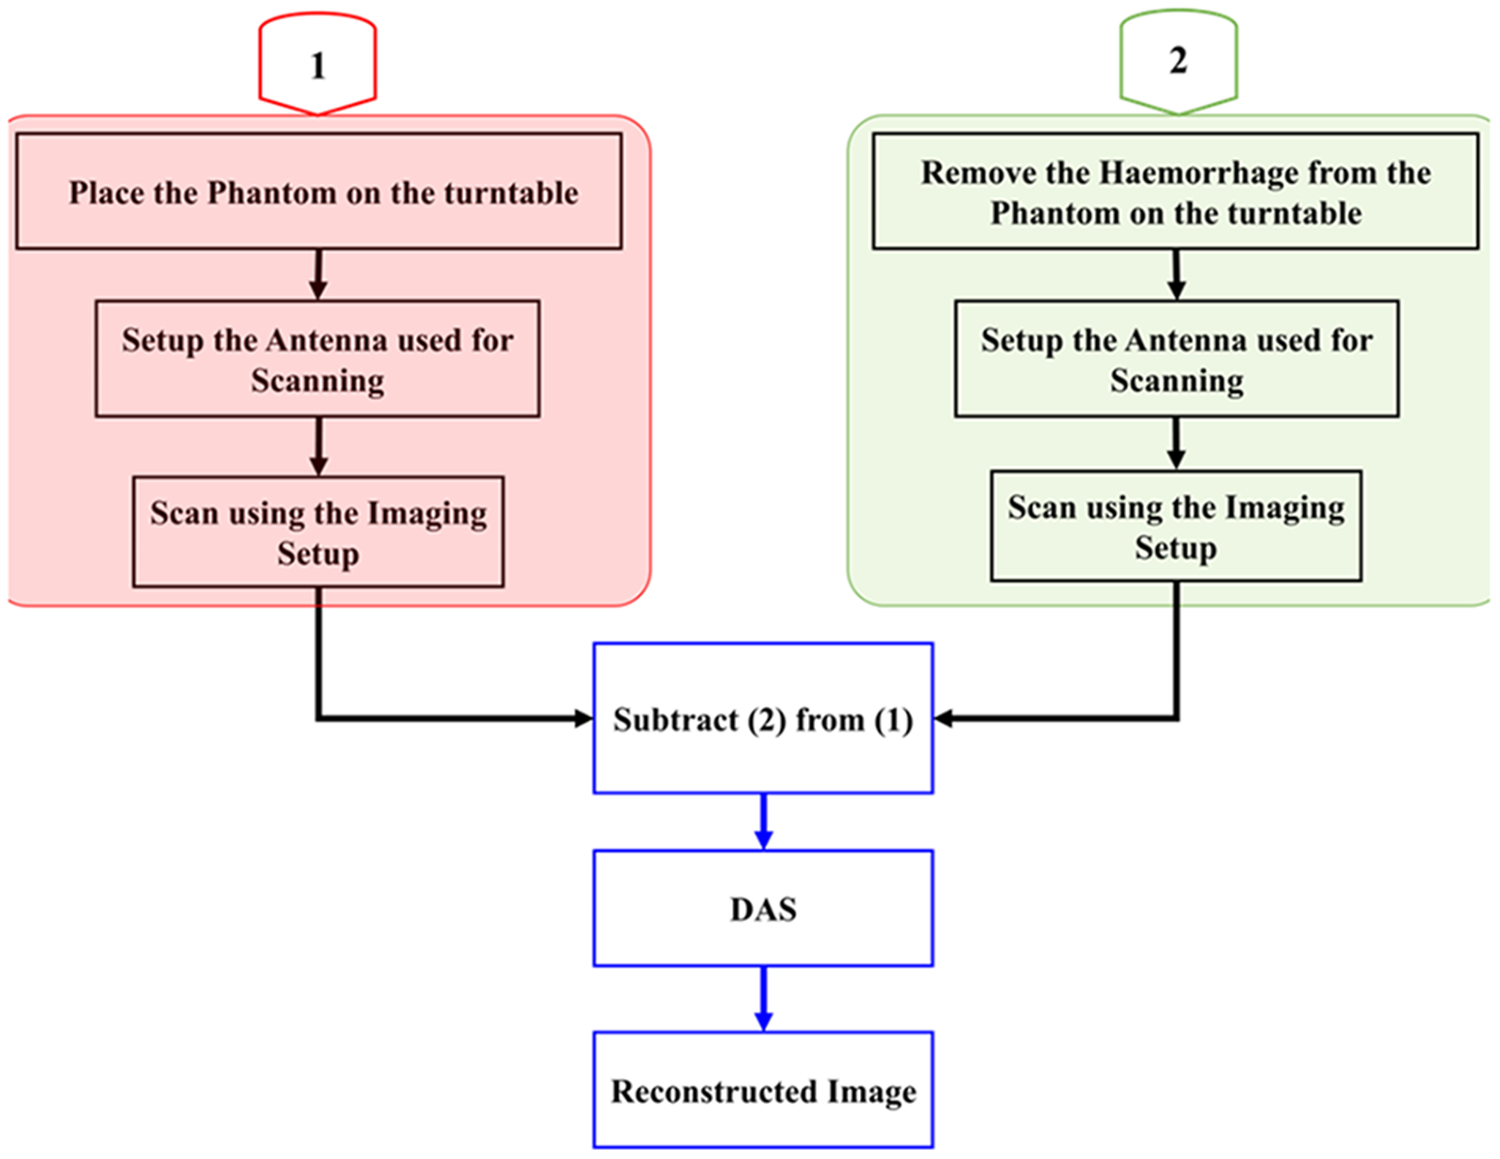
Figure 19 depicts the imaging setup used in this study, employing a monostatic approach for image reconstruction. The target is positioned on a turntable and rotated in 40-degree increments. This configuration yields nine measurements per rotation from the vector network analyzer (VNA), which are subsequently captured by the attached computer. After this scanning, the hemorrhage model is removed from the brain layer, and again a similar scanning is done. The antenna functions as both the transmitter and the receiver. Data from the frequency domain, acquired during each rotation from the VNA, are converted to the time domain. After this clutter removal procedure is done, the data obtained without the hemorrhage model are subtracted from the data with the hemorrhage model. The subsequent data obtained after clutter removal are used in conjunction with the delay and sum (DAS) method to reconstruct the target image.
The imaging system implemented in the proposed approach. (a) Entire setup and (b) magnified view of the antenna and target.

In the DAS process, time-shifted backscattered signals from the target are combined to form a synthetic focus. This approach amplifies the signal strength at resonant frequencies, enhancing the imaging accuracy. The signal magnitudes at each focus point are recorded and visualized in MATLAB, with the general DAS expression given in equation (6).
 \begin{equation}{Y_{DAS = }}\mathop \sum \limits_{I = 1}^M \left| {{b_i}\left. {\left( {t - \tau } \right)} \right|} \right.\end{equation}
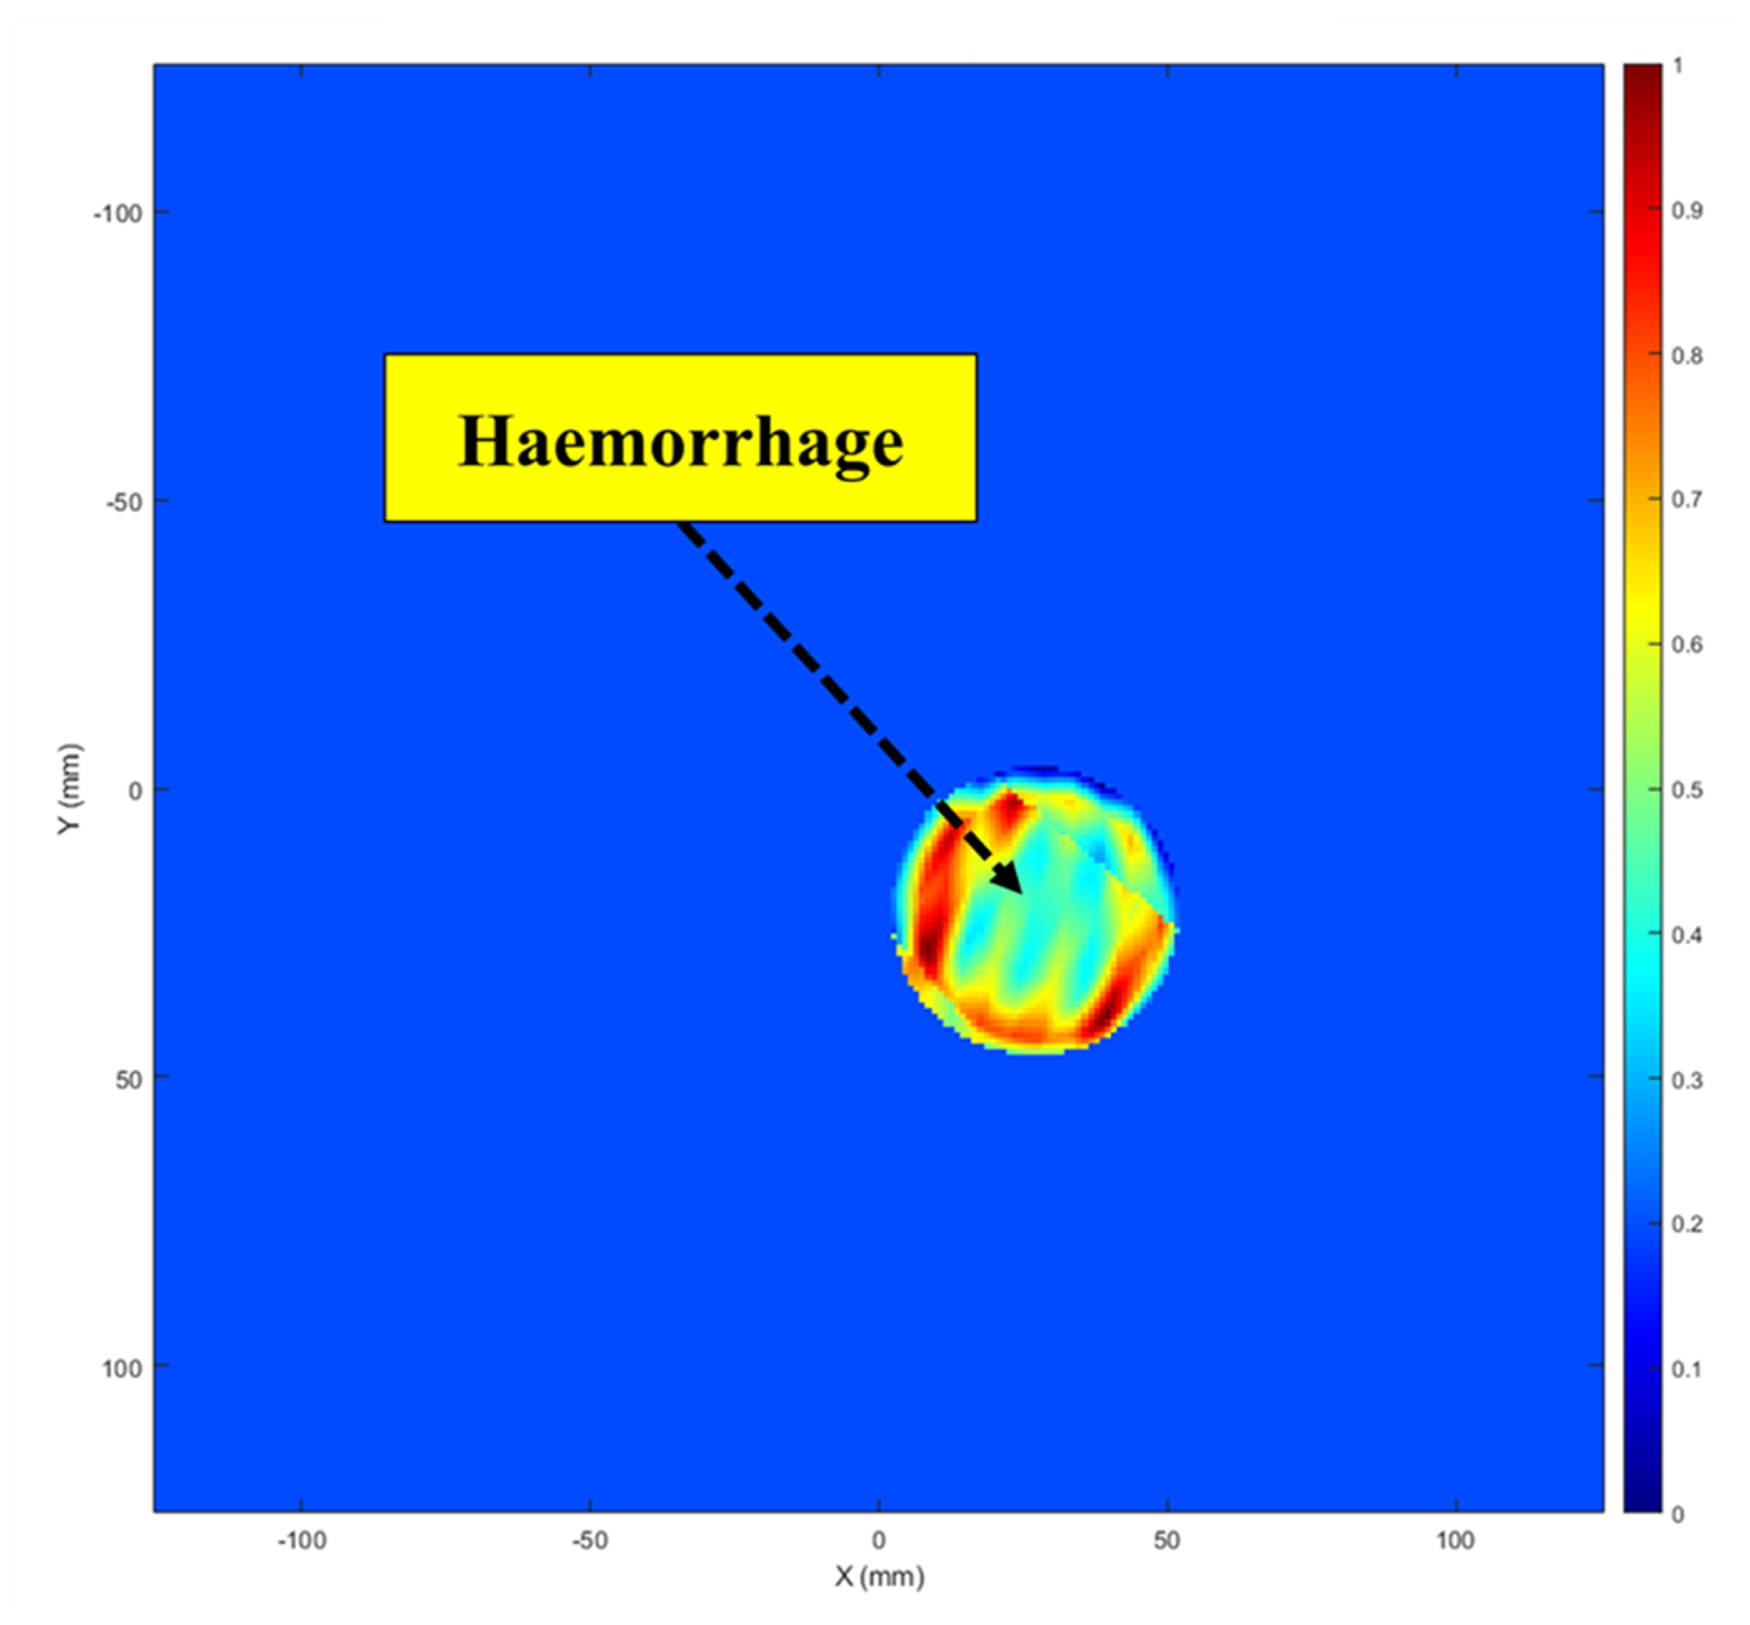
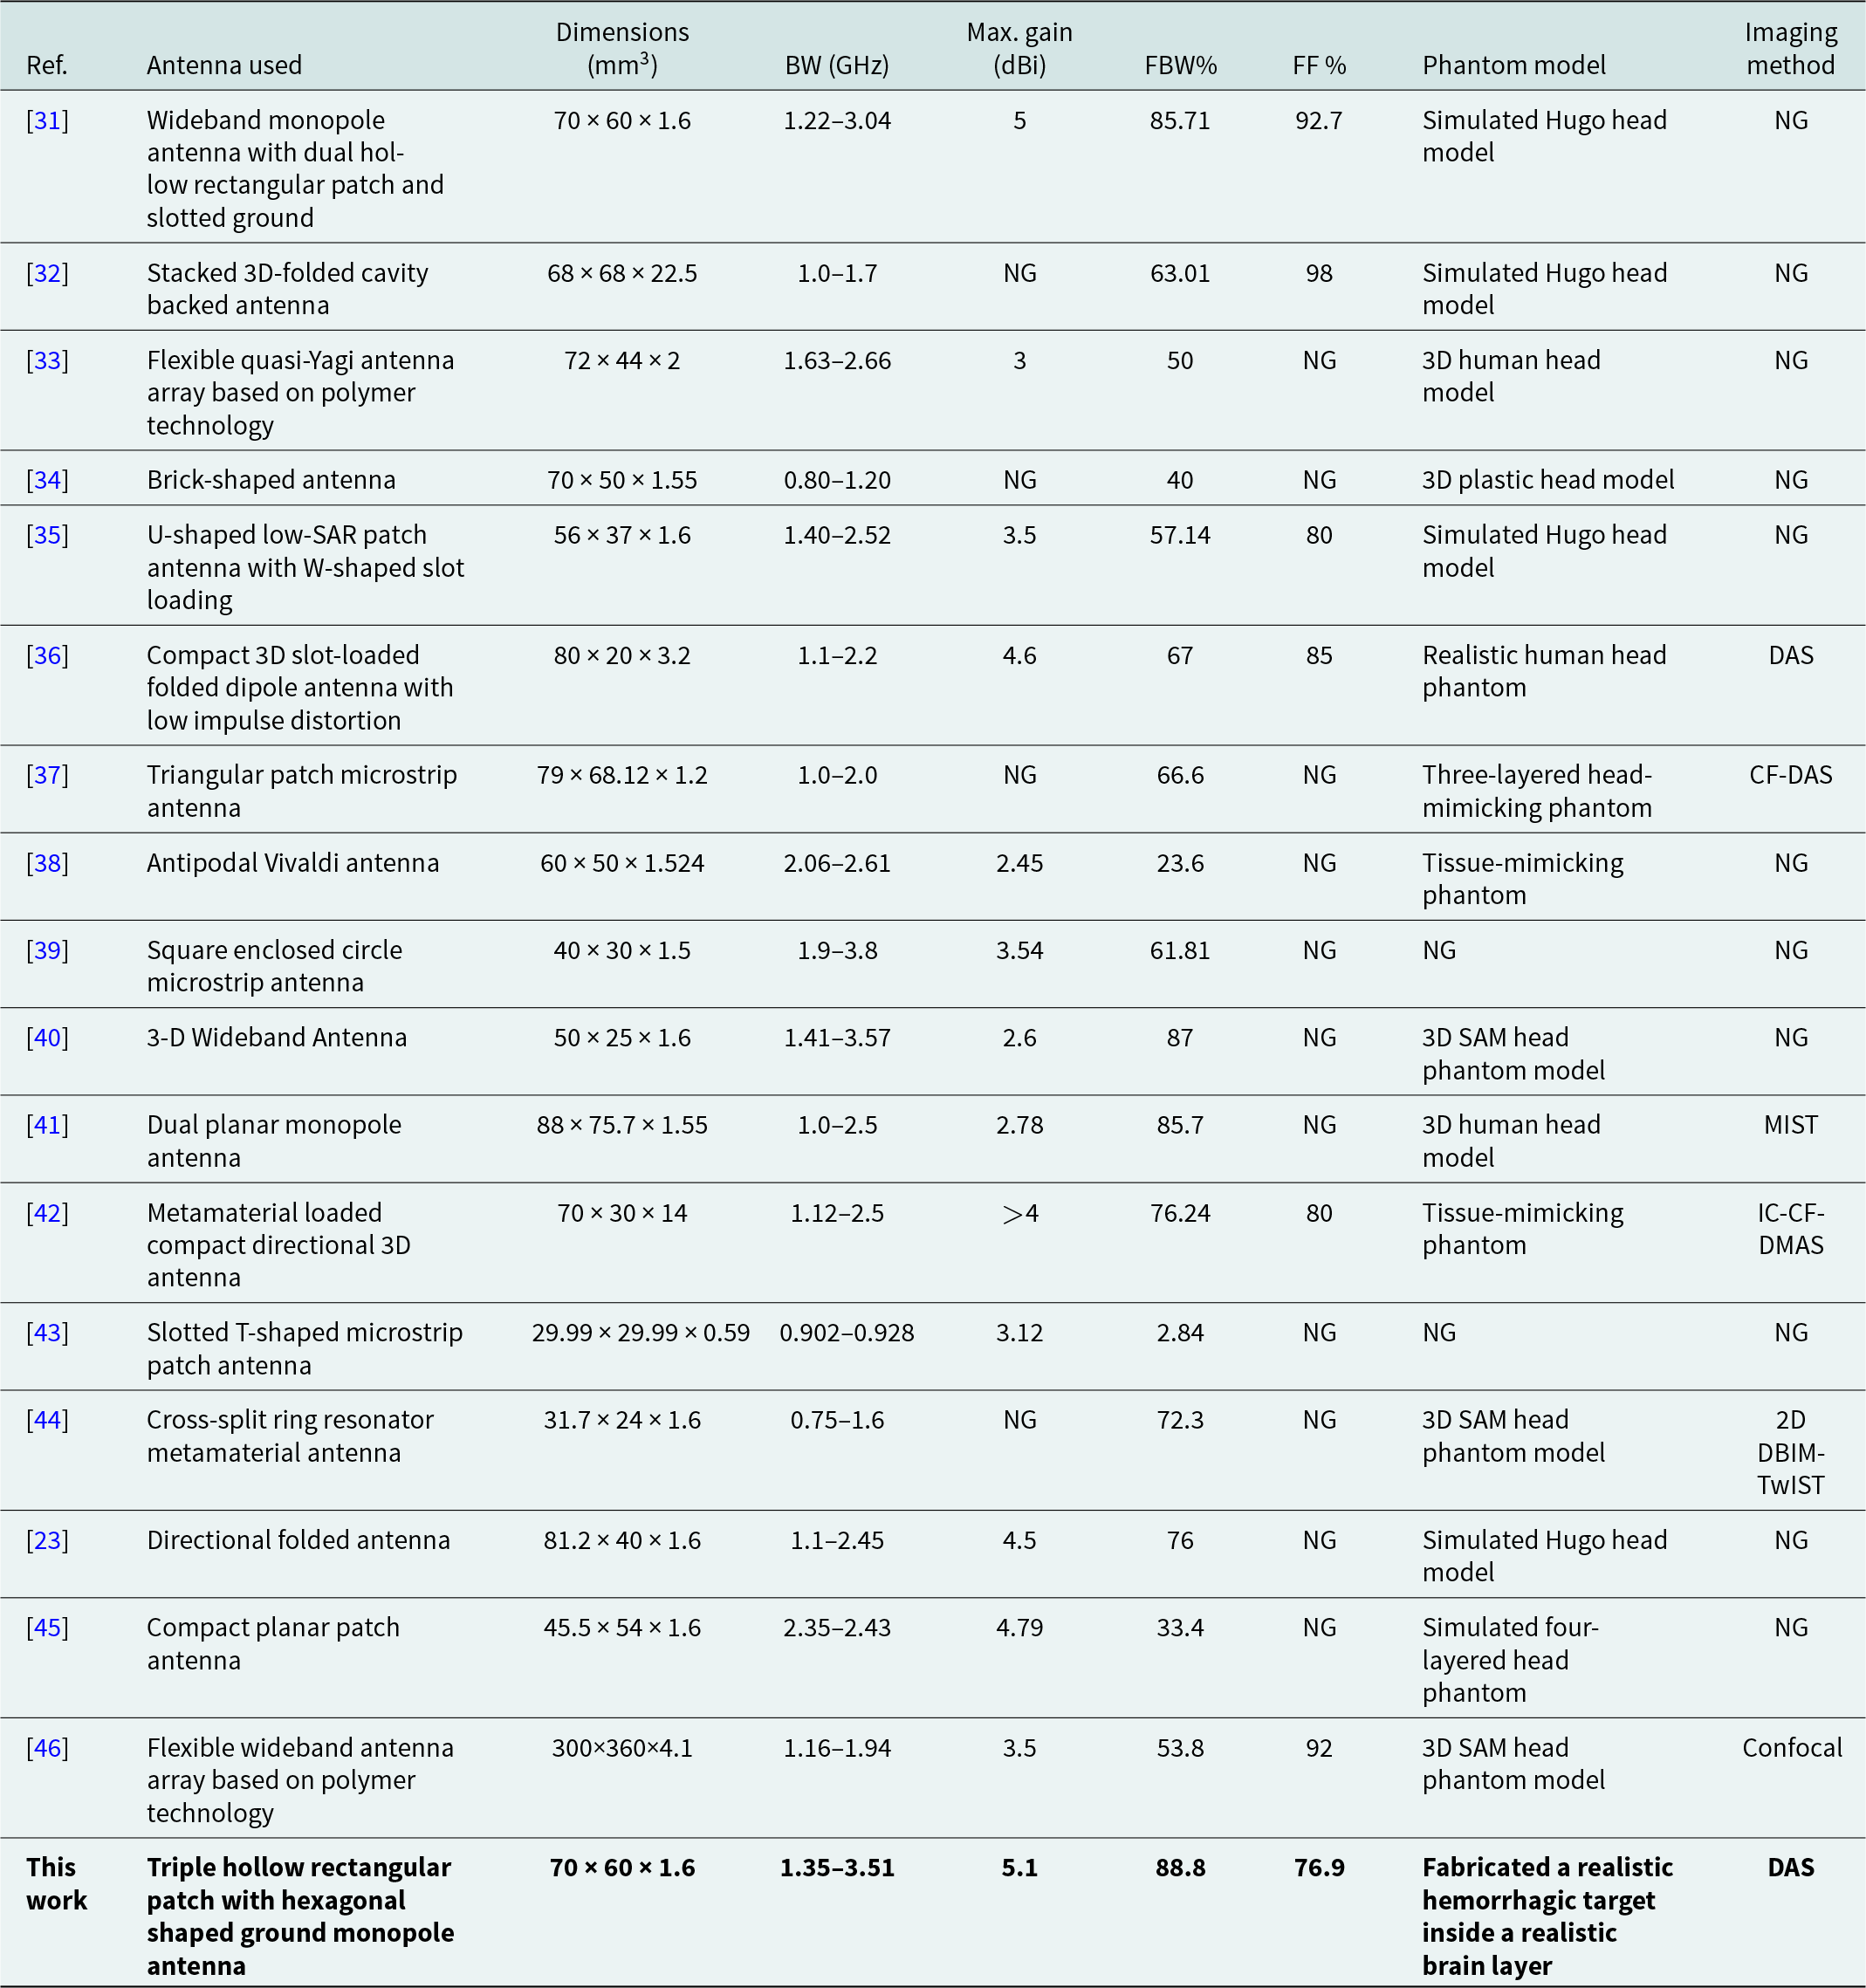
where YDAS indicates the final output of the DAS technique, and bi (t − τ) refers to the signal adjusted for delays. The image reconstruction procedure is summarized in the flowchart in Fig. 20. The reconstructed target image is shown in Fig. 21, with the target area distinctly marked. Small deviations from the true target positions are observed, which may result from measurement inaccuracies, nearby interference, and cable losses. A comparison of the suggested antenna with other similar systems is presented in Table 3, highlighting its superior performance in microwave head imaging.
The imaging process flowchart.

The reconstructed image of the target.

A comparison of the imaging findings with those from related head imaging studies

Conclusion
The proposed work introduces an antenna operating within the 1.35–3.51 GHz range, featuring a peak gain of 5.1 dBi, specifically designed for brain stroke applications. Comprehensive evaluations of the antenna in both frequency and time domains are extensively detailed. A high dielectric realistic target was fabricated for testing in the lab. The antenna was employed to image this target using the fundamental DAS approach. Future work will involve using the antenna with various algorithms to image complex targets and incorporating several clutter removal techniques to minimize false-positive signals. Moreover, the fabricated antenna will be employed for inspecting various hidden metallic and nonmetallic items without causing damage. The setup used in this work will also be used to assess the feasibility of distinguishing intracerebral hemorrhage from subarachnoid hemorrhage using complex head phantom models.
Acknowledgements
The authors would like to express their profound gratitude to the IIT Mandi iHub and HCI foundation under project number IIT MANDI iHub/RD/2023-2025/03 and Science and Engineering Research Board, Government of India, under project number TTR/2022/000001, for partially funding of this work. The authors would also like to thank the director of Indian Institute of Technology Palakkad for setting up the Central Instrumentation Facility.
Competing interests
The authors declare that there are no conflicts of interest.

ATHUL O ASOK (Graduate Student Member, IEEE) received his B.Tech. degree in Electronics and Communication Engineering from the National Institute of Technology Calicut in 2016 and his M. Tech. degree in Communication Engineering from the National Institute of Technology Karnataka in 2019. He received his Ph.D. from the Indian Institute of Technology Palakkad, India, in 2025.He has received several accolades, including the IEEE REC SB Best Design Paper Award at the Wireless Antenna and Microwave Symposium 2024 conference, held at Raghu Engineering College, Visakhapatnam, India, and the Best Paper Award at Wireless Antenna and Microwave Symposium 2022, hosted by NIT Rourkela, India. He was also the recipient of the prestigious Antenna and Propagation Society Fellowship (APS-F) in 2022 and the Best Presenter Award at International IOT, Electronics and Mechatronics Conference 2020, held in Vancouver, Canada. He has published more than 47 research papers in the area of microwave imaging. His current research interests include microwave imaging, ultra-wideband antennas and compact antennas.

SOWMYA M is currently pursuing her M. Tech degree in Electronics and Communication Engineering at NSS College of Engineering, Palakkad, Kerala, India. She completed her B. Tech in Electronics and Communication Engineering from Government Engineering College, Palakkad, Kerala, in 2023. Her research interests include Microwave Imaging, Ultra-Wideband (UWB) Antennas, and Compact Antennas.

HARIKRISHNAN A I received B. Tech degree in Electronics and Communication Engineering from Mahatma Gandhi University, Kottayam, India and Master of Technology in Microelectronics and VLSI design from Indian Institute of Technology, Kharagpur, India. His research interests include planar antenna, reconfigurable microwave filters, Chipless RFID tags.

SUMI M received the B. Tech degree in Electronics and Communication from the Cochin University of Science and Technology (CUSAT) in 2003, and the MTech degree in Electronic Design from the Indian Institute of Science in 2009 and received PhD from CUSAT in 2017. Her research interests are designing of Chipless RFID sensors, Microwave filters, Multiband and Ultra-wide band antennas.

SUKOMAL DEY (Senior Member, IEEE) obtained the Ph.D. degree from the Centre for Applied Research in Electronics, Indian Institute of Technology Delhi, New Delhi, India, in July 2015. From August 2015 to July 2016, he was a Project Scientist with Industrial Research and Development Centre, IIT Delhi, and also worked on a collaborative research project supported by Synergy Microwave Corp., Paterson, NJ, USA. From August 2016 to June 2018, he was with Radio Frequency Microsystem Lab, National Tsing Hua University, Taiwan, as a Post-doctorate Research Fellow. Dr. Dey served as an Assistant Professor from June, 2018 to June 2023, and since June 2023, he has been an Associate Professor with the Department of Electrical Engineering, Indian Institute of Technology Palakkad, Kerala, India. For his M.Tech. dissertation (one year), he was with Central Electronics Engineering Research Institute, Pilani, India, in 2009. He has authored or co-authored more than 150 research papers, two state-of-the art books, two book chapters, holds 6 patents and filed 11 patents. His research interests include electromagnetic metamaterial structures, frequency selective surfaces, microwave imaging, and microwave-integrated circuits, including antennas and RFMEMS.