A significant number of non-democratic regimes hold elections for national or local offices. Some of these elections are intended merely to create rubber stamp legislatures devoid of meaningful competition, but others are quite competitive. Much of the extant literature investigates why authoritarian rulers would choose to hold elections of this sort, and what kind of economic strategies non-democratic leaders might employ to stay in office through these elections.Footnote 1 Less attention has been paid, however, to how authoritarian leaders co-ordinate the resources under their control and how voters respond to the policy choices of authoritarian governments.
Our approach focuses on industrial policy and its effects on voting behavior. By comparing levels of support across counties before and after the allocation of industrial complexes, we aim to understand how industrial policy implemented by authoritarian governments shapes the electoral strategy and affects the electoral preferences of constituents across various regions. To the best of our knowledge, this study is the first attempt to derive such evidence from industrial policy, rather than from direct material transfers such as anti-poverty programs or other kinds of subsidies.Footnote 2
The empirical analysis relies on data from South Korea’s legislative elections under authoritarian regimes from 1971 to 1988.Footnote 3 During this period, authoritarian leaders selectively built massive industrial complexes in targeted areas. We incorporate an original dataset consisting of detailed information on industrial complexes and county-level electoral outcomes from that period. Using a difference-in-differences (DID) analysis, we find that the authoritarian presidents’ industrial policy choices indeed helped the incumbent party increase its electoral gains in favored counties. The changes in electoral outcomes appear immediately after the appointment of a new industrial complex. Interestingly, additional electoral gains from the completion of an industrial complex are smaller than the effects of its appointment or the beginning of construction.
We also examine two potential competing mechanisms: reverse causality and a migration effect. If the authoritarian leaders build industrial complexes simply to reward support from the previous election, the chain of causality would be reversed and our argument would be spurious. First, we test the relationship between the location of industrial complexes and the support rate for the incumbent party in the previous election to address this possibility. Secondly, we investigate whether migration induces the change in electoral outcomes. Since the construction of an industrial complex could cause a population influx from construction labor, engineers and workers hired at the complex, it is possible that the changes in electoral results reflect the biased political attitudes of the migrant population toward the incumbent rather than a change in voting behavior among indigenous locals. Our analysis supports neither of the alternative mechanisms: it reveals that leaders allocate industrial complexes to counties where support was weaker in prior elections. We also find that the population influx cannot explain the change in electoral outcomes.
Finally, to understand how authoritarian rulers co-ordinate resources and instruments under their control in order to affect electoral outcomes, we test whether there is a systematic relationship between the allocation of material benefits and electoral fraud.Footnote 4 By identifying suspicious cases – in which the total number of votes exceeds the number of eligible voters – and testing the relationship between these abnormal ballot counts and the location of industrial complexes, we find that drawing an industrial complex to the area significantly decreases the probability of electoral manipulation measured by abnormal ballot counts. Consistent with our main findings, the negative effect of industrial complexes on electoral fraud disappears by the time the construction is complete.
The article makes several contributions. First, by evaluating places where residents are directly advantaged by the construction of an industrial complex, we are able to analyze behavioral changes among voters due to economic benefits from authoritarian governments, a topic for which the extant literature lacks micro-level evidence outside of anti-poverty programs. In analyzing the effects of an industrial policy in this way, the article also adds evidence to the growing consensus that elections under authoritarian regimes are more than just window dressing. Secondly, we attempt to explain how electoral fraud is used strategically by authoritarian leaders. Authoritarian rulers co-ordinate various political and economic tools under their control for the purpose of winning elections and maintaining power. Although a large literature discusses the effects of various strategies employed by dictators, the relationship among those instruments has rarely been investigated.Footnote 5 Based on our finding that electoral fraud occurs much less frequently in places that host a new industrial complex, we suggest a substitutive relationship between the allocation of economic benefits and the occurrence of electoral fraud. Thirdly, instead of relying on a cross-national data approach, this study employs a strategy of subnational comparison. This allows us to control for important unobservable factors, since the units of analysis share major political and economic features. Finally, we draw systemic evidence from South Korean authoritarian elections, which, as Gandhi and Lust-Okar note, are rarely exploited in empirical studies.Footnote 6 This study thus contributes to an improved understanding of regional voting behavior in South Korea. While many observers of Korean politics have suggested that the unequal distribution of economic benefits by non-democratic regimes constitutes the origin of regional voting behavior, none to this point has provided systematic evidence to support that claim.Footnote 7
The remainder of the article is organized as follows. The next section provides a theoretical discussion related to our research question. We then present background information on industrial policy in South Korea, paying particular attention to industrial complexes. This section also specifies the types of economic benefits that were delivered to the areas where industrial complexes were located. In the subsequent section, we describe our dataset and provide some key descriptive statistics. We then discuss the empirical model and present the findings. The final section concludes.
TARGETED ECONOMIC BENEFITS AND ELECTIONS UNDER AUTHORITARIANISM
Elections under authoritarianism, by definition, allow limited competition, if any. Nonetheless, most contemporary authoritarian regimes do hold elections. The literature generally agrees that elections do not necessarily harm the survival of authoritarian regimes, and can often contribute to their stability. As for the mechanism, scholars have noted various benefits of holding elections under authoritarianism. Studies claim that authoritarian leaders use elections as a mechanism to distribute resources to elites, opponents and constituents.Footnote 8 More recent studies focus on the informational and communicative role of authoritarian elections.Footnote 9 Although authoritarian elections serve a variety of roles, the central point from previous research on why authoritarian incumbents hold elections is consistent: they do it to strengthen their position of power.
How do authoritarian incumbents ensure that they will win these elections? Past studies find theoretical and empirical support for carrots (economic benefits), sticks (repression) and tricks (electoral fraud).Footnote 10 Scholars find that public benefits to targeted groups tend to increase the probability of regime survival.Footnote 11 Lust-Okar outlines voters’ economic incentives to support non-democratic leadership, reviewing competitive clientelistic environments in North Africa and the Middle East.Footnote 12 Schady’s analysis also shows how the Peruvian authoritarian regime selected the timing and targeted the beneficiaries of its anti-poverty program for the purpose of gaining electoral support in national elections.Footnote 13 Our analysis is in line with these studies in that it adds detailed evidence of the political impact of targeted material benefits in authoritarian elections. However, this research is distinct from those studies in two ways. First, we investigate the redistributive impact of industrial complexes, which served as the key component of the national economic development plan. Secondly, we examine how long the effect of industrial complexes endures. Utilizing the timing of the construction process and of elections, we test whether the change in electoral support from the initiation of an industrial complex persists or vanishes quickly. While the literature debates how particularistic benefits affect voters’ choices in repeated elections,Footnote 14 we explain changes in electoral support during the process of a single project.
Aside from economic benefits, elections under non-democratic regimes are often accompanied by significant political repression and electoral fraud. Using cross-national data, studies have presented somewhat contradictory findings. While Davenport finds that authoritarian governments are statistically more likely to reduce political repression in election years in order to increase popular support, Richard finds no support for the correlation between elections and human rights violence.Footnote 15 By examining incidents of repression that are directly related to elections, Hafner-Burton, Hyde and Jablonsk emphasize the importance of the dynamics between an incumbent’s (expected) success in the election, on the one hand, and pre- and post-election violence, on the other hand.Footnote 16 Since there is no obvious source of information on electoral fraud and manipulation, scholars have focused largely on analyzing the political circumstances of electoral fraud and measuring electoral fraud using electoral data.Footnote 17
While the literature clearly suggests that authoritarian leaders consider elections to be part of their portfolio of instruments for maintaining power, less attention has been paid to how those rulers compose the portfolio strategically, as Gandhi and Lust-Okar point out.Footnote 18 In this study, we examine how authoritarian regimes co-ordinate those instruments in order to affect electoral results. In particular, we ask whether targeted economic benefits allocated before an election affect the degree of electoral fraud in the following election.Footnote 19 While most previous studies focus on just one of the tools, often in a cross-national context, here we use micro-level data to show how authoritarian incumbents strategically combine those tools to maximize their chances in elections.
This study also addresses the political regionalism in Korea that any study of Korean elections is likely to raise. Regionalism is a long-standing empirical reality in Koreans’ voting behavior: voters living or born in the southeastern region of Korea (Gyeongsang-do) have generally supported a conservative party, which has its roots in the authoritarian ruling party, while voters living or born in the southwestern region (Jeolla-do) have tended to support a moderate liberal party, which constituted the opposition party under authoritarian regimes. This regionalism is said to have started from the first presidential election after democratization in 1987: three major politicians, the so-called Three Kims, competed against each other by arguing that their home provinces had been marginalized from economic development under authoritarian regimes, or that their respective regions would be excluded from national policy if other candidates were to win. Regionalism continues to be a decisive factor shaping national elections in South Korea.
Aware of this conspicuous voting pattern, one might argue that voters cast their votes purely according to regional identity, regardless of economic benefits. This commonly accepted perspective considers political mobilization and electoral coalition building by politicians to be the major causes of regionalism.Footnote 20 In contrast, several Korean scholars emphasize that the unequal socio-economic structure has caused parties to seek and obtain support along regional lines.Footnote 21 In our view, these perspectives do not necessarily contradict one another. Without social and economic inequality, political mobilization strategies emphasizing regional differences would be implemented in vain. Without political mobilization, unequal distribution and development would be difficult to raise as a core issue in elections. Instead of rejecting these interdependent perspectives, we argue that an unequal distribution of economic benefits serves as the underlying origin of political regionalism.Footnote 22 The existing literature, however, has not provided systemic evidence on the cause of regionalism. Therefore, a contribution of this article in the Korean context is to demonstrate that political regionalism in fact developed during the dictatorial period, which we do by testing the effects of unequal economic development on authoritarian election outcomes using disaggregated data on industrial complexes.
Finally, this study contributes to the developmental state theory, in which South Korea has been depicted as an example of successful industrialization led by an efficient central government.Footnote 23 Although the main argument of this article does not directly test the developmental state theory, the implications of our findings supplement the arguments of that literature. This study, instead of examining the economic success of South Korea as a whole, highlights uneven resource distribution implemented by the authoritarian regimes in the process of economic development, and the political consequences of that policy. On the one hand, our empirical results provide evidence supporting the developmental state theory, by showing that voters supported the authoritarian leaders in return for economic development. On the other hand, our results also reveal subnational diversity in political support in response to industrial policy, a point on which the developmental state literature has remained opaque.
BACKGROUND: INDUSTRIAL COMPLEXES IN SOUTH KOREA
The question we ask in this study is whether constituents under authoritarian rule change their electoral choice in response to the distribution of economic benefits by their dictatorial leaders. By analyzing locations and types of industrial complexes built during the study period, this section shows that economic gains have indeed been unevenly distributed across places.
Economic growth in South Korea has hinged on the development of manufacturing industries during authoritarian periods. With a comparative advantage in labor supply, the Park Chung Hee regime started to pursue an export-oriented economic development strategy in 1963. As part of that strategy, the government deliberately channeled public and private investment into specialized industrial complexes in order to maximize synergic effects among related industries and to enhance competition among companies in the same industry.
There are three levels of industrial complex in South Korea: national, regional and rural. In general, national industrial complexes are the largest, and most were built for heavy chemical industries, while rural industrial complexes tend to focus on low-skilled light industries such as food processing and agricultural product processing.
During the period of our analysis, although either the minister or local government was in charge of the official administration of industrial complexes, de facto decisions on their specifics – regarding factors such as location, size and specified industry – were made by the president and the central government. Since the president appoints all ministers, mayors and governors, and the budget was in the hands of the central government, those leaders were mere administrators without substantive power regarding industrial policy making.
The key assumption underpinning this study is that the residents of an area with industrial complexes are advantaged by the construction of an industrial complex. In 1961, when Park Chung Hee came to office through a coup, annual GDP per capita in South Korea was only $82 (in 1975 US dollars) and the country had a severely underdeveloped agricultural economy. Given South Korea’s level of economic development at that time, the economic benefits to residents brought about by industrial complexes were massive and diverse. The following describes such benefits.
First, industrial complexes generated a surge in local employment. In particular, national industrial complexes offered inhabitants a large number of stable and highly preferred jobs, as the majority of companies operating in national industrial complexes were conglomerates. During the construction period, the massive influx of construction workers and facilities boosts the local economy. Secondly, industrial complexes enhanced the local economy by increasing the local population, which was economically active. Thirdly, given the importance of accessibility, the construction of an industrial complex was accompanied by large investments in infrastructure such as transportation facilities (highways, railroads, regional airports), sewage systems, electricity and housing clusters, all of which benefit the local residents. Fourthly, the tax revenue of the local and regional governments increased as industrial complexes increased their operational capacity. Increases in population also entailed an increase in tax revenue through residence and property taxes. Residents of areas with an industrial complex shared the benefits of increased tax revenues, as the regional and local governments spent at least part of it on public services.
Last but not least, while the previous four features are universal byproducts of the construction of industrial complexes, Korean industrial complexes have unique synergistic effects with the welfare system. Basic welfare programs in Korea, including industrial injury insurance and medical insurance, mostly started in the early period of President Park and expanded through a phase-in strategy: the programs were launched in workplaces with over 500 workers and expanded to smaller workplaces over time. Workers in the manufacturing sector have also been prioritized beneficiaries of welfare programs. Because industrial complexes, especially national industrial complexes, consist of larger workplaces than regional and rural complexes, and because those complexes generally feature manufacturing companies, workers employed in the industrial complexes were more likely to receive public welfare benefits earlier than workers in other places.
It is noteworthy to mention that the construction of an industrial complex takes anywhere from a couple of years to several decades (mean 3.8 years/SD 3.9 in our sample of completed industrial complexes). Therefore construction is often incomplete when the next election is held. With this in mind, we construct three alternative identifications of industrial complex: appointment of an industrial complex, beginning of construction and completion of construction. By estimating the effects of an industrial complex at three different times, we can effectively account for the impact of long-term construction period.Footnote 24
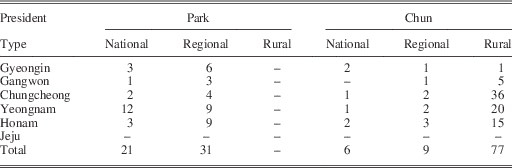
Next we present basic information regarding the appointment and distribution of industrial complexes. Table 1 describes the details of industrial complexes that have been appointed or constructed in South Korea during the authoritarian regimes.Footnote 25 Out of 144 industrial complexes, fifty-two were built under President Park and ninety-two under President Chun. Of the fifty-two industrial complexes appointed during President Park’s regime, twenty-one were appointed in Gyeongsang-do. Furthermore, among the twenty-one national industrial complexes approved by President Park, more than half (twelve complexes) were located in Gyeongsang-do, which suggests that Gyeongsang-do was highly favored by President Park’s regime relative to other provinces.
Location and Type of Industrial Complexes (1962–87)

Note: Gyeongin: Gyeonggi-do, Seoul, Incheon; Gangwon: Gangwon-do; Chungcheong: Chungcheongnam-do, Chungcheongbuk-do, Daejeon; Yeongnam: Gyeongsangnam-do (Gyeongnam), Gyeongsangbuk-do, Busan, Ulsan, Daegu; Honam: Jeollanam-do (Jeonnam), Jeollabuk-do, Gwangju; Jeju: Jeju-do.
President Chun succeeded Park and expanded the basic industrial policy that pursues economic growth driven by the production and exports of industrial complexes. Furthermore, his government created the system of rural industrial complexes in 1984 as part of a rural development policy, appointing seventy-seven such complexes. As a result, the total number of industrial complexes expanded significantly during his government.
DATA AND EMPIRICAL STRATEGY
The data used in this study rely on three main sources. First, data on industrial complexes are based on the Yearbook of Industrial Complexes in Korea published by the Korea Industrial Complex Corporation (Yearbook, hereafter).Footnote 26 The Yearbook reports information on all industrial complexes in South Korea such as geographic location, size, appointed date, starting date, administrators, project operators, the number of resident companies, names of current resident companies in each complex, current industry and the employment of each company.
Secondly, we utilize election reports published by the National Election Commission (NEC). We use polling-station-level election reports (The Report on Votes for Candidates by Polling Station in Legislative Elections) for legislative elections in the 1970s and 1980s (1971, 1973, 1978, 1981, 1985 and 1988). The 1971, 1973 and 1978 legislative elections are used to investigate the effects of industrial complexes during President Park’s regime. The 1981 election reflects the effect of regime change, from Park to Chun.Footnote 27 The election in 1985 represents a legislative election in President Chun’s period. A comparison of the electoral outcomes between the 1985 and 1988 elections reveals the impact of democratization.Footnote 28
An important issue to address at the outset is why we rely on legislative, rather than presidential, elections. To analyze public support for the authoritarian leader, presidential elections would be ideal. However, during the Park regime, the system of presidential elections changed from direct national elections to indirect elections. This institutional change constrains our ability to diachronically compare public support for the president across cycles. Legislative elections in South Korea during dictatorial regimes were typical authoritarian elections, in that the ruling party always won more seats than any opposition party. However, unlike in many other authoritarian countries, there was a substantial level of competitiveness. In the 1971 election, the authoritarian party obtained 113 out of 204 seats, while the major opposition party won eighty-nine seats. In the next election (1973), the ruling party won seventy-three out of 146 seats and the major opposition party obtained fifty-two seats in the Assembly. In 1978, the incumbent president’s party won only sixty-eight out of 154 seats, while its primary opponent won sixty-one. In 1981, the president’s party won only 36 per cent of the total vote, though it obtained 151 out of 276 seats. In the 1985 election, the seats for the ruling party were reduced to 148 out of 276.Footnote 29
One potential challenge to analyzing legislative elections during the Park and Chun regimes is the change in electoral systems from a single-member district system to a multi-member district system in 1973 and back to a single-member district system in 1988. These changes should not affect our diachronical comparison, given that this study focuses on voters’ choices and the dictators’ benefits from those choices. We measure the level of popular support by the vote share, which is not affected by the electoral system change, instead of relying on the number of seats in the legislature. Indeed, regardless of the electoral system changes, voters still vote for the candidate of their choice. Hence, from the view of voters, vote share provides a legitimate and consistent indicator of popular support for a political party. In addition, we mitigate the effects of electoral system change on our empirical tests by including year fixed effects. As part of the DID specification, we include year dummy variables in all estimations, which control for the effects of unobserved events that occurred in a given year. The statistical effect of electoral system change is thus largely captured by the year dummy variables.
Thirdly, in order to incorporate demographic covariates such as total population, population by gender and the number of households, we use census reports published by Statistics Korea (the National Bureau of Statistics).Footnote 30 Two issues emerge in using the census data. As the governments of many other countries do, the South Korean government carries out and publishes a census every five years. Since the years of elections do not match the census years, we match the census taken in the closest year to each election.Footnote 31
The other issue relates to the level of analysis. In studying voter behavior, an ideal unit of analysis is the individual, for which we lack information (due to the secrecy of voting). Hence we pursue the most detailed level of analysis available in the data. The data on industrial complexes are highly detailed: one can pinpoint the exact location of each industrial complex and the resident companies therein. The most detailed election reports provide polling-station-level data. Finally, the lowest level available in the census data is the county (Eup, Myeon and Dong) level. Inevitably, all observations are merged at the county level.
Lastly, empirical analysis in this article is based on two sampled provinces, Jeonranam-do (Jeonnam, hereafter) and Gyeongsangnam-do (Gyeongnam, hereafter). These two provinces are chosen for several reasons. While they are alike in geographical aspects, there has been a clear fissure in voting patterns, as we discussed earlier. The latitudes of the two provinces are nearly identical. Both also have access to the sea on two sides and have large harbor cities that have developed and prospered historically. Furthermore, the distance to the capital city, Seoul, where most resources are concentrated, is similar for both provinces. The population size in 1970 was not notably different: 3.9 million in Jeonnam and 3.1 million in Gyeonnam. Although the provinces are adjacent to one another, interactions between the two, in terms of migration and employment/study in the other province, have been minimal due to the topography: the Sobaek Mountains create a natural boundary between them. The mountains explain why Jeonnam and Gyeongnam are distinguishable from each other historically and socially, and speak a different dialect, even though they are neighboring and share a number of geographical features.
The purpose of this study is to estimate the political effects of an industrial complex in neighboring areas. Therefore, the key independent variable should be a measure of the potential influence of industrial complexes. To construct this independent variable, we take two factors into consideration: distance to the nearest industrial complex and the size of the industrial complex.Footnote 32 First, we measure the distance from each county to the nearest industrial complex within a 50 km radius.Footnote 33 The focal point of measurement in each county is the county office (Jumin Jachi center).
In identifying the closest industrial cluster, as stated earlier, we use three different time criteria: the timing of the public announcement of the construction of an industrial complex, the beginning of construction and the completion of construction. We build separate distance variables because each criterion has a different implication in terms of measuring the impact of an industrial complex. First, the public announcement of an industrial complex constitutes the public designation of a certain area by the central government.
Secondly, we check the beginning date of the construction of industrial complexes since only then do residents of the region experience the public investment flows into the local economy. We separate the announcement from the beginning of construction because the time gap is sometimes substantial. For example, the designation of the Geoje Gisepo National Industrial Complex was announced in 1974, but its construction did not begin until 1981. If we assume that voters respond to the announcement, the treatment effect of the Geoje Gisepo area would have occurred in 1974, leading to a coding of 1 for the independent variable (announcement of industrial complex) in this area after the 1978 election. By contrast, assuming that voters only respond after seeing the construction begin, the treatment effect of the Geoje Gisepo area would have occurred in 1981. Therefore the independent variable (beginning of construction) is coded as 1 only after the 1981 election.
Lastly, we use the date of completion of construction. In most cases, construction is completed within a few years, which does not affect our treatment because of the four-year election term. However, the construction of industrial complexes often takes longer to complete. Since most national industrial complexes are huge, they tend to take longer to complete. For example, the Geoje Gisepo National Industrial Complex, where construction began and some businesses were launched in 1981, was officially completed in 2006. To reflect this time gap, we use the end date of construction as the third independent variable.Footnote 34
We also use three discrete distance variables to construct the first component of the independent variable: the linear distance from a county to the nearest appointed industrial complex, the distance to the closest complex under construction and the distance to the nearest completed complex.
The second component of the independent variable, space of industrial complex, is measured as the total appointed area of an industrial complex. The impact of small rural industrial complexes consisting of a few small companies must have been distinct from that of massive national industrial clusters for heavy chemical industries, such as the shipbuilding or steel industry. Hence, the size of an industrial complex is crucial when measuring its economic impact. It represents both the size of public investment in the construction and the magnitude of economic opportunities it brings to the area.
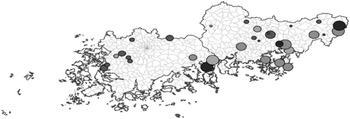
To measure the size effect of industrial complexes, we employ the area of each industrial complex. Tables A2 and A3 in the online appendix present information on the area of industrial complexes, which we call space. As the tables show, the variation is substantial. The space designated to an industrial complex varies from 40 km2 (Ieun Rural Industrial Complex in Hamyang, Gyeongnam) to 96,405 km2 (Gwangyang National Industrial Complex in Gwangyang, Jeonnam). Figure 2 illustrates the distribution and size of industrial complexes during the period of analysis, where the radius of each circle represents the size of the industrial cluster.
We construct the main independent variables, Industrial Complex in Appointment, Industrial Complex in Beginning and Industrial Complex in Completion, by multiplying the natural logarithm of space and the reciprocal of the three distance variables, respectively. Thus the estimates of our treatments are best interpreted as continuous variables that compare not only the areas with and without an industrial complex, but also regions with a large industrial complex and counties with a small industrial cluster.
The dependent variables are election outcomes. We use the share of votes for a candidate from the authoritarian party at the county level. Although we are less worried about electoral fraud, as South Korean authoritarian elections have been highly competitive compared to many other elections in non-democracies, we still find suspicious cases in the election reports from the NEC. To eliminate the possibility that those cases bias our estimation, we build a dummy variable, Fraud, that is coded 1 if the value of total votes is larger than the number of eligible constituents. In the empirical analysis, we exclude the observations if Fraud is 1 in order to remove the potential confounding effects of electoral fraud.
Covariates other than our independent variable that may affect the election results are also included in the model. The main source of control variables is the census data, from which we incorporate demographic factors such as total population and number of households. A regional dummy, Gyeongnam, is added to account for the effect of region that is not explained by the presence of industrial complexes. Gyeongnam region is coded as 1 and Jeonnam as 0. We also include urbanization to control for the impact of urbanized counties. In South Korea, a district, consisting of counties, is promoted to a city if the population exceeds 50,000. When a county that was originally categorized as a rural administrative district (Eup or Myeon) is promoted to an urban administrative district (Dong), it is coded as 1 for urbanization.
In total, 35 per cent of our observations is under the influence of industrial complexes. Approximately one-third of the counties (n=1,347) had (or planned to have) an industrial complex within a 50 km radius from the county office in the year of an election. Among the 1,347 counties that were located within 50 km of an appointed industrial complex, the construction of industrial complexes had begun for 1,191 of them by the election year. Complexes in 585 counties, less than half of the total, were completely constructed by the election year. The political effect of this time gap is analyzed in the empirical test section that follows.Footnote 35
EMPIRICAL STRATEGY: DID
Recall that this article estimates the effects of industrial complexes on political outcomes by comparing the electoral results of areas with an industrial complex to those without one. When we run a simple regression using key variables of interest, the influence of an industrial complex presents negative coefficients, implying that constituents within a 50 km radius of an industrial complex tend to cast fewer votes for the incumbent authoritarian party.Footnote 36 We think the reason for this contradictory result is that a regression analysis cannot distinguish the effects of an industrial complex from the underlying voting trends in the region.
Instead, we use a DID method, which allows us not only to compare the outcomes in the counties that were affected by industrial complexes and those that were not, but also to examine a second difference between outcomes before and after the appointment: the beginning or end of construction of an industrial complex.
The general form of DID specification is:
 $$Y_{{i,t}} \,=\,\alpha IC_{i} \,{\plus}\,\mathop{\sum}\limits_{t\,=\,1973}^{1988} \gamma _{t} d_{t} \,{\plus}\,\mathop{\sum}\limits_{t\,=\,1973}^{1988} \beta _{t} (IC_{i} \,{\times}\,d_{t} )\,{\plus}\,Z_{i} \delta \,{\plus}\,X_{{i,t}} \rho \,{\plus}\,{\varepsilon}_{{i,t}} ,$$
where Y i,t is the electoral outcome in county i at time t and d t is the time dummy variable. We have six year indicators in the analysis (1971, 1973, 1978, 1981, 1985 and 1988). IC i is the treatment variable that indicates whether a given county is influenced by an industrial complex. As explained above, we have four different measurements to capture the influence of an industrial complex. First, IC_Dummy marks whether a county has an industrial complex within 50 km. Secondly, IC_Appointment is the space of the nearest appointed industrial cluster divided by the distance between the cluster and a county at the time of the public announcement. Thirdly, IC_Beginning measures the influence of an industrial complex for which construction has begun. Finally, IC_Completion stands for the influence of completed complexes. Z i and X i,t indicate time-invariant and time-variant observational variables, respectively. For instance, population, the number of households and urbanization are listed in X i,t , and Z i includes the impact of province. Finally, we assume that the error term, ε i,t , is normally distributed.
The estimates of our interest are the vector of DID estimates, β t , which is equivalent to:
 $$\eqalign{[E(Y\!\mid\!IC\,=\,1,d_{t} \,=\,1)\,{\minus}\,E(Y\!\mid\!IC\,=\,1,d_{t} \,=\,0)]\,{\minus}\,[E(Y\!\mid\!IC\,=\,0,d_{t} \,=\,1)\cr \,{\minus}\,E(Y\!\mid\!IC\,=\,0,d_{t} \,=\,0)]$$
when IC is a dummy variable for an industrial complex. In other words, β t estimates how much the electoral outcome variable has changed in the affected counties due to an industrial complex, compared to the change in unaffected areas. Finally, we employ both county fixed effects analysis and county-clustered standard errors. In ordinary least squares (OLS) regressions, the standard errors are clustered within the same county. In generalized least squares (GLS) estimations, county fixed effects are included.
EMPIRICAL FINDINGS
This section presents findings from our empirical analysis. First, we test whether the appointment, the beginning of construction or the completion of construction of an industrial complex affects the voting behavior of constituents who live in nearby counties. We also test whether alternative mechanisms explain our empirical results. To confirm that the changes in voting behavior were not embedded in pre-existing voting trends, we examine the effects of past voting behavior on the selection of locations of industrial complexes. Furthermore, we investigate the link between a population influx and the electoral results to see whether immigration to newly industrialized areas drives the changes in electoral outcomes.
Main Results
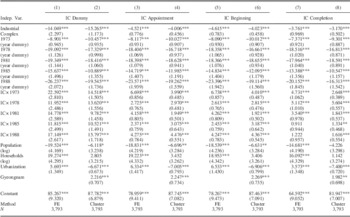
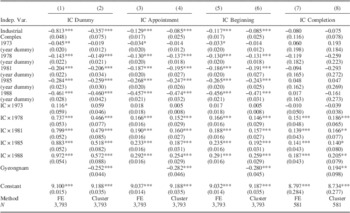
We first examine whether the existence, appointment, beginning of construction or completion of construction of an industrial complex increases the share of votes for a legislative candidate from the authoritarian party. Table 2 presents the results. Models with odd numbers employ a GLS regression analysis with county fixed effects, while the even-numbered models use OLS estimation with county-clustered standard errors. As time-invariant variables are not estimated by the fixed effect model, the residual effect of Gyeongnam Province is not estimated in the specifications with odd numbers.
The Effects of Industrial Complexes on the Vote Share of the Incumbent Party

Note: standard errors in parentheses. *p<0.05, **p<0.01, ***p<0.001.
As discussed above, the estimates of interest are the coefficients and standard errors of interaction terms on the election year variables and the industrial complex variable (IC×y1973, IC×y1978, IC×y1981, IC×y1985 and IC×y1988). As seen in Table 2, the results are positive and statistically significant, indicating that constituents who live near an industrial complex become more supportive of the ruling party after the complex is located in that area. The effects of having an industrial complex located nearby vary across elections.
It is notable that, in general, Park’s regime enjoyed the greatest advantage from deploying industrial clusters. The size of the coefficient is relatively larger for the 1973 and 1978 elections than for other legislative elections. In particular, the impact of an industrial complex on the 1973 election is substantial: voters cast almost 22.5 per cent more votes for Park’s regime where an industrial complex was appointed or constructed within a 50 km radius of their county (Model 1). In the 1978 election, the authoritarian president and his party also gained greater electoral support in the areas chosen for a new industrial complex. This finding is critical, since it is well known that the Park regime struggled in the 1978 election due to its repression of democratic demands. At the national level, the number of total votes that the first challenging party, the New Democratic Party, received exceeded the vote total for the authoritarian ruling party, the Democratic Republican Party. We interpret the magnitude of the effect to reflect the economic ripple effect of the industrial complexes planned by Park’s regime, given that the majority of industrial complexes built during his regime were large-scale national industrial complexes.
The effects of having an industrial complex located nearby are all positive with respect to the rate of support for the incumbent party, using all three alternative measurements. In Table 2, Models 3 and 4 use the appointment of industrial complexes as the dependent variable, Models 5 and 6 employ the beginning of construction as the regressand, and the last two models use the completion of construction as the dependent variable. The results are interesting and counterintuitive in some respects. They indicate that the constituents of affected counties vote for the incumbent party upon a promise from the government that an industrial complex will be constructed nearby. Compared to the effect of appointment, however, we fail to find an additional positive effect from the construction or completion of industrial complexes. We even observe the stagnation of support during the construction period. That is, voters are most willing to show their support when they expect potential economic benefits. Although the appointment of an industrial complex can be interpreted as no more than a political promise, voters living near the appointed site nevertheless change their voting choice to reflect increased support for the incumbent party. This finding contradicts the general assumption of the vote-buying theory: that voters make their voting choice after receiving the actual benefits. We believe this outcome is worth further theoretical contemplation and empirical investigation.
We find that the positive impact of appointment continues until the end of construction during Park’s regime. Yet during the Chun regime and immediately after democratization, the political effect of industrial complexes seems to disappear as their construction approaches completion. Again, we argue that the difference lies in the type of industrial cluster planned by the government: the construction and completion of large national industrial complexes produce a notable effect in the region in terms of employment and accessibility, while small rural industrial complexes have a limited impact on the local economy. Therefore the completion of small complexes does not deliver a noticeable political effect compared to national industrial complexes, as Models 7 and 8 in Table 2 reveal.
The DID estimates are consistent after controlling for population, number of households, effect of urbanization and region. We find population to be positively associated with the share of votes for the incumbent party, while the number of households is negatively related. According to the results, large counties with fewer households tend to support the ruling party, which implies that big rural counties consisting of large households are more likely to vote for the candidate from the president’s party.
The urbanization variable generates an interesting and important implication. As Table 2 shows, the estimations in models with odd numbers give an opposite estimate to those with even numbers. The fixed-effects estimations predict that urbanization has a positive impact on vote shares for the authoritarian incumbent party, while the estimations with clustered standard errors generate negative estimates. The latter implies that average support for the president’s party is lower in urban districts, which is consistent with long-standing electoral patterns in South KoreaFootnote 37 and other authoritarian electionsFootnote 38 that urban areas are more supportive of the opposition party while rural areas favor the authoritarian incumbent party. By contrast, the fixed-effects estimations reveal that voters in newly urbanized areas in Gyeongnam and Jeonnam, where urbanization during our period of observation is mostly caused by the construction of large-scale industrial complexes, are more likely to vote for candidates of the incumbent party.Footnote 39 This indicates that our main results hold after accounting for the effects of population increases and urbanization due to a newly constructed industrial complex. To explain the effect of a population influx in further detail, we run a separate set of analyses in the subsequent section.
The positive and significant coefficient on the Gyeongnam region dummy shows that there is a clear trend of regional segmentation in the elections during the authoritarian period.Footnote 40 This suggests that, whereas the unbalanced distribution of industrial complexes contributed to political regionalism in South Korea, it is not the only reason for the regional division in elections. Unexplained factors that promote a regional political cleavage may thus persist. Nevertheless, interpreting this result as evidence of the origin of contemporary regionalism in South Korea requires particular caution.
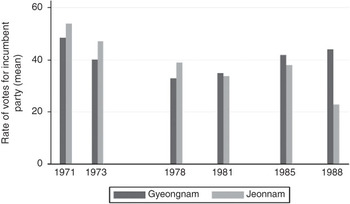
For a detailed and cautious understanding of regional voting behavior, we first check the time trend of a regional voting pattern. Figure 1, which illustrates the trend of regional voting behavior by comparing Jeonnam and Gyeongnam under the authoritarian regimes, clearly shows that the share of votes for the incumbent party is higher in Jeonnam during Park’s regime, though the gap declines slightly. This trend is the opposite of the contemporary pattern of regional voting, in which Gyeongnam tends to vote for the descendent party of the authoritarian incumbent party and Joennam supports the descendent of the opposition party under the authoritarian regimes. Regional cleavages that mirror the contemporary shape of regionalism started to form in Chun’s period and exploded in the election held immediately after democratization, when political regionalism emerged as a strong political motto.
A trend of votes for the incumbent party in Jeonnam and Gyeongnam

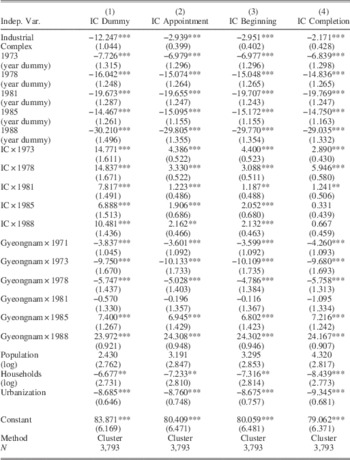
In order to systematically capture the dynamic trend of regional voting across elections, we use the interaction terms between the Gyeongnam region dummy and each election year in Table 3, which presents the results of more detailed tests of the existence of political regionalism that is unexplained by the allocation of industrial clusters. The results confirm what Figure 1 illustrates: voters in Gyeongnam are not more supportive of the incumbent party initially, but they become more supportive over time. From the results and interpretations of Table 3, we now infer that the estimates for the Gyeongnam variable in Table 2 simply reflect the overwhelming influence of the regional gap in the 1988 election.
The Effects of Gyeongnam on Votes for the Incumbent Party

Note: standard errors in parentheses. *p<0.05, **p<0.01, ***p<0.001.
Finally, negative coefficients on election-year dummy variables (y1973, y1978, y1981, y1985 and y1988) imply that voters in Gyeongnam and Jeonnam Provinces are less likely to vote for candidates from the ruling party in those elections compared to the 1971 election, the omitted year category. Indeed, as the authoritarian ruling period became more protracted and another authoritarian leader (Chun) came to office after the assassination of President Park, average support for the incumbent party declined. The negative coefficients on the election-year dummy variables reflect this tendency.
Figure 2 illustrates the findings in Table 2. Each circle represents an industrial complex, and the radius denotes the area of the industrial cluster. The color density of each circle illustrates the magnitude of political effects driven by the industrial cluster, based on the estimation of Model 3 in Table 2. Darker colors indicate a larger increase in the vote share for the incumbent party in the election subsequent to the announcement of the industrial complex.
Map of industrial complexes in Jeonnam and Gyeongnam Note: administrative boundaries are drawn from the official boundaries of 1975. Black boundaries mark provinces. The province on the left is Jeonnam and on the right is Gyeongnam. Grey boundaries mark counties, our units of analysis. Each circle denotes an industrial complex: the size of the circle represents the logarithm of the area, and the color density represents the estimated effect size from Model 3 in Table 2 .

We conduct additional investigations to test the robustness of the previous findings using different measurements of the dependent variable. First, we employ a logit regression using the probability that the incumbent authoritarian party wins the largest share of votes as a regressand. The results are available in Table A6 in the online appendix. During the study period, the electoral rules changed frequently, as described in the previous section. Therefore, instead of testing the probability that the candidate from the incumbent authoritarian party will win a seat in the National Assembly, we evaluate the probability that the candidate from the president’s party will get the largest share of votes in a given county. Consistent with the findings of previous estimations, the presence of an industrial complex has a positive and significant effect on voters’ choices, increasing their support for the authoritarian party. Again, the government’s promise to build an industrial cluster in the region increases the probability that candidates from the ruling party will win the election.
We also test whether voters in advantaged areas are more likely to vote than those in places without industrial complexes (see Table A7 in the online appendix). While the previous results show that the positive effects on vote share are smaller during the Chun regime compared to the previous authoritarian government under Park, the analysis of voter turnout shows that the Chun regime enjoyed a large boost in turnout rates in newly appointed industrial areas. As Gandhi and Lust-Okar, and Magaloni point out, authoritarian presidents tend to consider both high turnout and large vote shares as signals of regime stability.Footnote 41 The result implies that higher turnout in new industrial complex areas helped President Chun sustain stability to some extent.
Alternative Mechanisms
The main finding of this study is that an industrial complex leads the residents of nearby counties to vote in favor of the authoritarian ruling party. This causal inference would be implausible, however, if there were an underlying trend in voting outcomes in counties with industrial complexes prior to (or independent of) the existence of the complexes. For instance, the dictators in South Korea may have located industrial clusters in these particular counties because the constituents of those counties had been more supportive of the incumbent party in previous elections. If this were the case, the issue of reverse causality would undermine our findings, as the results of previous estimations could simply reflect the underlying tendency of voters in those counties rather than the effect of industrial complexes.
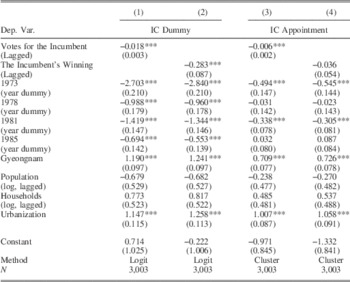
The results in Table 4 show that the concern of reverse causality is not applicable to our analysis. In contrast to the case we describe above, the share of votes for the ruling party in the prior election is negatively related to the probability that a county would be selected as a site for an industrial complex. Models 1 and 3 in Table 4 show that the share of votes for the ruling party in the previous election is negatively related to the probability that a county will be selected as a site for an industrial complex. In other words, compared to other counties, voters living near an industrial cluster were less likely to support candidates of the incumbent party before the complex was announced.
Lagged Election Outcomes and the Selection of Complex Location

Note: standard errors in parentheses. *p<0.05, **p<0.01, ***p<0.001.
Models 2 and 4 in Table 4 address whether the probability of an incumbent winning the largest vote share in the previous election affects the site selection of industrial complexes. These results are also negative, indicating that more industrial complex sites are built in counties where the candidates from the ruling party won fewer votes in the previous election. The industrial policy of the authoritarian regimes in South Korea tended to target less supportive counties, which induced the advantaged residents to vote for the ruling party in subsequent elections.
Another possible cause of the changes in electoral support is migration, that is, an influx of new voters to the newly industrializing areas. The establishment of an industrial cluster entails an influx of construction workers, industrial labor, engineers, related service workers and their dependents. Our assumption is that those immigrant workers and their families represent average voters of the region, meaning that they do not have a particular voting tendency that deviates from general voters. In other words, our causal argument that voters change their voting choices to support the authoritarian incumbent party in response to the appointment of an industrial complex in a neighboring area is supported by the empirical results even with population change, as long as immigrant workers are comparable to the average voters in the area. Yet a possibility worth considering is that the migrant population may represent a different group from the indigenous voters in terms of voting choices. In the authoritarian context, it is not entirely impossible that the government could provide the new economic opportunities from an industrial cluster selectively to supportive companies or workers. If this were the case, the results may simply show a change in voter composition as a result of migration, not a behavioral change among voters.
The results shown in Table 5 support the presence of a population increase due to new industrial complexes, but they undermine the plausibility of an alternative migration mechanism in two ways. First, the population increases almost equally across the timing of appointment, the beginning of construction and the completion of an industrial complex. This pattern of population growth in areas with a new industrial complex does not correspond to the pattern of electoral outcome changes, where we find a large increase in support for the incumbent party immediately after the announcement and a substantial reduction in the marginal increase in vote share for the authoritarian party by the time of completion. This finding provides evidence that migration cannot fully explain the electoral outcome changes. Secondly, Table 5 reveals that there is not a clear population influx around the 1973 election, for which we find the largest boost in vote share for the authoritarian incumbent party in Table 2. This evidence also supports our claim that the migration mechanism cannot explain the findings.Footnote 42
The Effects of Industrial Complexes on Population

Note: standard errors in parentheses. *p<0.1, **p<0.05, ***p<0.01.
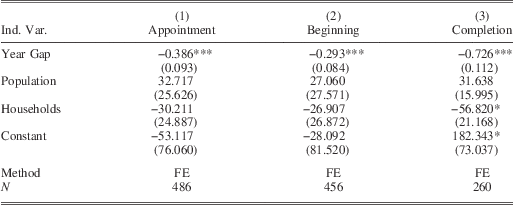
To address the concern of population composition changes more directly, we also test whether the year gap between the government decision regarding an industrial complex (announcement, beginning and completion of construction) and the subsequent election results in a difference in vote share. If the influx of people biased toward the authoritarian government causes the change in electoral results, the announcement of a new industrial complex would provide greater help to the incumbent party when it is made further ahead of an election, since that would allow a larger population to immigrate to the area before the election. In turn, if voters change their electoral choice in response to a new industrial complex allocated near their neighborhood, as we argue, the effect of the announcement would be largest when it is made immediately before an election. Therefore we construct a new variable, Year Gap, to measure the period between the government decision regarding an industrial complex (announcement, beginning and completion of construction) and the subsequent election. If our mechanism (voting behavior change) is correct, Year Gap should be negatively correlated with the vote share for the incumbent party. If the alternative migration mechanism explains the electoral outcome change, Year Gap should be positively associated with the incumbent party’s vote share. The results in Table 6 support our argument and undermine the migration mechanism. A two-way fixed-effects estimation shows that Year Gap is negatively associated with electoral outcomes. This indicates that the longer the period between the government policy decision (announcement, beginning and completion of an industrial complex) and an election, the smaller the change in vote share.Footnote 43
The Effects of Year Gap Between the Government Policy Decision and an Election on Vote Share for the Incumbent Party

Note: standard errors in parentheses. *p<0.1, **p<0.05, ***p<0.01.
INDUSTRIAL COMPLEXES AND ELECTORAL FRAUD
We further investigate whether material benefits that are arranged or allocated before an election affect electoral fraud. Data on electoral fraud are generally unavailable in most authoritarian elections, despite the common belief that electoral fraud occurs frequently in many non-democratic elections. Consistent with the conventional findings, beyond anecdotal evidence, there exists no systematic data on electoral fraud in South Korea. To overcome the limited availability of data, scholars have developed systematic methods to detect electoral fraud. Simpser measures electoral manipulation by reviewing electoral rules and elections in 132 countries from 1990 to 2007.Footnote 44 Others employ more technical methodologies to detect electoral fraud: Mebane and Beber and Scacco apply digits-based analysis, while Myagkov, Ordeshook and Shakin analyze the relationship between turnout rates and vote counts.Footnote 45
We find that the methods used to detect electoral fraud in previous studies do not fit the structure of our analysis. Since those methods do not specify the locations of electoral fraud, they do not allow us to systematically examine the relationship between material benefits and the presence of electoral fraud. Instead, they test only whether an election, as a whole, involves deception or not. While existing work provides effective methods of detecting electoral manipulation and fraud, this study requires the exact ‘location’ of electoral fraud. Therefore we measure electoral fraud by detecting abnormal vote counts at the polling-station level. We code the polling stations where the number of total votes is larger than the number of eligible voters, which is impossible unless electoral fraud was committed.Footnote 46 These abnormal outcomes reflect the method that the incumbent party has used pervasively in elections.Footnote 47 A sample case of abnormal ballot counts is presented in Table A8 in the online appendix, where the incumbent party (Minjeong Party) won the largest share of votes with a margin approximating the number of abnormal votes cast in one polling station.
A noteworthy caveat is that our method does not capture all electoral fraud committed during this period: rather, it identifies ‘excessive and blatant’ cases of fraudFootnote 48 detected from return sheets. Although there must have been more electoral fraud that is simply invisible from the election records, we employ this method because we find no better identification strategy for detecting electoral fraud, and no alternative systematic data are available.
Of 15,312 polling stations for legislative elections in the Jeonnam and Gyeongnam Provinces from 1971 to 1988, such abnormal vote counts are detected at 169 polling stations, 1.1 per cent of the total number of stations. Maps in Figure A2 in the online appendix describe the distribution of abnormal vote counts in the six elections we analyze. By election years, there are thirty-seven suspicious polling stations in 1971, fifteen in 1973, twenty in 1978, twenty in 1983, twenty in 1985 and fifty-seven in 1988.Footnote 49 Among the 169 polling stations with electoral fraud, twenty have a repeated record of abnormal ballot counts. That is, in most areas, electoral fraud was detected only once. We infer that the incumbent party’s decision to engage in electoral fraud is based on temporal needs, rather than idiosyncratic characteristics of the area. Gyeongnam has ninety polling stations with abnormal ballot counts; the seventy-nine remaining incidents of electoral fraud are associated with polling stations in Jeonnam. More fraud was committed in rural areas than urban areas (at 118 and fifty-one polling stations, respectively). No particular difference is found in terms of the incumbent party’s vote share: in total, the incumbent party won the largest vote share from 61.2 per cent of polling stations, while it won 62.1 per cent of the polling stations with evidence of fraud.Footnote 50
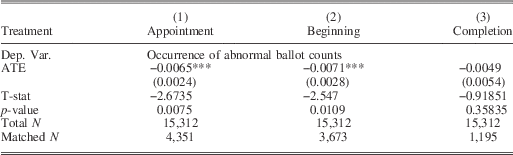
As the distribution of both industrial complexes and electoral fraud are not random, general regression analysis cannot provide unbiased estimation in our case. Instead, we employ a method that estimates causal effects in observational data by matching samples of the treated and control groups to reduce bias due to covariates. We use GenMatch to produce the matched sample set.Footnote 51 We then test whether the probability that areas hosting a new industrial complex will experience abnormal ballot counts is different from the probability in areas with no such benefits. Consistent with the method we adopt for the previous analysis, we test the probabilities for three different treatments: appointment, beginning and completion of industrial complex construction. Covariates employed in the matching process are the number of eligible voters, urbanization, province, turnout and election year. In other words, for each election, we match two polling-station-level areas within the same province, with a similar number of eligible voters and a comparable participation rate, and at similar levels of economic development. The only contrast is the treatment: in each matched sample, one has a new industrial complex and the other does not.
The results presented in Table 7 show that electoral fraud measured by abnormal ballot counts is less likely to occur in places with a new industrial complex. Across the three treatments (appointment of an industrial complex, the beginning of development and the completion of construction), an industrial complex has a negative effect on the occurrence of electoral fraud measured by abnormal ballot counts. However, the negative effect is statistically significant only in the estimations for the appointment and beginning of industrial complex development. No significant effect is found for the completion of construction. These results are consistent with our previous findings that the effects of a new industrial complex on the authoritarian government’s electoral gains are largest shortly after the announcement and almost disappear as the industrial complex approaches completion. Likewise, we find that abnormal ballot counts appear much less frequently in newly announced industrial complex areas, but that the negative relationship between material benefits and electoral fraud vanishes when the construction of industrial complex is completed. The size of the negative effect is not negligible: the average treatment effect is −0.0065 when the treatment is appointment of an industrial complex and −0.007 when it is the beginning of construction. Given that electoral fraud occurs in 1.1 per cent of polling stations, this suggests that the appointment of an industrial complex reduces the probability of electoral fraud by 59 per cent. The beginning of development has an even larger impact: an industrial complex that is under construction decreases the probability of electoral fraud by 64 per cent. In sum, the results support a substitutive relationship among the political resources in an authoritarian leader’s hand: the provision of economic benefits decreases the need for electoral fraud.
Industrial Complex and Abnormal Ballot Counts (Matching Estimation)

Note: standard errors in parentheses. *p<0.1, **p<0.05, ***p<0.01.
CONCLUSION
This article investigates the relationship between the distribution of economic benefits and electoral outcomes under authoritarian regimes. Employing a DID analysis with detailed data of electoral outcomes and industrial clusters in South Korea, we first examine how authoritarian rulers increase political support for their party using industrial policy, over which they have greater control than democratic leaders typically do. The average effect is largest when a plan for a new industrial cluster is announced. Furthermore, the positive relationship between industrial complex allocation and the incumbent’s electoral gains is not caused by other latent trends. In fact, authoritarian governments target areas with weaker incumbent support in previous elections as sites for new industrial complexes. We also test whether migrants to newly established industrial complex areas are the reason for electoral outcome changes, and found that they are not.
This article also suggests a substitutive relationship between economic benefits and electoral fraud. We find that electoral fraud, measured by abnormal ballot counts, appears much less frequently in newly initiated industrial complex areas. Nonetheless, the negative relationship between material benefits and electoral fraud disappears when the construction of industrial complexes is completed.
The empirical investigation of this article also increases understanding of the nature of Korean politics by revealing the economic origins of political regionalism in Korean elections, a phenomenon that has defined the dynamics of South Korean politics for the past thirty years. The empirical results indicate that the industrial policy under South Korean authoritarian regimes led to an increase in support for the ruling party among advantaged electorates. Since most large-scale industrial complexes were concentrated in Gyeongnam, regional parties easily cultivated regional hostility based on unequal economic development, resulting in this long-standing political ideology in South Korea.
This study also suggests that industrial policy can serve as an effective measure of targeted economic benefits issued by the central government. Particularly in low-income countries, industrial policy is inevitably selective in nature. Hence the process of distribution entails advantaged areas or sectors and relatively alienated ones, although all citizens share the liability of investments. Furthermore, unlike cash transfers, which entail immediate personal income transfer effects, industrial investment by the government often represents large-scale, long-term economic benefits to targeted areas or sectors. We believe this offers students of comparative politics a chance to examine the causes and consequences of the unequal distribution of economic opportunities in a new light.
Despite its contributions, this study is not without limitations. First, since we infer individual voters’ preferences from the county-level outcome, even though the unit of analysis is the smallest among available election data, the interpretation cannot be completely free of concerns of an ecological fallacy. Secondly, the main argument – that direct material benefits to voters from authoritarian leaders through industrial policy can effectively alter voting behavior – may be applicable only in labor-intensive economies. Kim notes that in resource-intensive economies such as oil-rich states or mineral-exporting states, rulers can maximize state revenue without the co-operation of broad sectors of society and then distribute rents in exchange for political acquiescence, as the resource curse literature argues.Footnote 52 In these economies, unlike in labor-intensive countries, economic benefits through industrial policy may be less effective. Last but not least, although we provide evidence that electoral fraud and economic benefits are substitutes, we do not discuss why authoritarian regimes might allocate industrial complexes to certain areas while committing electoral fraud in others. These unanswered questions provide important avenues for future study.