Introduction
A brain stroke is the second most common cause of death all around the world [1, 2]. There are two main types of strokes, ischemic and hemorrhagic. It is known that the values of permittivity and conductivity of blood are higher around ~20 and 60% than permittivity and conductivity of grey and white matter on frequency 1 GHz, respectively [Reference Gabriel3]. In [Reference Semenov, Huynh, Williams, Nicholson and Vasilenko4], it was shown that permittivity and conductivity of grey and white matter decrease if affected by ischemia. Microwave imaging/tomography (MWI/MWT) can be used for non-invasive measurement of dielectric properties in the area of interest. The method is considered by the professional community to have a high potential for pre-hospital stroke detection, monitoring, and its classification [Reference Persson, Fhager, Dobsicek Trefna, Yu, McKelvey, Pegenius, Karlsson and Elam5]. The advantage of microwave technology compared to computed tomography is a potentially low cost, low weight, small dimensions, and the use of non-ionizing radiation. The main disadvantages are lower but still acceptable resolution and computationally more demanding image reconstruction. This could be addressed with computational cluster and accelerations of the numerical simulations using graphical processor units or by adapting the machine learning algorithms trained on large measured data sets. This method should provide timely, non-harmful, and quick detection and classification of strokes and thus reduce the so-called “Door to Needle Time” which is the main factor influencing the success rate of stroke treatment [Reference Fonarow, Smith, Saver, Reeves, Hernandez, Peterson, Sacco and Schwamm6].
Previously, many different antennas for microwave-based medical applications were presented in the literature, i.e. antipodal Vivaldi [Reference Fernando, Busawon, Elsdon and Smith7], double-layer bow tie [Reference Li, Jalilvand, Sit and Zwick8], rectangular waveguide-based [Reference Semenov, Hopfer, Planas, Hamidipour and Henriksson9], metamaterial-based [Reference Vrba and Vrba10], planar monopole [Reference Tobon Vasquez, Scapaticci, Turvani, Bellizzi, Joachimowicz, Duchêne, Tedeschi, Casu, Crocco and Vipiana11], monopole [Reference Meaney, Fanning, Raynolds, Fox, Fang, Kogel, Poplack and Paulsen12], triangular patch [Reference Persson, Fhager, Dobsicek Trefna, Yu, McKelvey, Pegenius, Karlsson and Elam5, Reference Trefná and Persson13], and self-grounded bow tie [Reference Takook, Persson, Gellermann and Trefná14] or slotted dipole antenna [Reference Mobashsher, Abbosh and Wang15]. Especially the rectangular waveguide-based, planar monopole, monopole, triangular patch, and slotted dipole antenna are considered as transmitters/receivers in MWI/MWT systems for brain stroke detection and classification. The design of an antenna element (AE) is a crucial challenge during the development of MWI systems. In order to reduce the reflection of electromagnetic (EM) waves when entering the skin, a matching/coupling medium is often used in microwave medical imaging systems. AEs must be designed with respect to surrounding high permittivity and lossy coupling medium and imaged biological tissues. The magnitudes of transmission coefficients between AEs of the MWI systems for brain stroke detection depend, among others, on used AEs and dielectric properties of the coupling medium. Further, the optimal operating frequency range needs to be determined. An optimal ratio between penetration depth of EM wave and spatial resolution is a key factor for the design of antennas and MWI systems. The most convenient frequency range related to the required balance between penetration depth of EM wave and spatial resolution is in the range from 0.6 to 1.5 GHz according to the study of Scapaticci et al. [Reference Scapaticci, Di Donato, Catapano and Crocco16, Reference Scapaticci, Bucci, Catapano and Crocco17]. In MWI systems designed at CTU in Prague, Faculty of Biomedical Engineering, different antenna types (bow tie [Reference Tesarik, Fiser, Diaz, Lhotska, Sukupova, Lacković and Ibbott18] and slot [Reference Merunka, Massa, Vrba, Fiser, Salucci and Vrba19]) were previously used. It was demonstrated in [Reference Tesarik, Fiser, Diaz, Lhotska, Sukupova, Lacković and Ibbott18, Reference Merunka, Massa, Vrba, Fiser, Salucci and Vrba19] that MWI systems could be very sensitive to interferences with the surrounding and also that the omnidirectional antenna radiation can increase these interferences as well as cross-coupling among AEs. The MWI systems can be enclosed with microwave pyramid absorbers in order to eliminate these negative effects. Another approach is to design AE which will radiate predominantly to the region of interest.
The main purpose of this study was to develop a new compact AE suitable for a multichannel (>20 antennae) MWI system for brain stroke detection. The antenna requirements as a reasonable change of transmission coefficient due to dielectric contrast and one-directional radiation were determined. In the first step, we analyzed by means of numerical simulations three standard AEs, i.e. bow tie, slot, and rectangular waveguide-based antenna. Specifically, two different numerical analyses were carried out: (1) antennas sensitivity to stroke phantom type or dielectric properties change and (2) antennas sensitivity on stroke phantom diameter as presented also in [Reference Tesarik and Pokorny20]. The transmission coefficients for each of the studied AE were compared among each other. Also, the antenna ability to radiate dominantly only to the investigation (front) domain and antenna immunity against plane wave exposure were studied. Further, based on numerical analysis results, the new H-slot antenna was developed, fabricated, and experimentally verified using and for this purpose constructed two-port test system consisting of a liquid head phantom and stroke phantom in the second step. The transmission coefficients for the scenario with and without the presence of stroke phantom inside the system were measured and compared against numerical simulations. Last, the H-slot antenna radiation analysis and immunity against plane wave exposure were evaluated and compared with the results of other three introduced antennae.
This paper is organized as follows: AE types used in the numerical study are introduced in section “Antenna element types”. The sensitivity of these antennas on dielectric contrast is studied in section “Numerical study” where we also suggested the method for evaluation of antenna radiation and analyzed the antennae immunity against a plane wave exposure. In section “H-slot antenna element”, we developed new H-slot AE based on results provided by the numerical study from section “Numerical study” and experimentally verified it. The major findings are discussed in section “Discussion” and summarized in section “Conclusion” together with future work planned.
Antenna element types
In this work, different planar antenna types and a rectangular waveguide-based antenna were analyzed.
Planar antennas
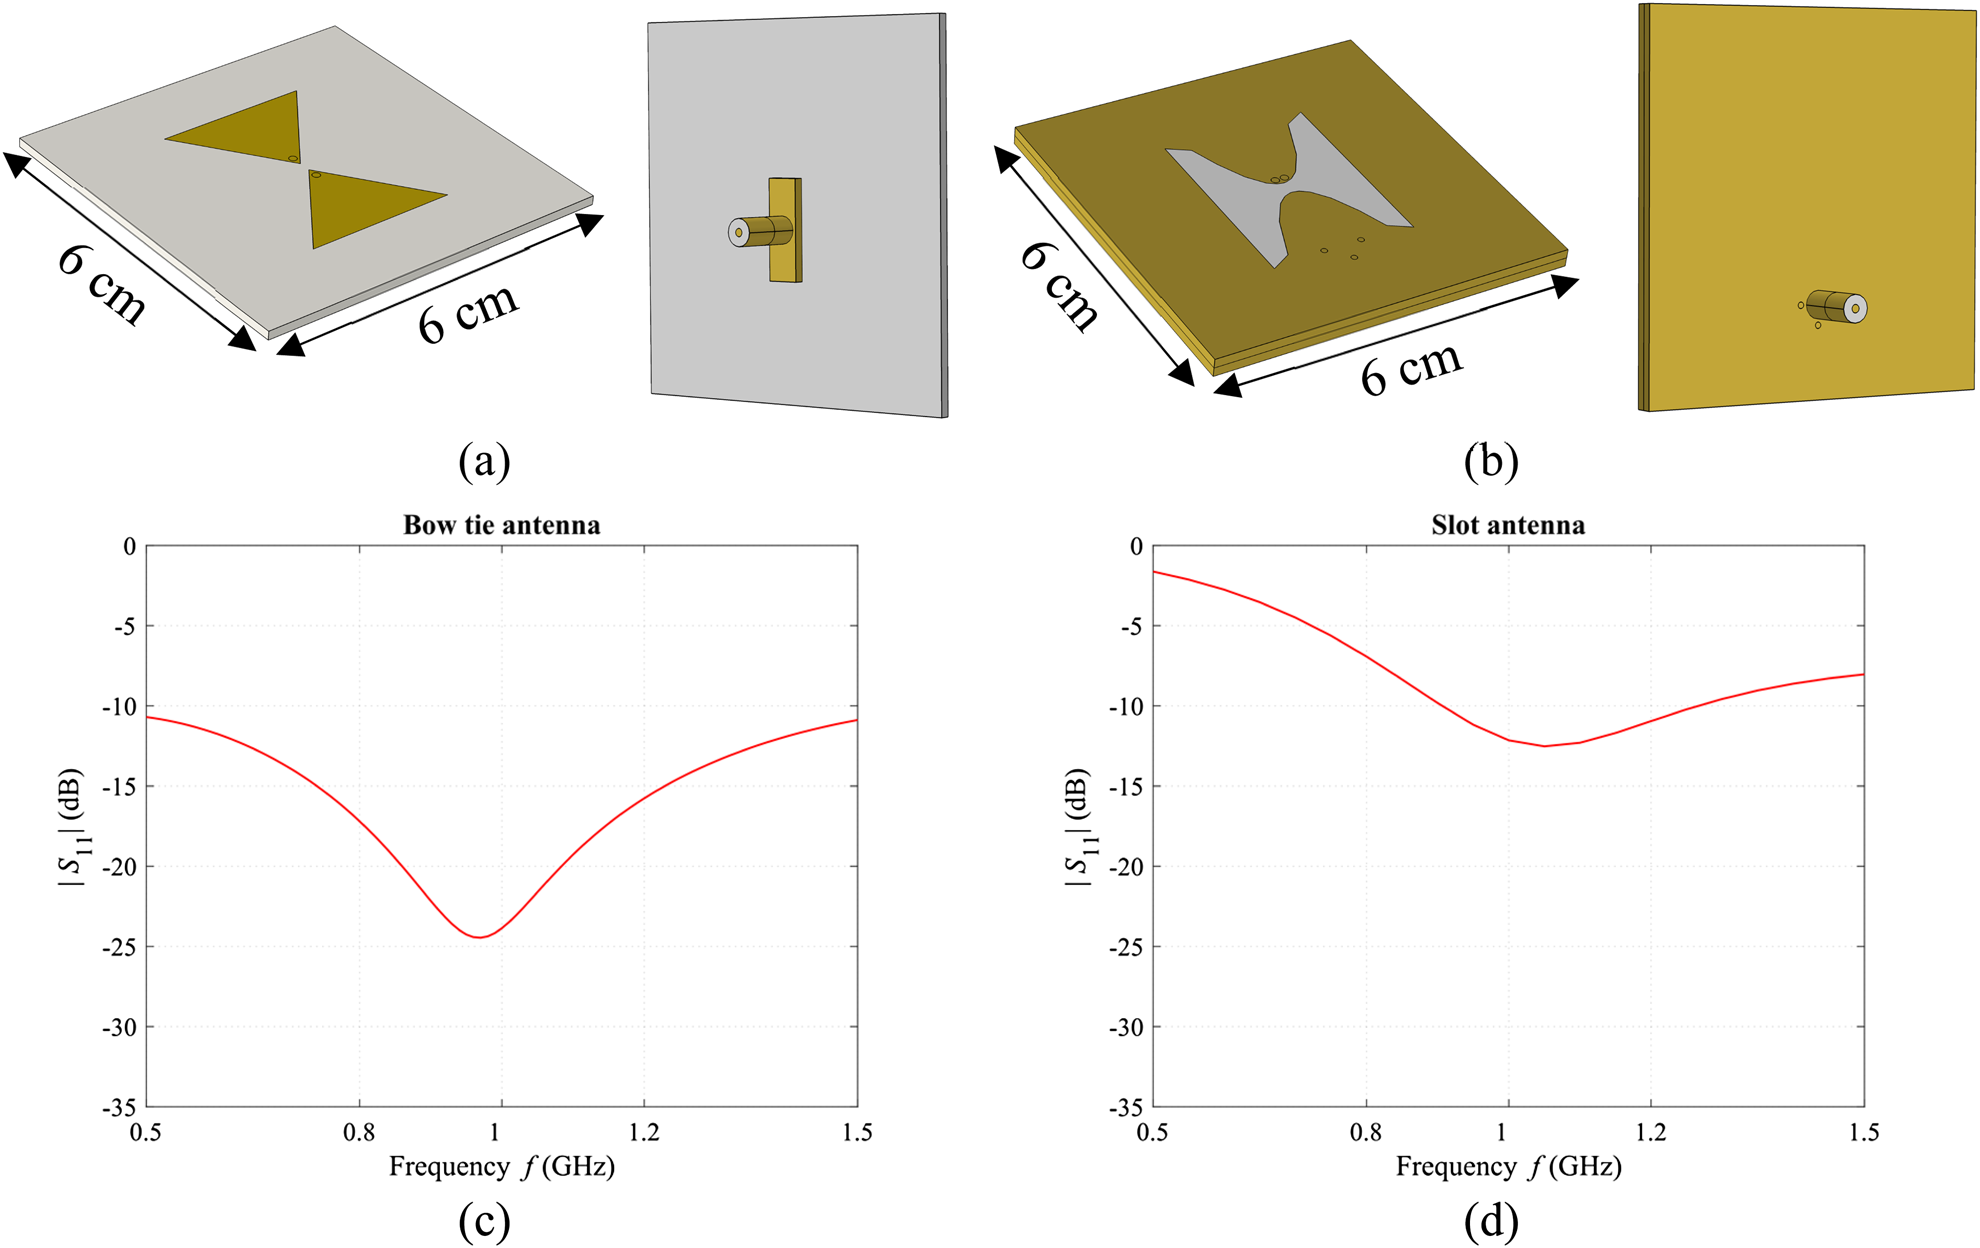
The bow tie antenna [Reference Tesarik, Fiser, Diaz, Lhotska, Sukupova, Lacković and Ibbott18] and slot antenna [Reference Merunka, Fiser, Vrba and Vrba21] used in this study are shown in Figs 1(a) and 1(b). Both antennas were developed for the operating frequency of 1 GHz on 60 × 60 mm RF substrate Rogers R04003C with a thickness of 1.5 mm (for slot antenna, the two substrates were used). Impedance matching (|S 11| < −10 dB) at 1 GHz for average head phantom of ɛ r = 41.8 and σ = 0.97 S/m was obtained for both antennas as depicted in Figs 1(c) and 1(d). Dielectric parameters of the head phantom prepared as a mixture of propylene glycol, water, and salt were adopted from [22]. Antennas were fed by 50 Ω coaxial line and panel SMA connector.
Numerical models of considered antenna elements with dimensions (cm) and feeding structure, bow tie antenna (a) and slot antenna (b). The metal parts are marked in yellow, while the RF substrate and Teflon is grey coloured. The reflection coefficients of antennas are shown in (c) and (d).

Rectangular waveguide-based antenna
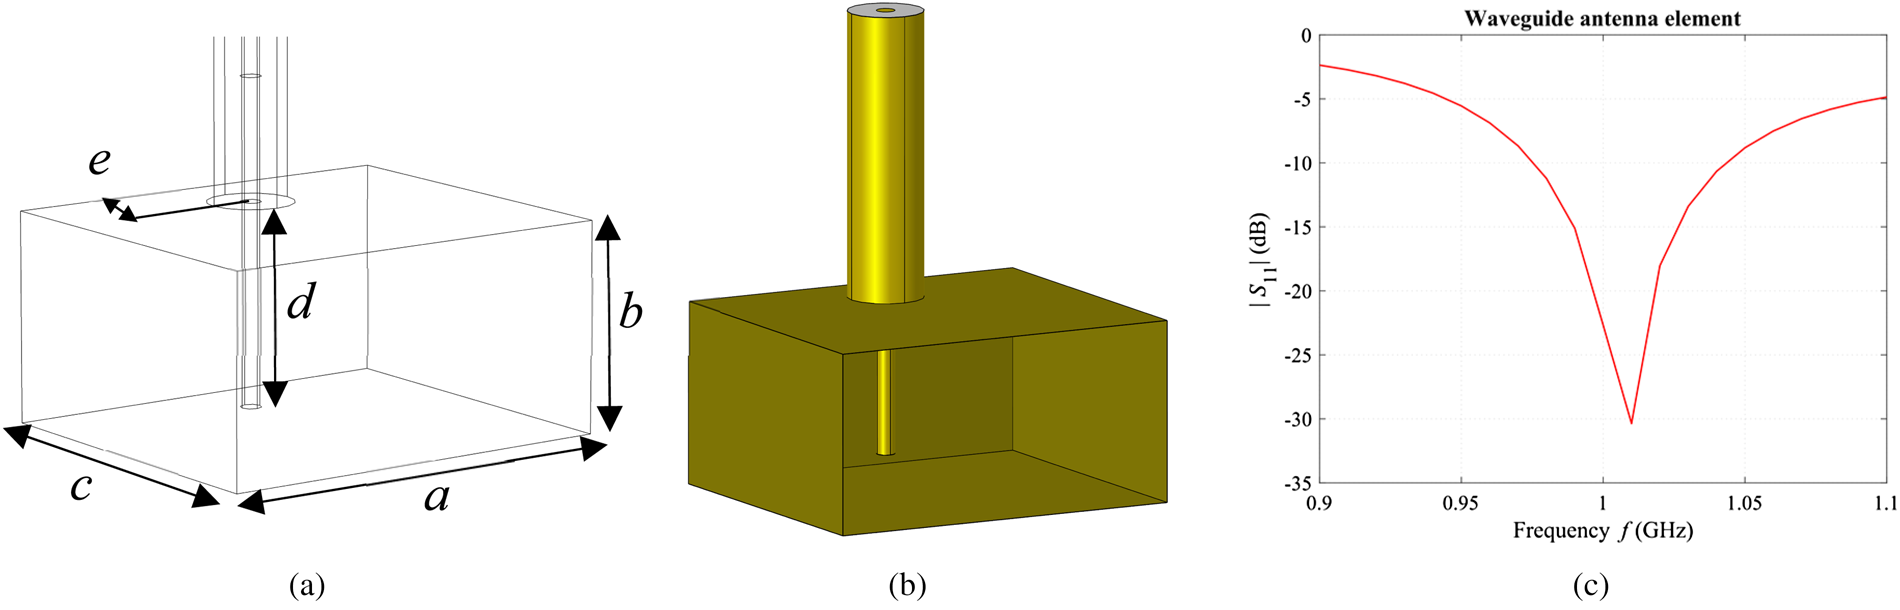
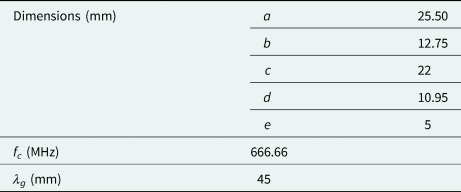
Rectangular waveguide-based AE was designed to operate in TE 10 mode based on analytical equations adopted from [Reference Vrba23]. Deionized water (ɛ r~78 and σ~0.2 S/m for 1 GHz and 22 °C [Reference Ellison24]) was filled inside the inner space of the antenna to reduce waveguide dimensions. Numerical parametric study in COMSOL Multiphysics to determine the value of parameter e and the parameter d was done (see Fig. 2(a)). A water bolus with a width of 1 cm was placed between head phantom and aperture of the waveguide-based element to ensure proper coupling of EM wave. The dimensions of the designed waveguide-based element together with its specifications are summarized in Table 1 and its image is shown in Figs 2(a) and 2(b). Reflection coefficient for average head phantom (ɛ r = 41.8 and σ = 0.97 S/m) and operating frequency (1 GHz) was obtained as shown in Fig. 2(c).
The numerical model of designed waveguide-based antenna element with its parameters (a), yellow-marked metal parts, grey-marked Teflon (b), and its reflection coefficient (c).

Dimensions of the designed waveguide-based antenna element and its specifications

f c (MHz) is the cut-off frequency and λ g (mm) is the guided wavelength inside the used water-filled waveguide section.
Numerical study
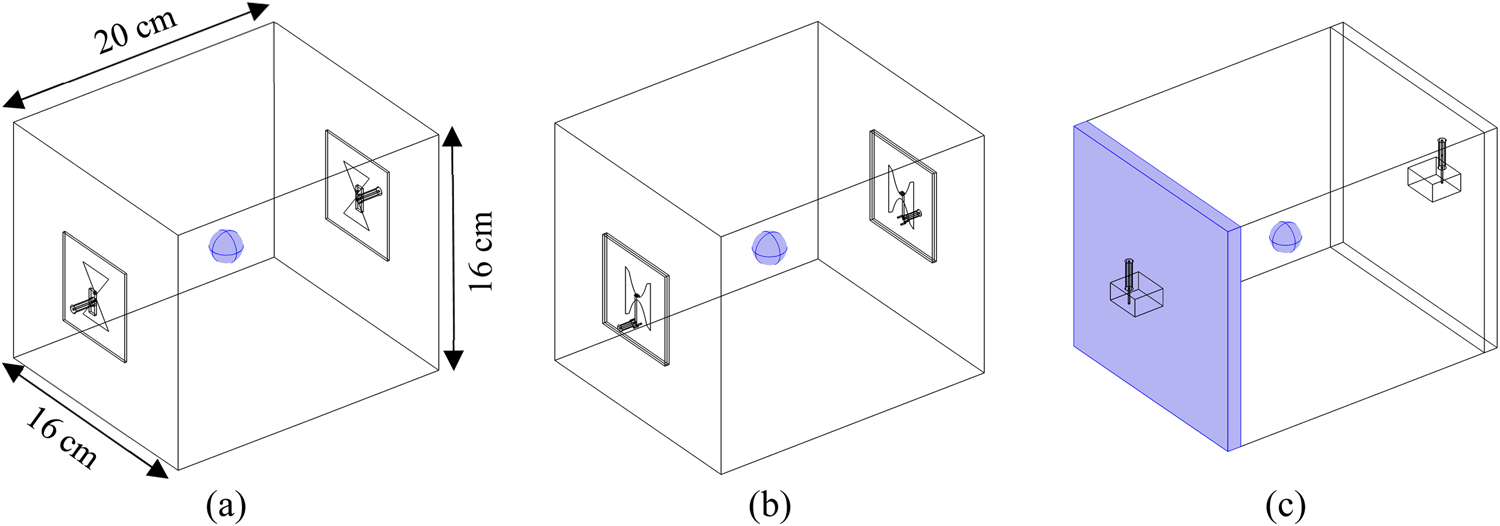
We compared the sensitivity of transmission coefficients to the dielectric parameter changes and variations in radiation characteristics for antennae introduced in section “Antenna element types”. A simplified rectangular model/phantom of a human head with respect to real dimensions of a human head in x-axis = 16 cm, y-axis = 20 cm, and z-axis = 16 cm was modeled in COMSOL Multiphysics. The dimensions of the model were adopted from MRI scans originating from IT´IS database [Reference Lee, Hadimani and Jiles25]. Introduced antennas were placed opposite to each other in the longer x-axis and perfect contact between antennas and head phantom (ɛ r = 41.8 and σ = 0.97 S/m) was secured as illustrated in Fig. 3.
The numerical models for evaluation of the sensitivity of the transmission coefficient for each considered antenna on the change of dielectric parameters of stroke phantom and its diameter. Bow tie (a), slot (b), and rectangular waveguide-based antenna (c) where x = 16 cm, y = 20 cm, and z = 16 cm. A stroke phantom and water bolus are blue marked.

Between waveguides and head phantom, a 1 cm width water bolus was placed to ensure proper EM wave coupling. In the middle of the head phantom, a spherical stroke phantom of different diameters with different dielectric parameters was virtually placed. Evaluation of the transmission coefficient sensitivity for different antenna types to the change of dielectric parameters was done in two stages (A – change of dielectric parameters of stroke phantom and B – change of diameter of stroke phantom) as described below. Numerical simulations in the frequency range from 0.9 to 1.1 GHz with a step of 10 MHz were performed. The magnitudes and phases of transmission coefficients |S 21| (dB) and  $\angle $S 21 (°) were obtained.
Change of dielectric parameters of stroke phantom
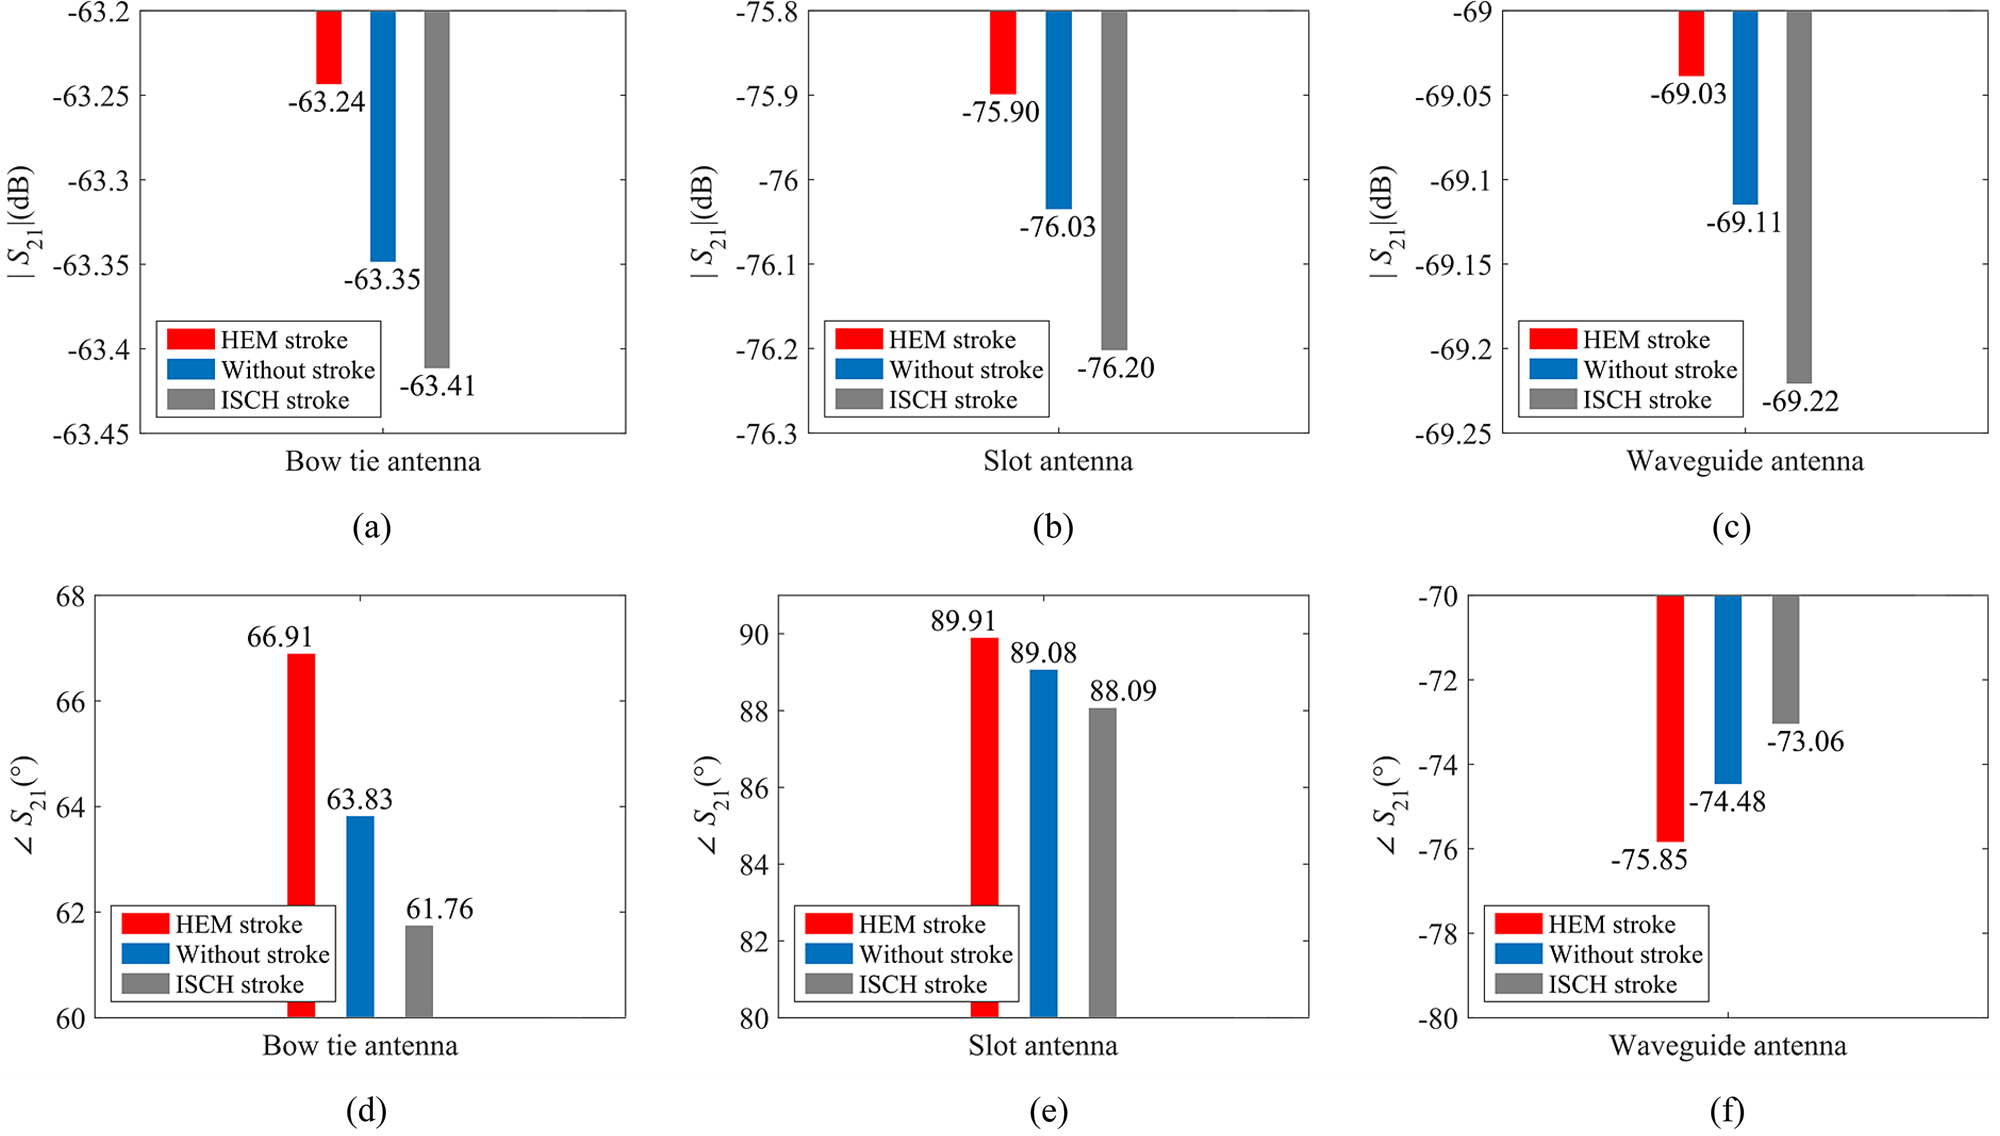
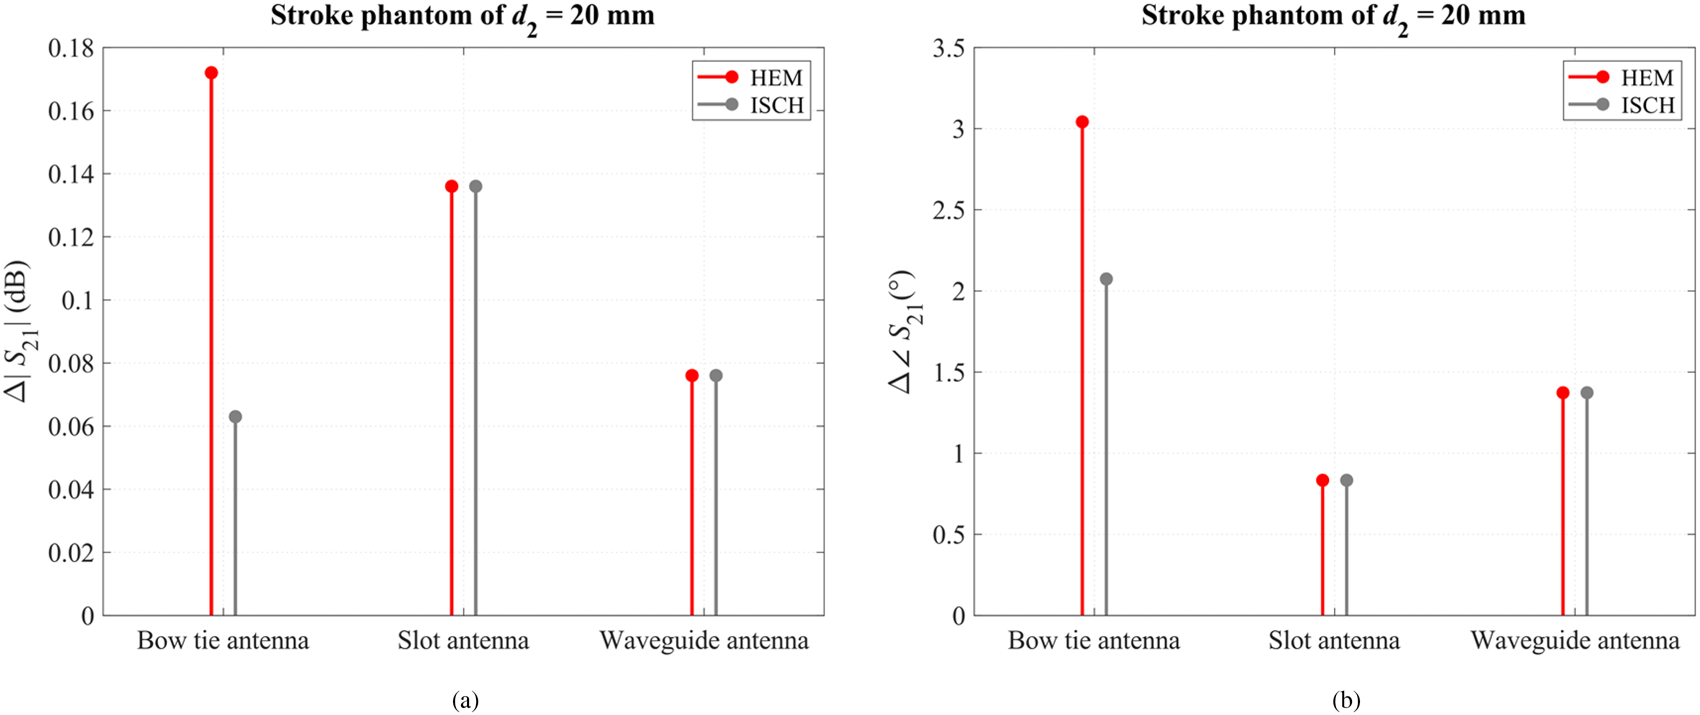
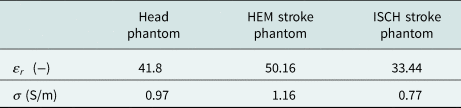
The stroke phantom with a diameter of d 2 = 20 mm was placed in the middle of the head phantom. This diameter was chosen regarding the theoretical λ/2 spatial resolution limit of MWI method (i.e. diffraction limit [Reference Nikolova26, Reference Tajik, Trac and Nikolova27]) inside the head phantom of the relative permittivity of 41.8 at frequency 1 GHz. The central position represented the case when the S-parameters are the least affected and thus it is most challenging to reconstruct the distribution of complex permittivity if we consider MWI application for brain stroke monitoring. Dielectric parameters of stroke phantom were increased (HEM – hemorrhagic stroke) as well as decreased (ISCH – ischemic stroke) about 20% compared to dielectric parameters of head phantom as summarized in Table 2. The magnitudes and phases of transmission coefficients for the scenario without stroke phantom inside the head phantom and with a HEM/ISCH stroke phantom of diameter 20 mm for each of considered antennas were computed and are plotted in Fig. 4. Absolute differences Δ of magnitude and phase of transmission coefficients for each antenna are shown in Fig. 5. The simulations were computed for a single frequency of 1 GHz.
The magnitudes and phases of transmission coefficient S 21 of bow tie antenna (a) and (d), slot antenna (b) and (e), and waveguide-based antenna (c) and (f) for the scenario without stroke phantom placed inside the head phantom and with  $\emptyset $20 mm HEM/ISCH stroke phantom. The single frequency of 1 GHz was considered.

The absolute differences of Δ|S 21| (dB) between scenario without stroke phantom placed in head phantom and with HEM/ISCH stroke phantom placed in head phantom (a) and Δ $\angle $S 21 (°) (b) for considered antennae and frequency of 1 GHz.

Dielectric parameters of head phantom [22] and HEM and ISCH stroke phantoms which were calculated as 20% increase/decrease of dielectric parameters of the head phantom

Change of diameter of stroke phantom
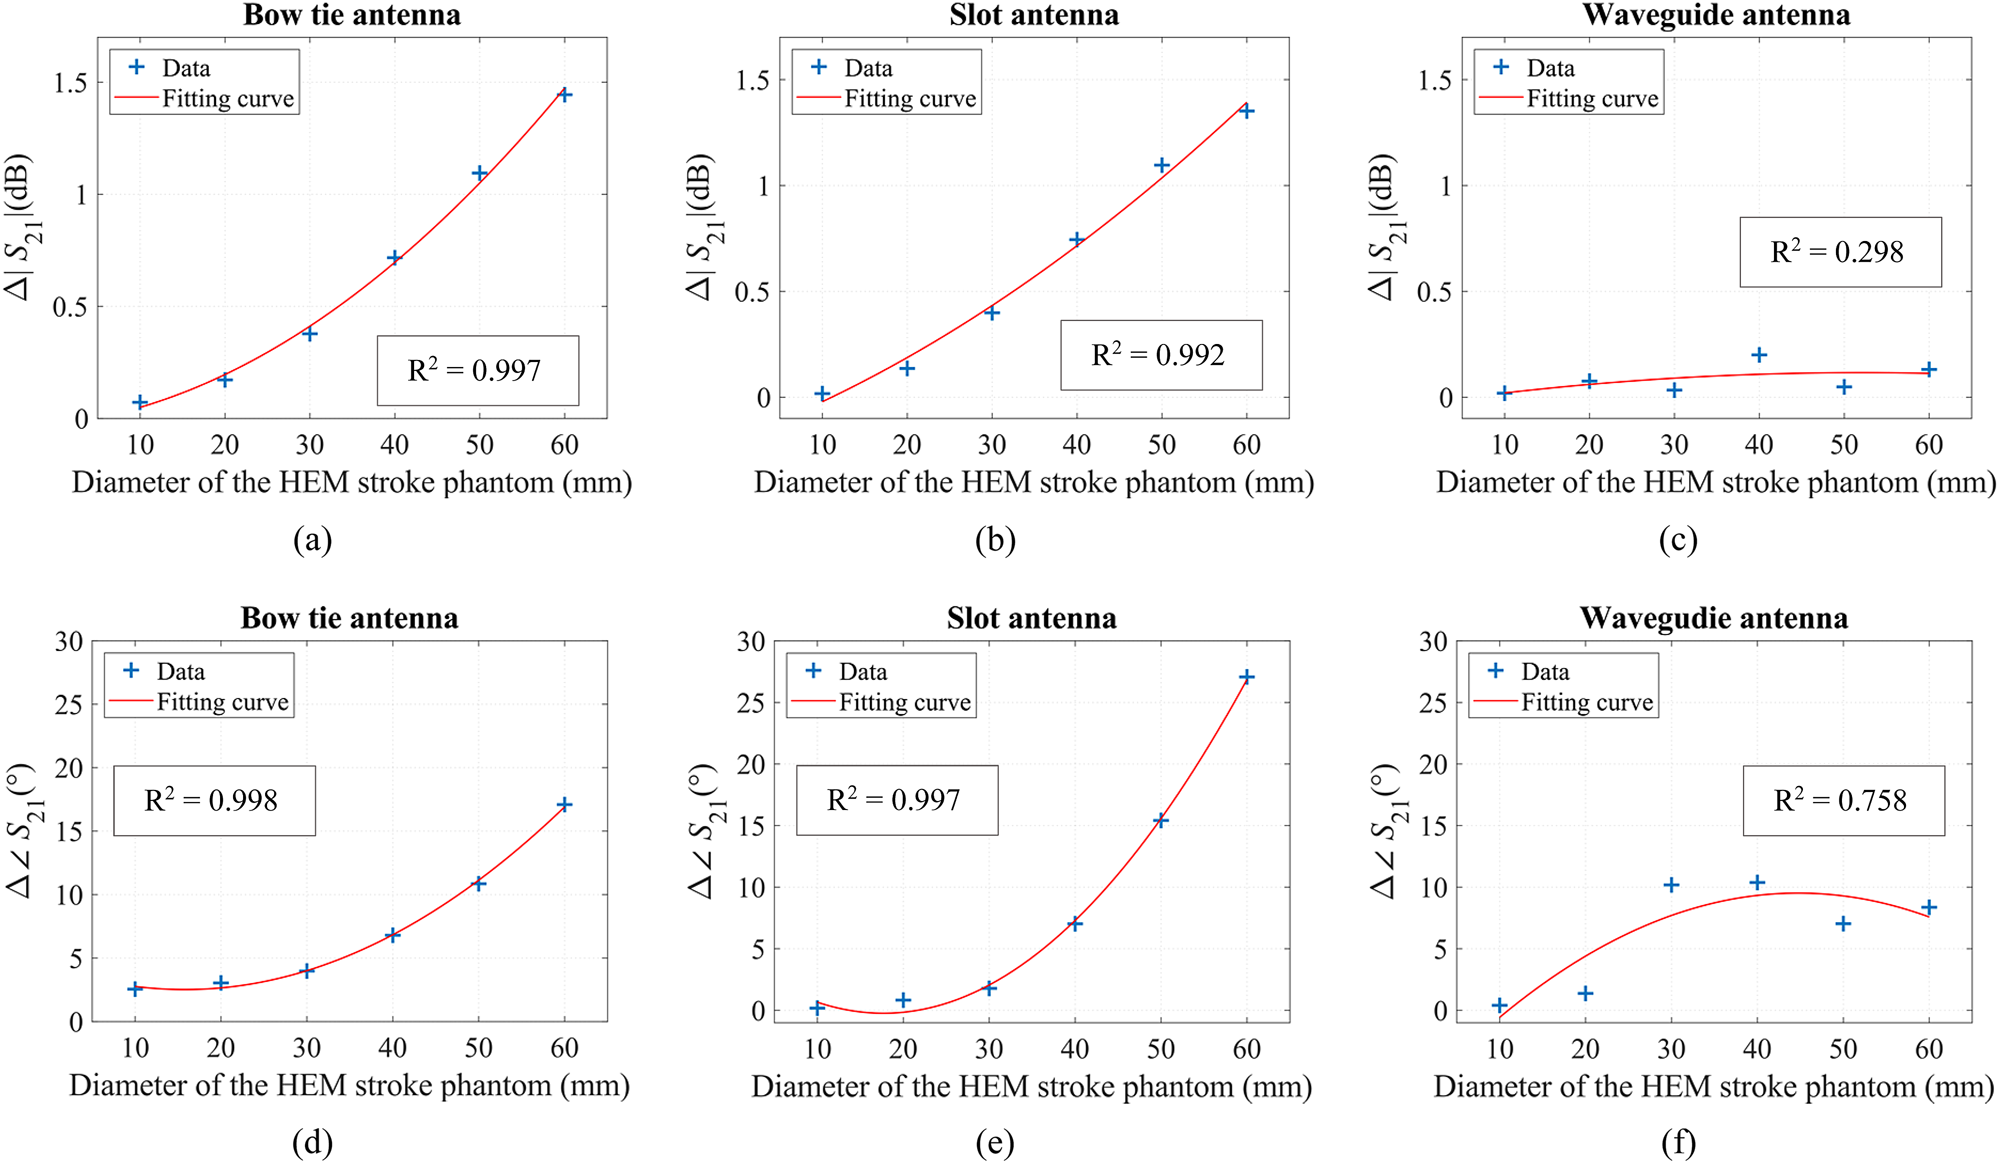
HEM stroke phantoms with six different diameters d 1 − d 6 = 10–60 mm were placed to the center of the head phantom. The numerical differences of magnitude and phase of transmission coefficients at 1 GHz were fitted by second-order polynomial curve, and Pearson's correlation coefficient R 2 on 95% confidence interval was calculated. These results for each antenna type are shown in Fig. 6.
The absolute differences Δ|S 21| (dB) and Δ $\angle $S 21 (°) between scenario without stroke phantom placed in head phantom and with HEM stroke phantom of diameters going from 10 to 60 mm for the bow tie antenna (a) and (d), for the slot antenna (b) and (e), and for the waveguide-based antenna (c) and (f). Obtained results were fitted by second-order polynomial function and Pearson's correlation coefficient R 2 on 95% confidence interval were calculated.

Antenna radiation and immunity testing to plane wave exposure
We determined the antenna radiation intensity to back domain (air) compared to radiation into lossy medium and we also determined antenna immunity against a plane wave exposure. The standard method for determination of the antennae radiation is to calculate the radiation pattern. With respect to the antenna theory, the radiation pattern is defined in the far-field region; it is hardly applicable for antennae used in the near-field region such as MWI applications. The distance of the far-field region can be calculated as the so-called Fraunhofer distance d F (1)
 $$d_F = \displaystyle{{2D^2} \over \lambda }\comma \;$$
where D (m) is the largest linear dimension of the radiator and λ (m) the wavelength in the given medium. At the same time, the Fraunhofer distance must be much greater than the largest radiator dimension D and D must be much greater compared to wavelength [Reference Balanis28, Reference Pozar29]. Introduced antennae operate in MWI systems in distance up to 20 cm which is an average front-back dimension of a human head [Reference Lee, Hadimani and Jiles25]. Also, for radiation pattern evaluation, the lossless medium needs to be considered. However, in the application of MWI for brain stroke monitoring, typically the lossy medium (human head) is placed in front of the antenna whereas the air is behind the antenna.
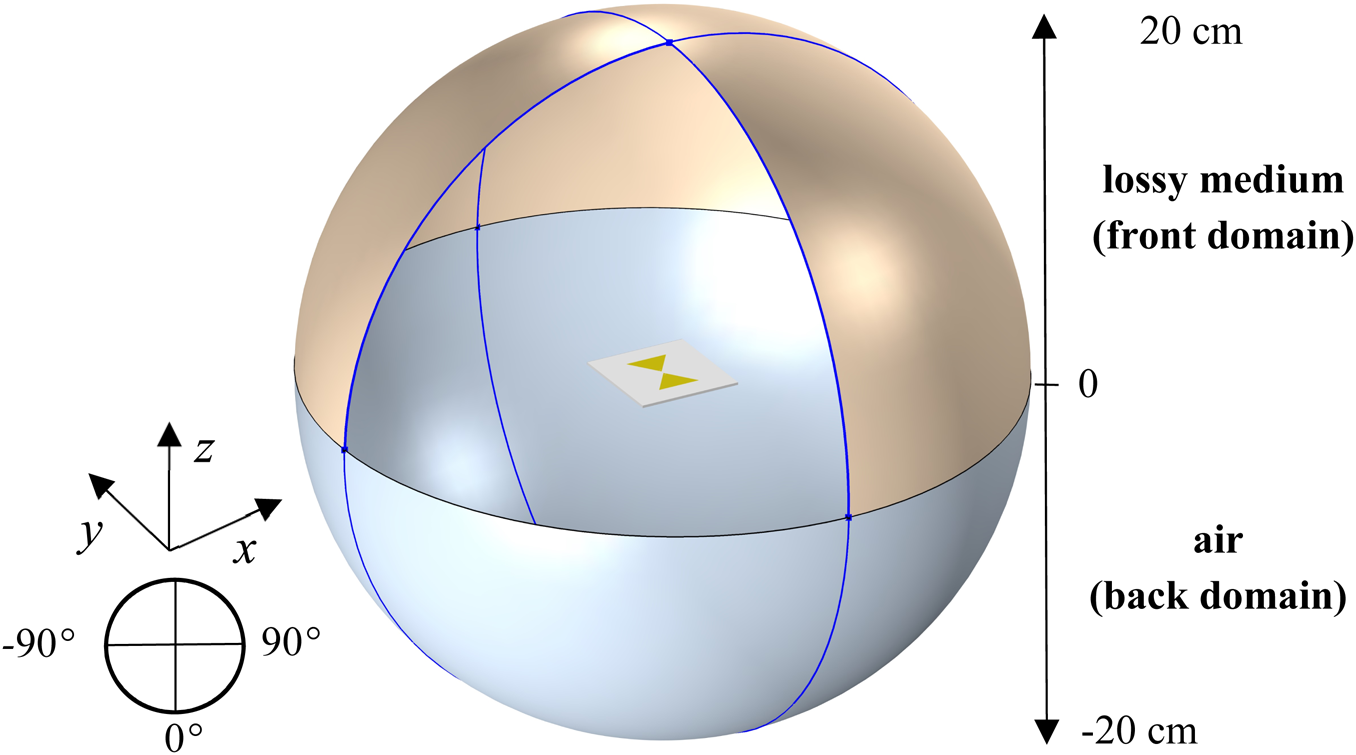
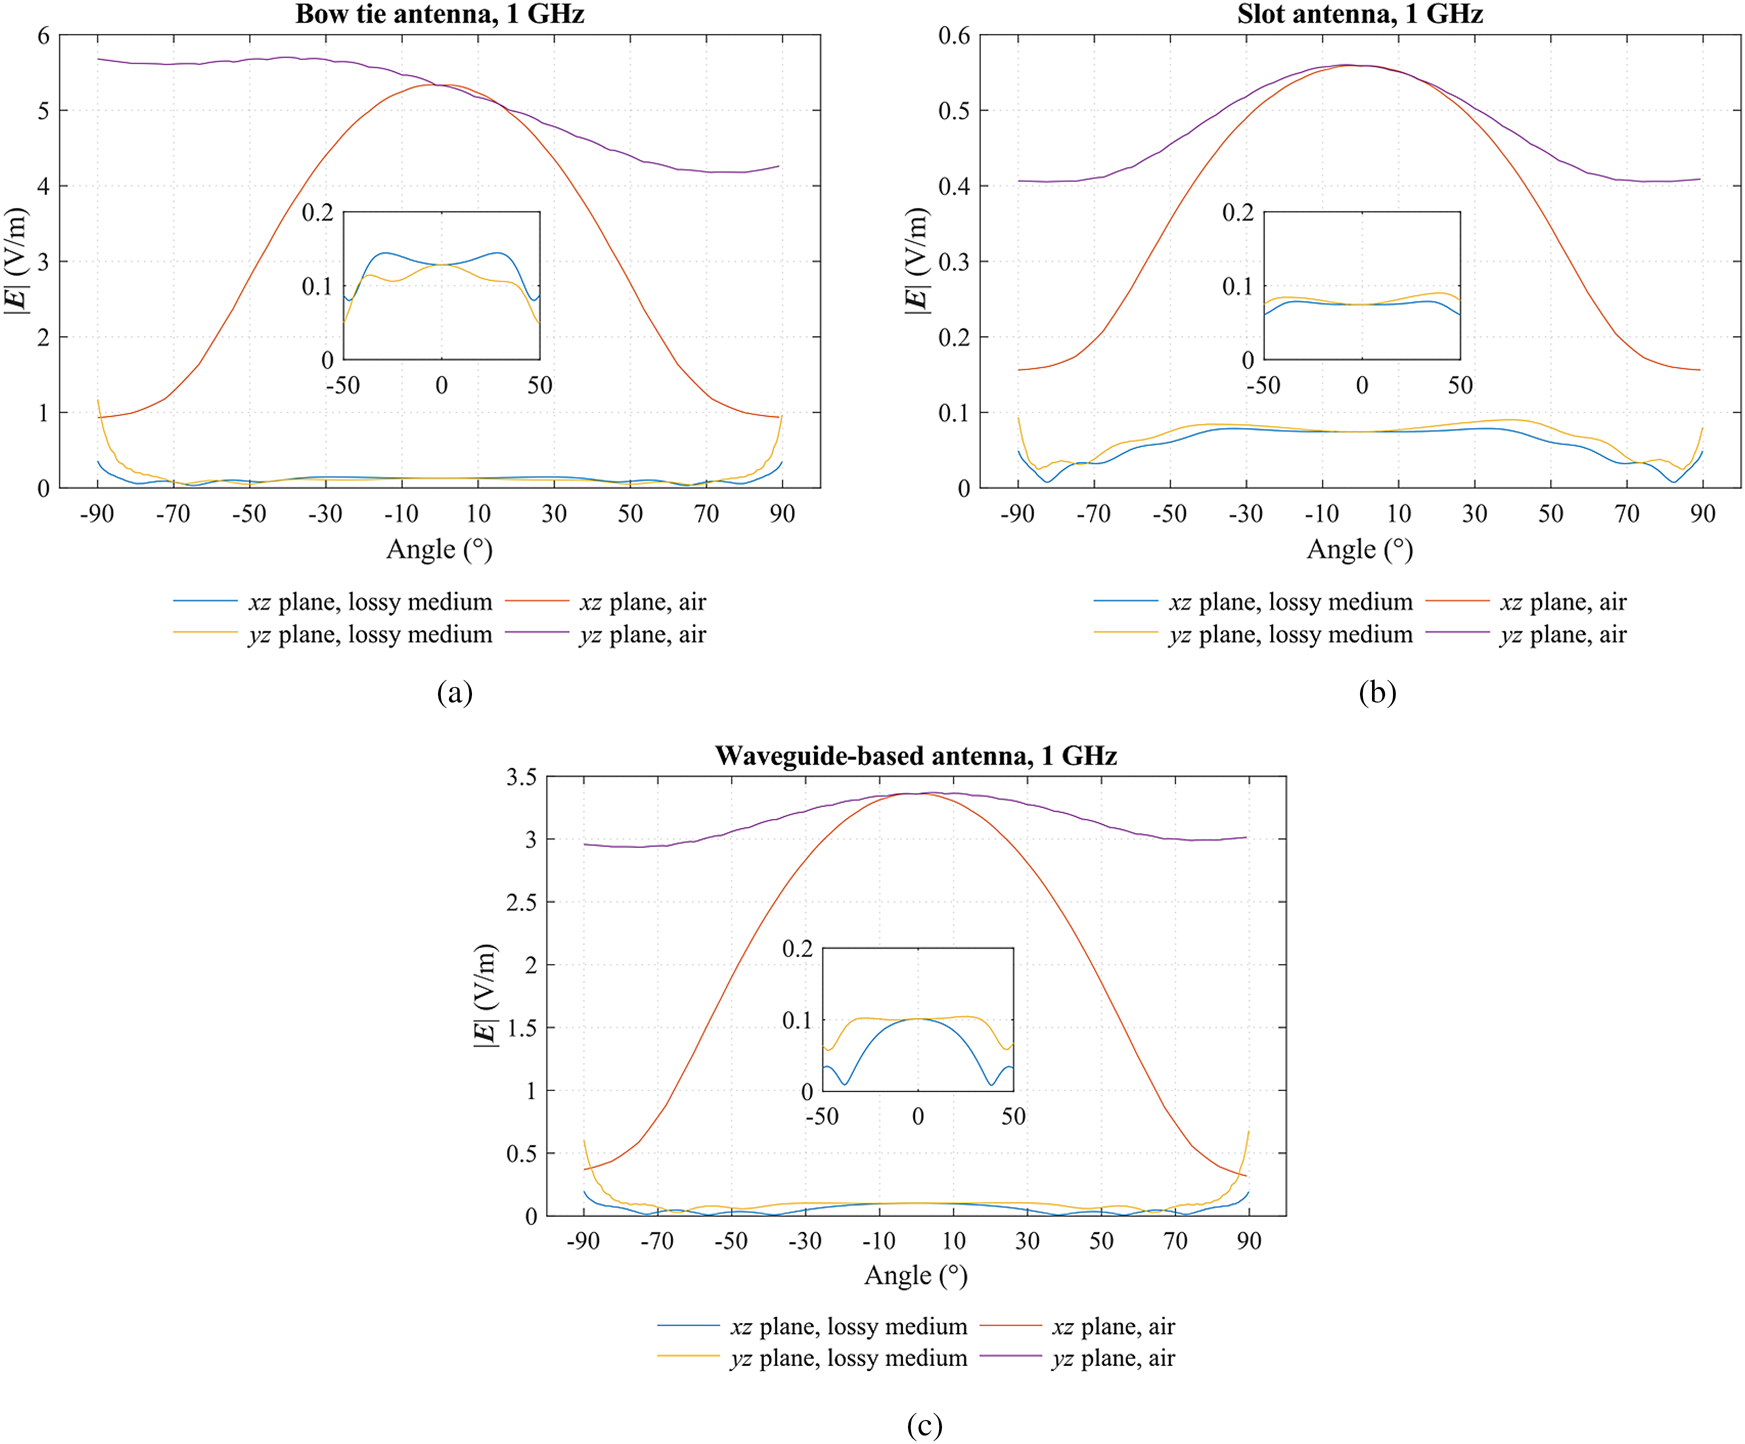
To overcome this limitation, we suggested the sphere with a diameter of 20 cm surrounding each of antenna. The front domain (hemisphere) was defined as lossy medium (head phantom) of relative permittivity 41.8 and electrical conductivity 0.97 S/m and the back domain was specified as air. The numerical model is shown in Fig. 7. The magnitude of the intensity of the electric field | E|(V/m) excitated by each AE depending on the angle (°) in xz and yz plane (H- and E-plane) for the front as well as the back domain was evaluated and is presented in Fig. 8. The electric field intensities were computed along the blue marked edges displayed in Fig. 7. In each plane, the angle was evaluated from −90 to 90° regarding the antenna position (top and bottom of hemisphere stand for angle 0°, respectively).
The example of the numerical model of a sphere with a radius of 20 cm surrounding the bow tie antenna element. The position of all antennae regarding the axes orientation was equal with respect to antennae polarization. The blue edges mark where |E| (V/m) depended on angle was evaluated.

The computed magnitudes of the intensity of the electric field |E| (V/m) depended on angle (°), medium (lossy medium versus air) and observation plane for bow tie antenna (a), slot antenna (b), and waveguide-based antenna (c).

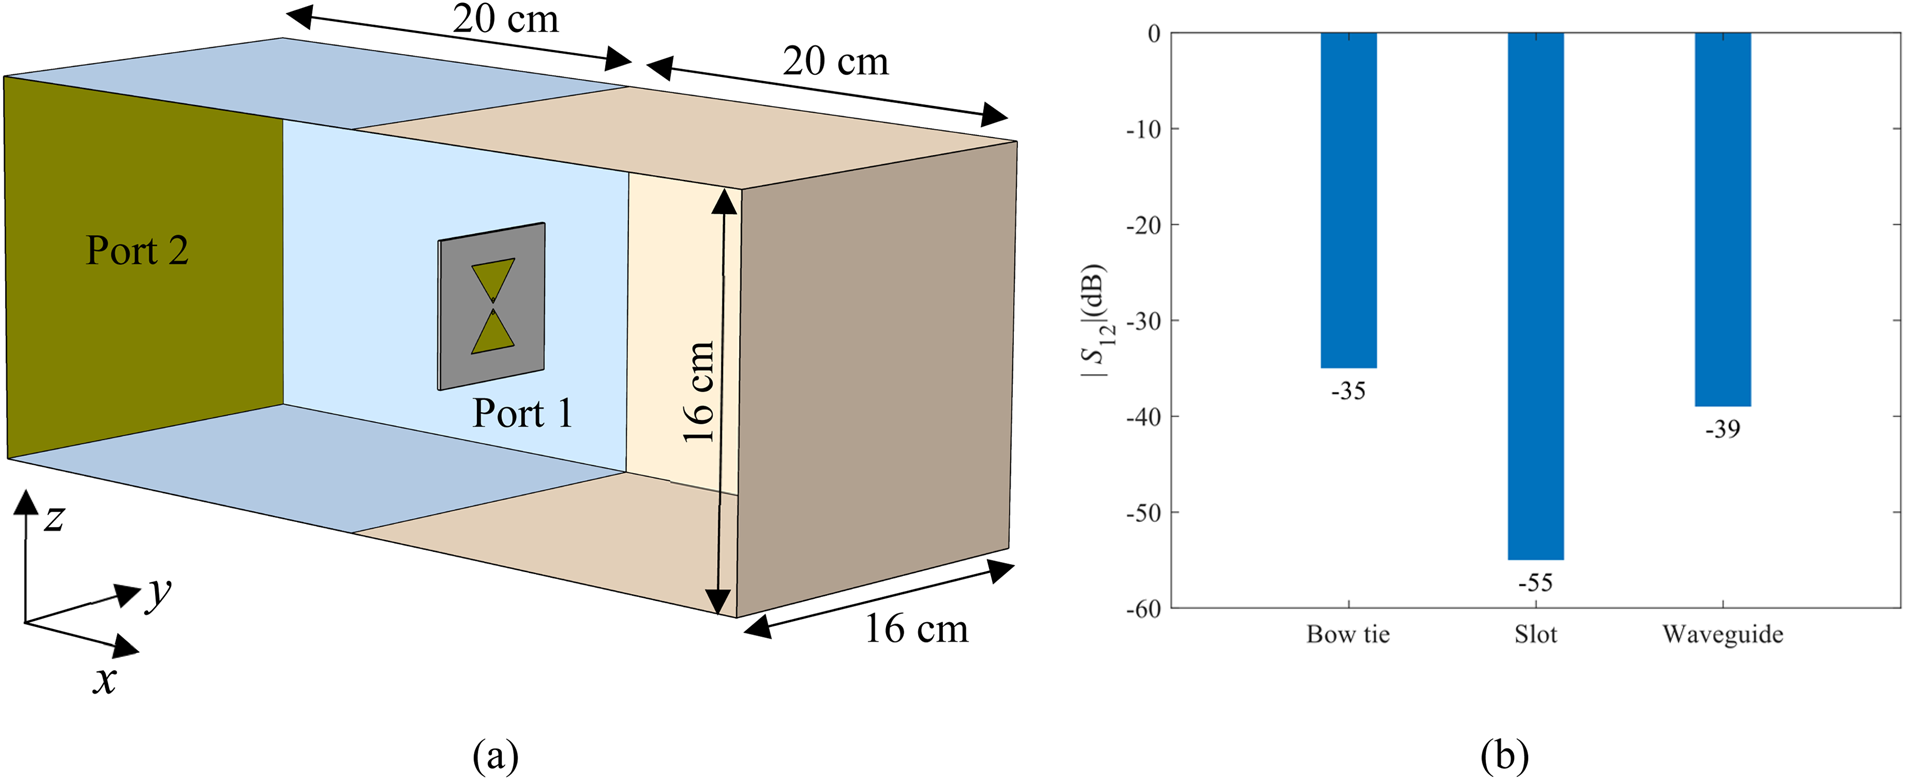
To evaluate antennae immunity against the plane wave exposure, the rectangular model combining the lossy medium (front domain) and air (back domain) was designed as shown in Fig. 9(a). The user-defined Port 2 as a source of the plane wave of | Ez| = 1 V/m with propagation constant β was excitated by a frequency of 1 GHz, while the Port 1 was set as 50 Ω coaxial receiving port (Fig. 1(a)). The result of the numerical study was magnitudes of transmission coefficient |S 12| (dB) of each of the examined antennae which are compared in Fig. 9(b).
The model for evaluation of antenna immunity against the plane wave exposure (a) where the lossy medium is a light orange coloured and the air is a light blue. Comparison of magnitudes of transmission coefficients |S 12| (dB) of each model with the corresponding antenna (b). The Port 2 (transmitting port) was user-defined as a source of |E z| = 1 V/m with propagation constant β (m−1) and was excitated by frequency 1 GHz. The Port 1 was set as 50 Ω coaxial receiving port as shown in Fig. 1a.

H-slot antenna element
With respect to the concept of slot antenna introduced in [Reference Merunka, Massa, Vrba, Fiser, Salucci and Vrba19], a new H-slot antenna was designed in this work. The goal of the design process was to reduce antenna dimension and at the same time preserve the impedance matching and symmetrical radiation of the electric field at the operation frequency 1 GHz. The small dimensions of the AE are required to fit 24 elements into MWI system which numerical model was presented in [Reference Tesarik and Vrba30].
Design and fabrication
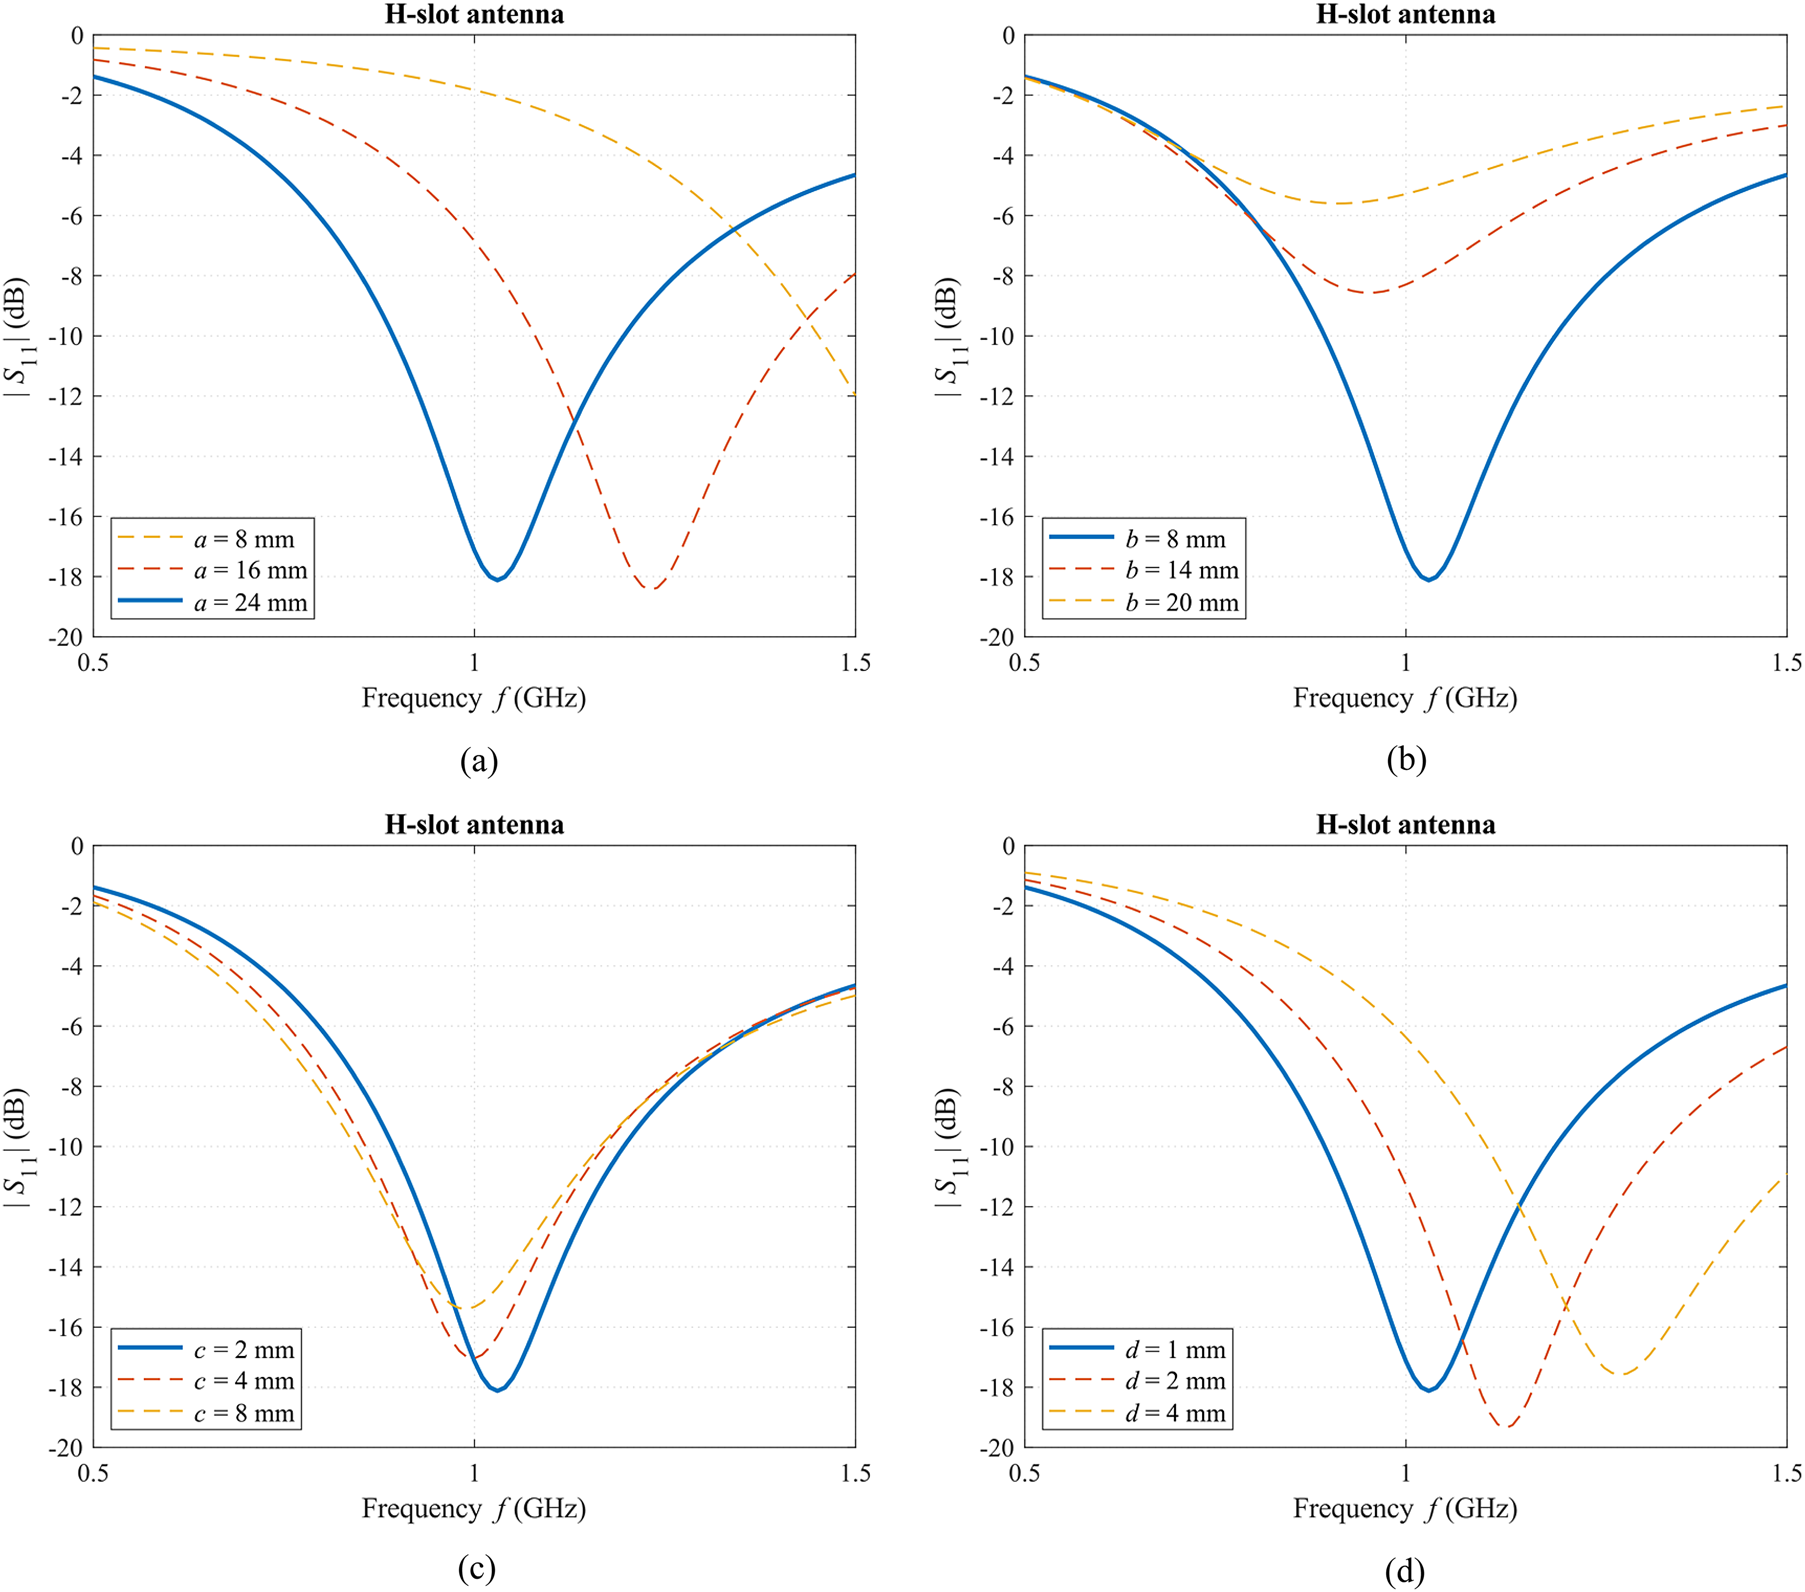
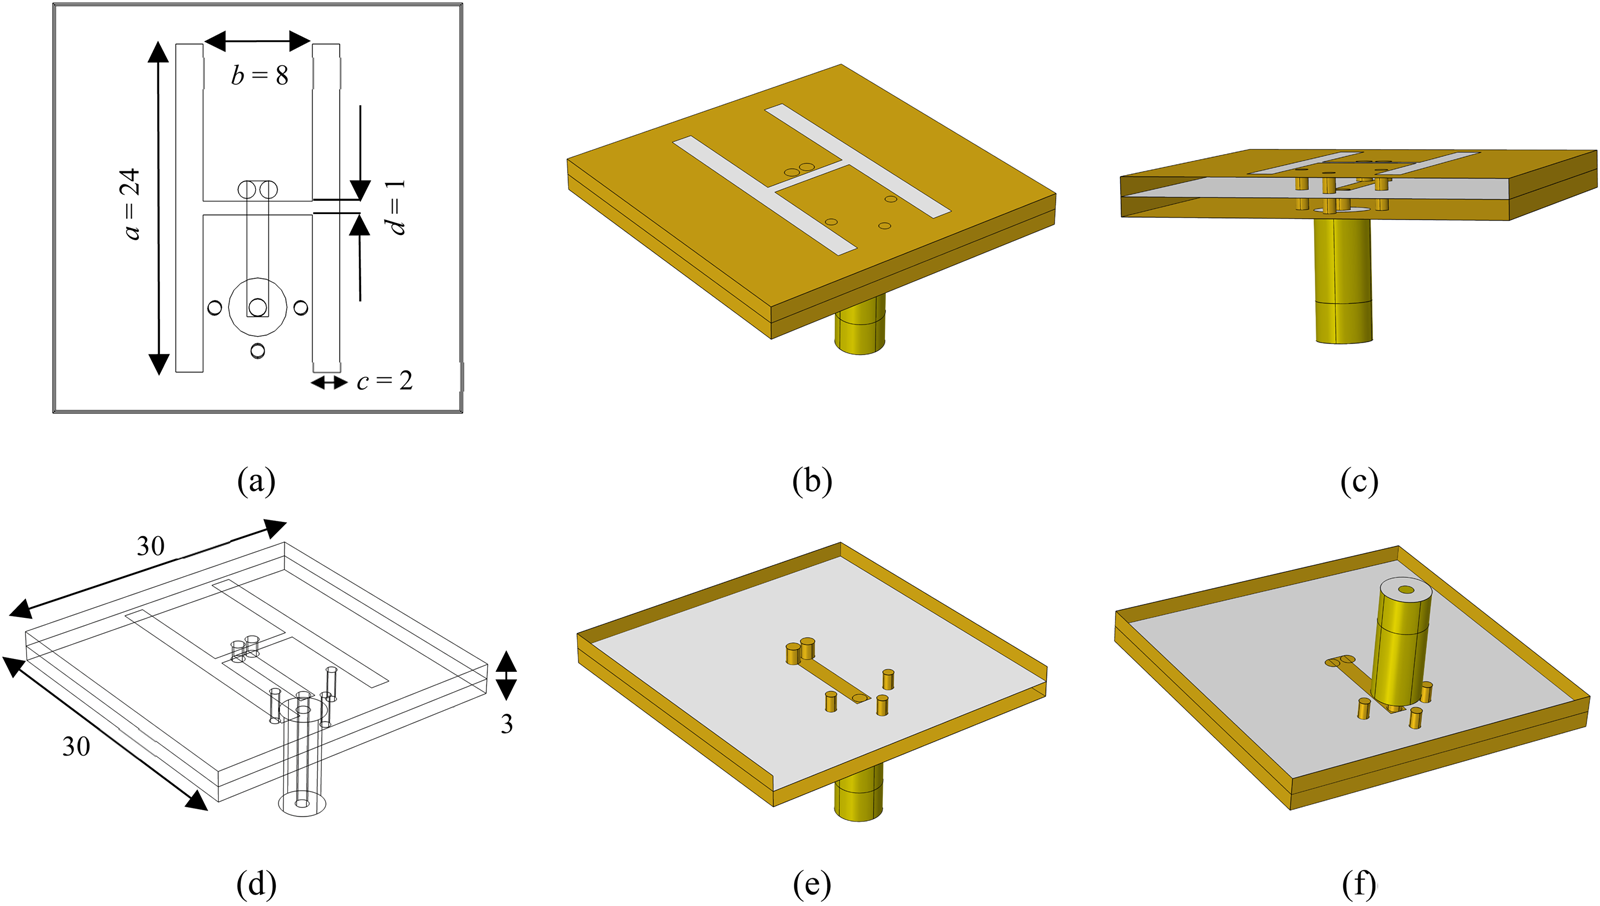
A numerical model of H-slot antenna was created in COMSOL Multiphysics. The distorted bow tie slot shape of antenna introduced in [Reference Merunka, Massa, Vrba, Fiser, Salucci and Vrba19] was modified to the shape of H. This shape can be much easily parametrized and also can be more suitable for numerical simulators of EM field based on FDTD due to its rectangularity. The dimensions of the H-slot were obtained by the numerical parametric study to achieve the magnitude of the reflection coefficient |S 11| < −10 dB at the center frequency of 1 GHz which is shown in Figs 10(a–d). The final dimensions of the proposed H-slot antenna are reported in Figs 11(a) and 11(d).
The magnitude of S 11 (dB) obtained by parametric study for different dimensions of H-slot of H-slot antenna. The blue curve corresponds to S 11 of the antenna with final dimensions.

Designed H-slot antenna with its dimensions (mm) from a top view (a) and from perspective view (b) and (d) where metal parts of the antenna are yellow coloured and substrate parts together with Teflon are grey coloured. In (c), the connection of coaxial line to microstrip is shown as well as vias. In (e) and (f), the top view on vias and microstrip and the bottom view are displayed, respectively.

The double-layered structure (two substrates with a thickness of 1.5 mm) with a ground plane was considered. A microstrip line to feed the antenna was placed between the substrates as illustrated in Figs 11(a–f). The microstrip line was directly connected to the modeled 50 Ω coaxial line and two  $\emptyset $1.3 mm vias on one side of H-slot. Thereby the symmetric feeding with no need of a balun was reached. Another three
 $\emptyset $1 mm vias connected the ground plane with the slot plane of the antenna as shown in Figs 11(b), 11(c), 11(e), and 11(f).
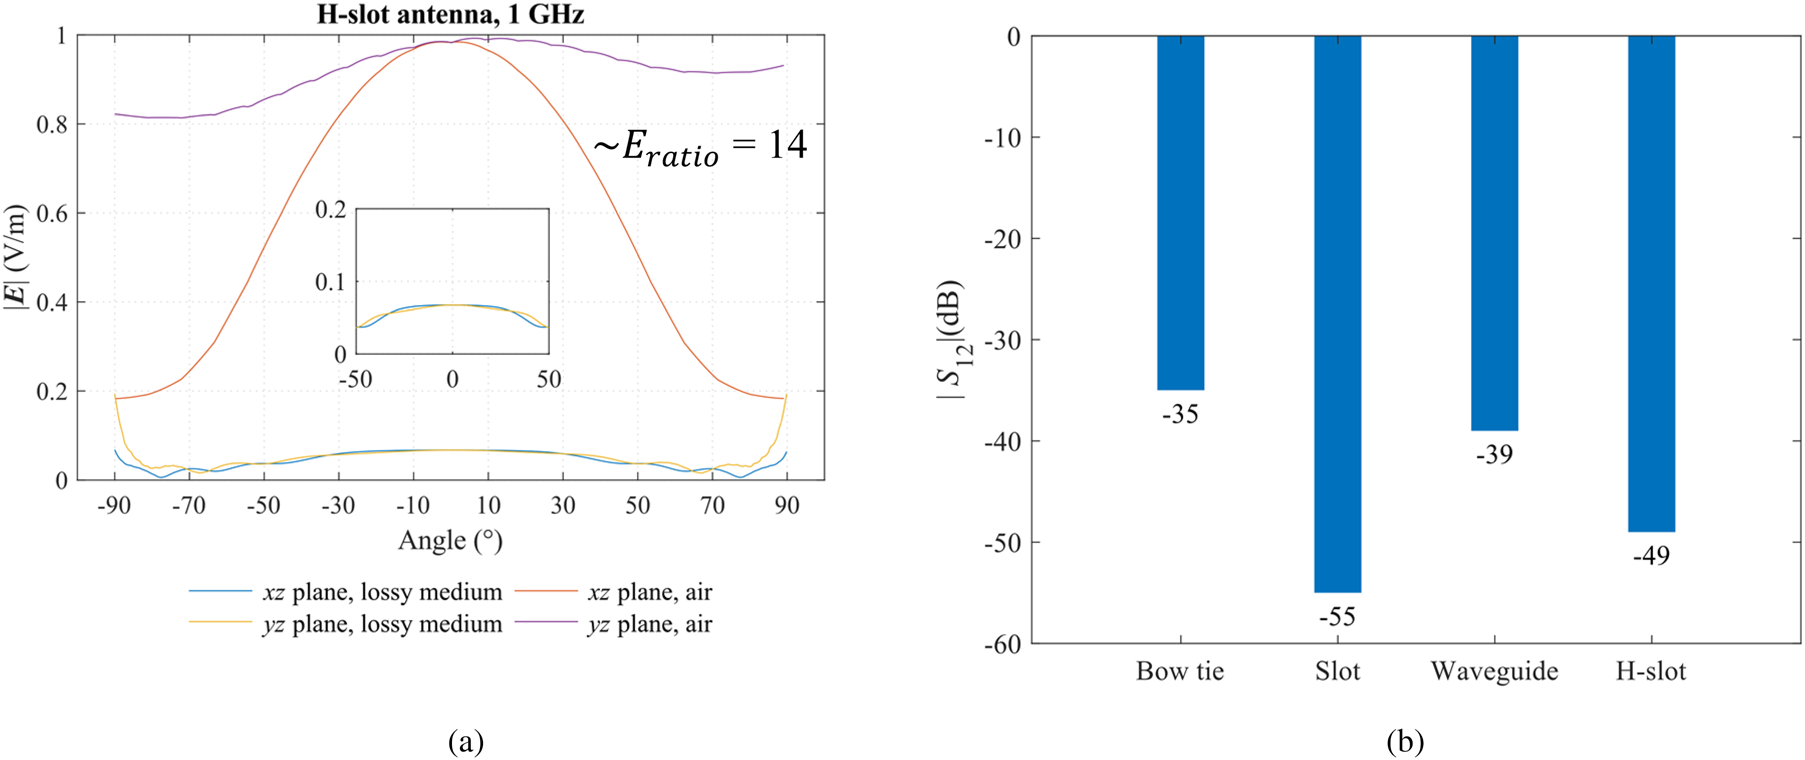
The magnitude of the intensity of the electric field | E|(V/m) depended on an angle (°) in xz and yz plane (H- and E-plane) for the front as well as the back domain was computed also for H-slot antenna and is presented in Fig. 12(a). The immunity of H-slot antenna against the plane wave exposure was compared with the results introduced in section “Antenna radiation and immunity testing to plane wave exposure” and is shown in Fig. 12(b).
The magnitudes of the intensity of the electric field |E| (V/m) depended on angle (°), medium (lossy medium versus air), and observation plane (a) and magnitudes of transmission coefficients |S 12| (dB) of H-slot antenna regarding plane wave immunity presented in section “Antenna radiation and immunity testing to plane wave exposure” compared with other introduced antennae in (b).

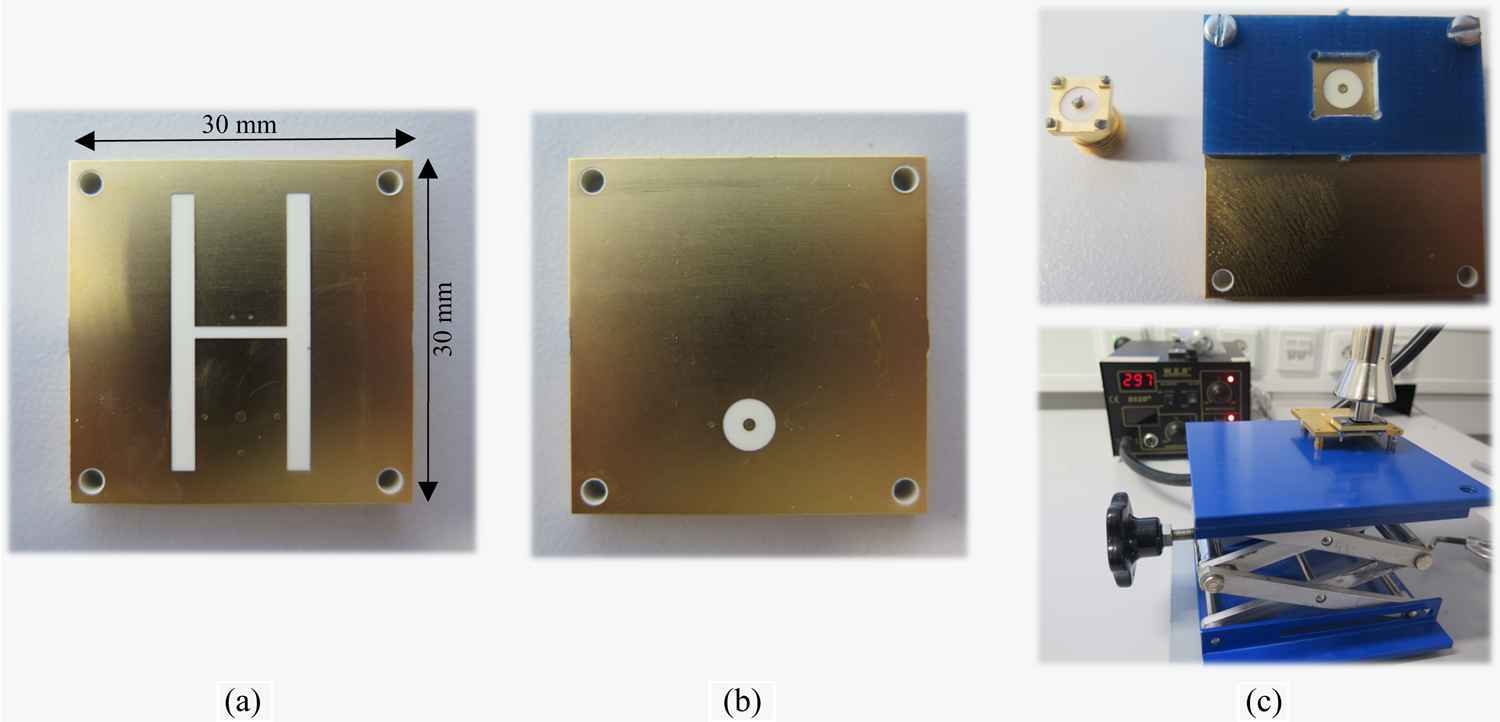
The RF substrates Rogers R04003C with a thickness of 1.5 mm (ɛ r = 3.55, σ = 0.0004 S/m) covered with 18μm Cu layer were used for antenna fabrication. Considering the complex structure of H-slot antennas, the fabrication process was realized by a Pragoboard s.r.o. company (Prague, Czech Republic) based on gerber format files exported by software Autodesk EAGLE (Mill Valley, California, USA). The image of the fabricated antenna is shown in Figs 13(a) and 13(b). The high precision SMA connectors Rosenberg 32 K 10A-40M L5 were soldered to antennas by hot air soldering station in laboratories of the Faculty of Biomedical Engineering, CTU in Prague. The accurate position of SMA connector was secured by cuprextit plate fabricated in-house on CNC cutter, see Fig. 13(c).
Fabricated H-slot antenna element from a top view (a) and bottom view (b). The cuprextit plate, SMA connector, and process of soldering by hot air in (c).

Experimental verification
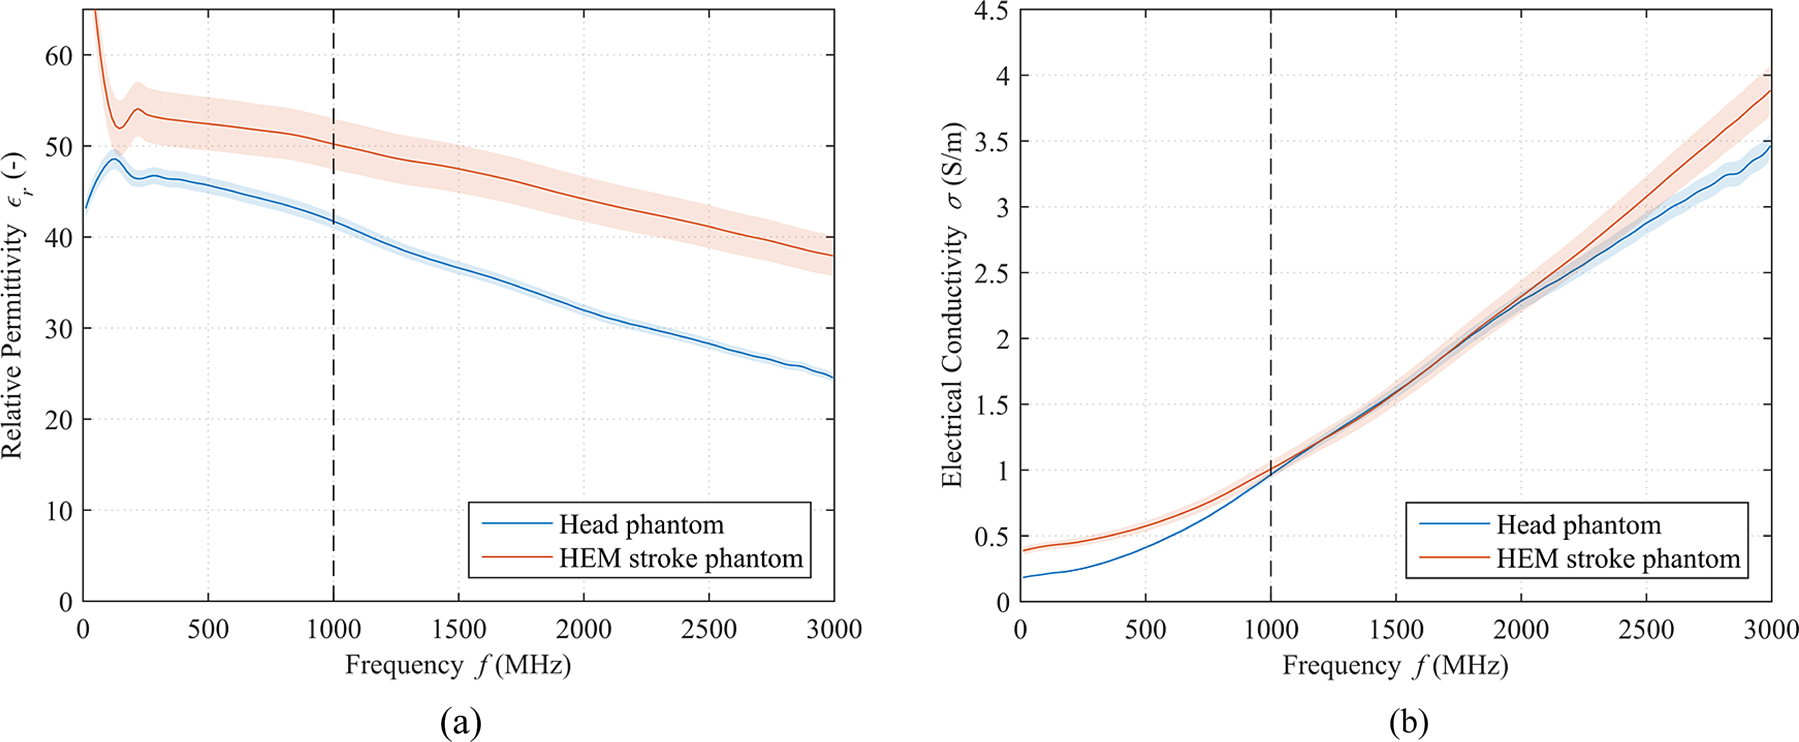
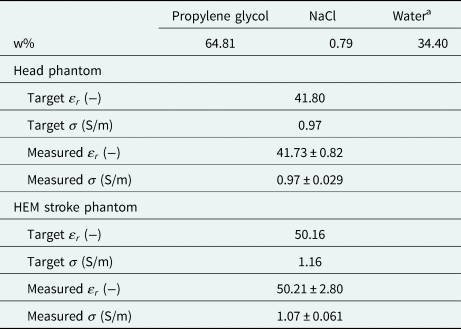
Based on the dimensions of the numerical models presented in section “Numerical study”, the rectangular box and 20 mm spherical stroke phantom were designed and printed with 3D printer Prusa i3 MK2S (Prusa Research s.r.o., Czech Republic). The box was filled with the liquid head phantom which was prepared mixing of propylene glycol, water, and salt [22] as summarized in Table 3. The HEM stroke phantom was prepared by adding water and salt to head phantom to reach dielectric parameters around 20% higher. Dielectric parameters of phantoms were measured 10 times using the SPEAG Dielectric Assessment kit (DAK, Schmid & Partner Engineering AG, Switzerland) with the probe DAK-12 in the frequency range 10 MHz–3 GHz and were supplemented with extended uncertainty of type C with a coverage factor equal to 2. Measured values are reported in Table 4 and Fig. 14. The two H-slot antennas were mounted on the box using plastic screws as illustrated in Fig. 16.
Measured dielectric parameters of the average human head phantom with extended uncertainty of type C displayed as a light shadow, relative permittivity (a), and electrical conductivity (b). The level of 1 GHz is marked by a black dashed line.

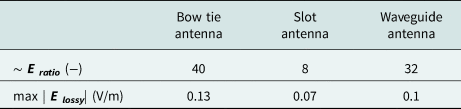
Calculated ratio Eratio (–) between maximal electric field intensity in the main lobe (angle 0°) of the given antenna in the air (back domain) and maximal electric field intensity in the lossy medium (front domain)

Also, the maximal values of intensity of electric field in lossy medium max | Elossy| (V/m) are summarized.
Weight percentages of substances needed for the preparation of the human head phantom and expected target dielectric parameters, relative permittivity ɛ r and electrical conductivity σ, of head phantom [22] as well as measured dielectric parameters of head and HEM stroke phantom for the frequency of 1 GHz supplemented with extended uncertainty of type C

a Distilled water.
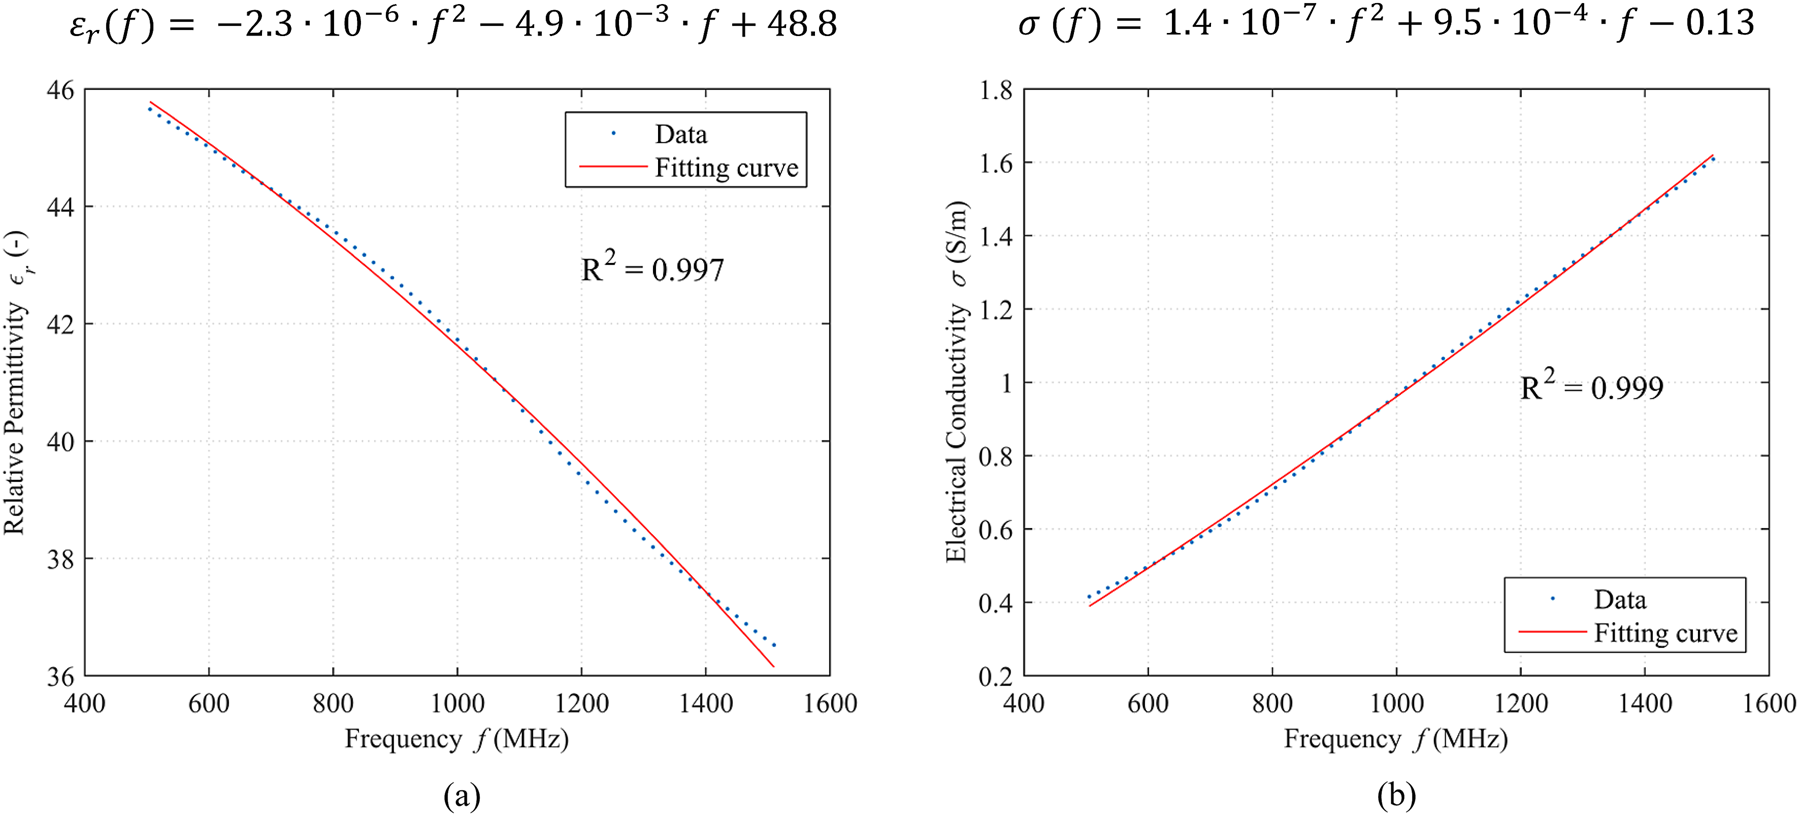
The measured dielectric parameters in the frequency range from 500 to 1500 MHz were fitted by second-order polynomial curve, and Pearson's correlation coefficient R 2 on a 95% confidence interval was calculated as presented in Fig. 15. Fitting in the mentioned frequency range was performed because this range was determined as the most convenient frequency band for MWI-based brain stroke monitoring and was also used in numerical simulations as well as in real measurements [Reference Scapaticci, Di Donato, Catapano and Crocco16]. The quadratic function expressing the dependency of relative permittivity or electrical conductivity, respectively, on frequency was used in numerical simulations of the two-port system with H-slot antennas. The functions are reported in Fig. 15.
 $$\varepsilon _r\lpar f \rpar = -2.3\cdot 10^{{-}6}\cdot f^2-4.9\cdot 10^{{-}3}\cdot f + 48.8\comma \;$$
 $$\sigma \;\lpar f \rpar = 1.4\cdot 10^{{-}7}\cdot f^2 + 9.5\cdot 10^{{-}4}\cdot f-0.13.$$
Measured relative permittivity (a) and electrical conductivity (b) of the head phantom in the frequency range 500–1500 MHz fitted by second-order polynomial curve and calculated correlation coefficient R 2 on a 95% confidence interval. The functions describing the dependency of relative permittivity and electrical conductivity on the frequency are shown above the graphs.

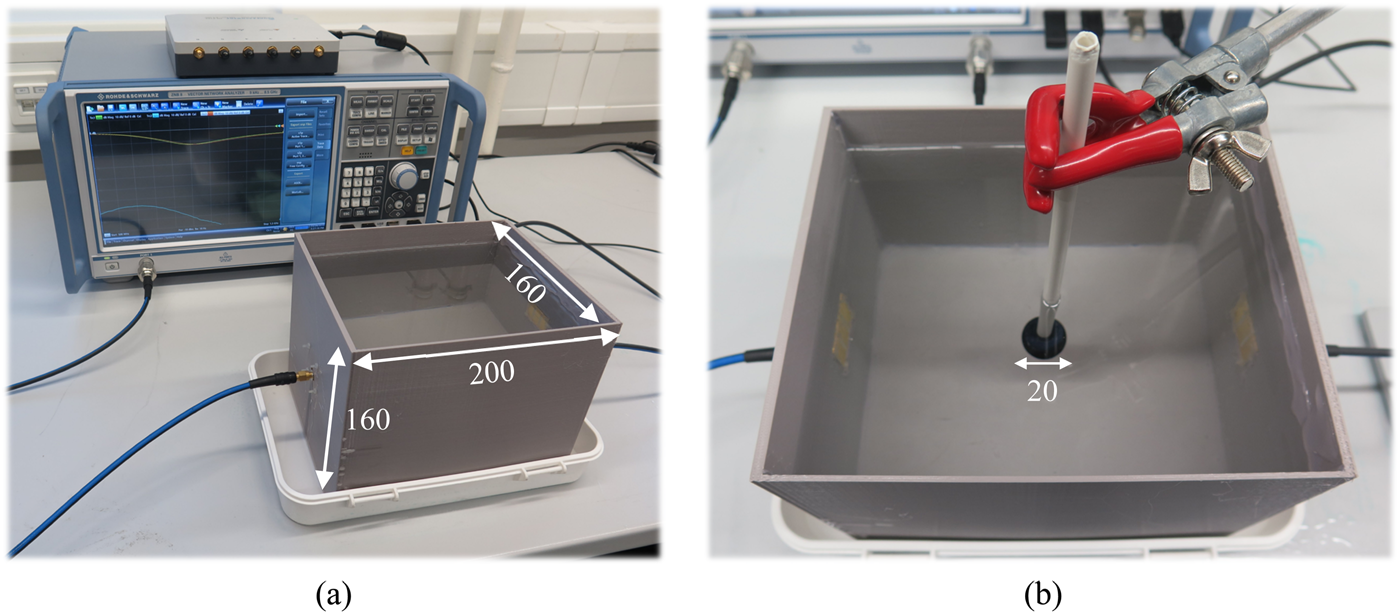
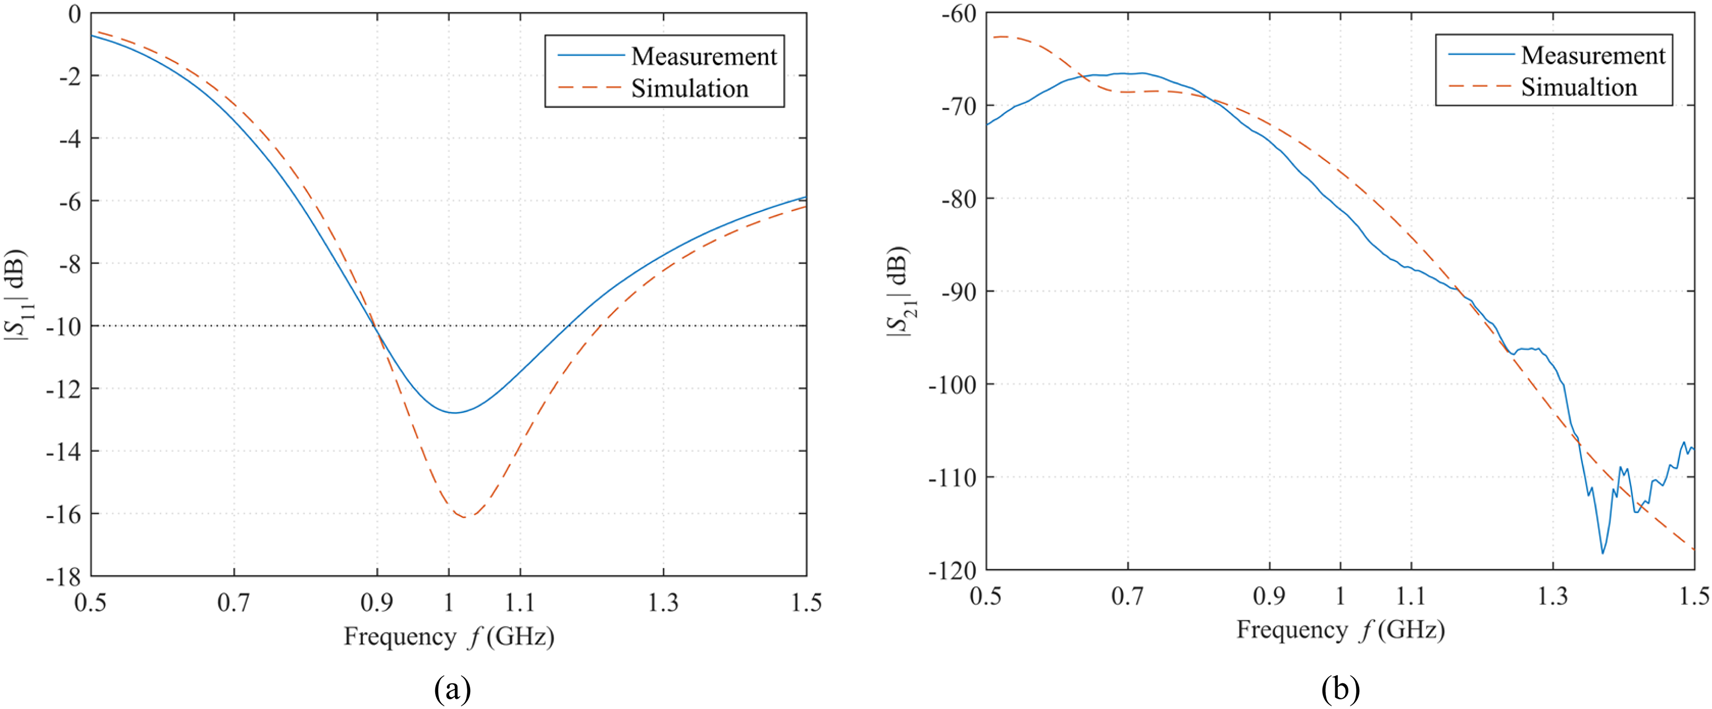
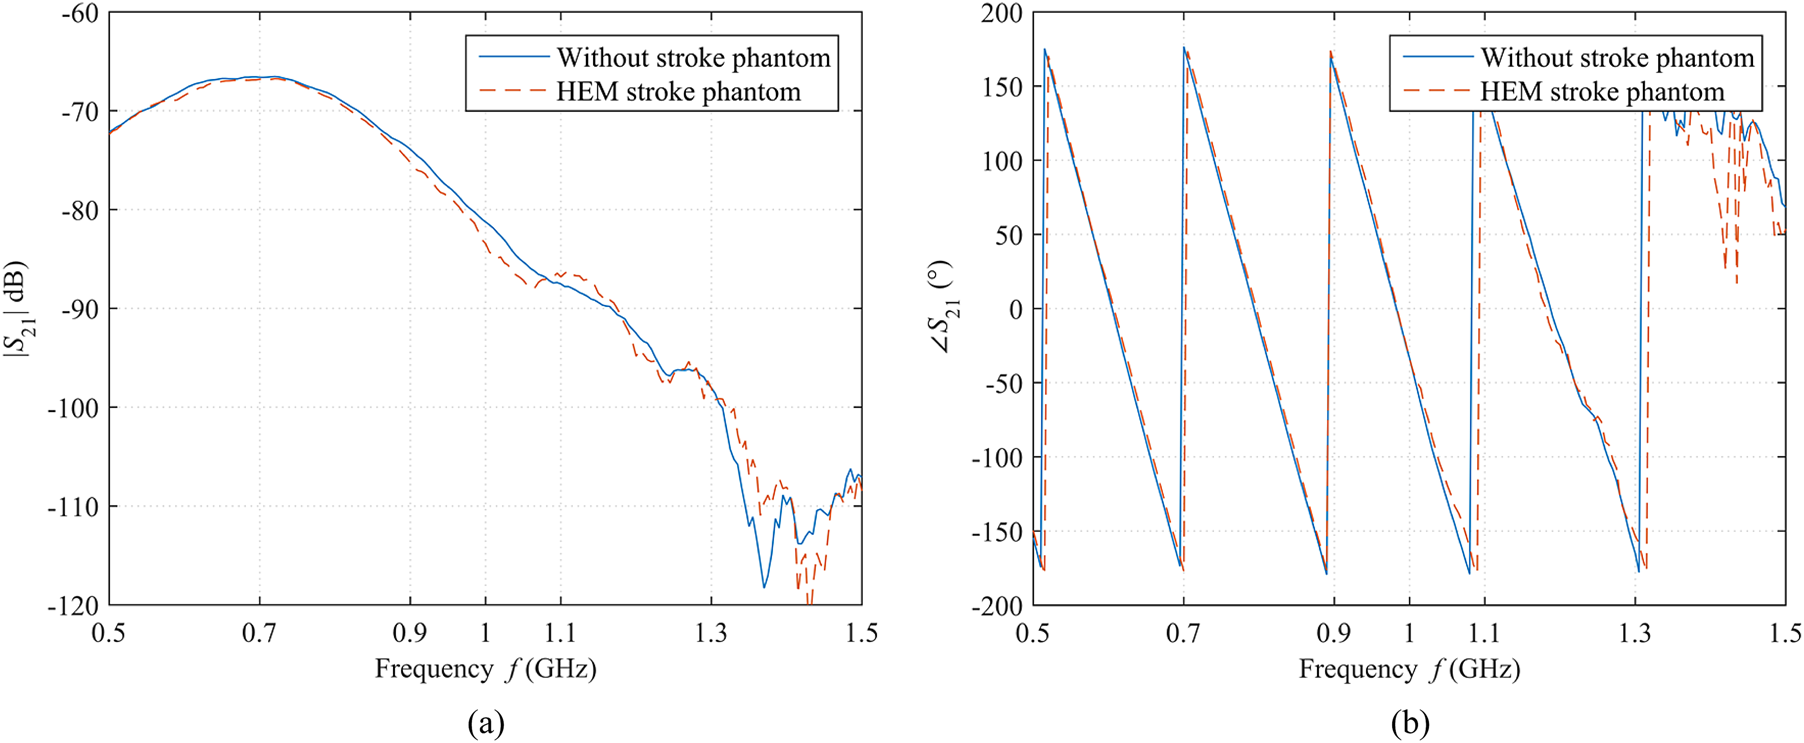
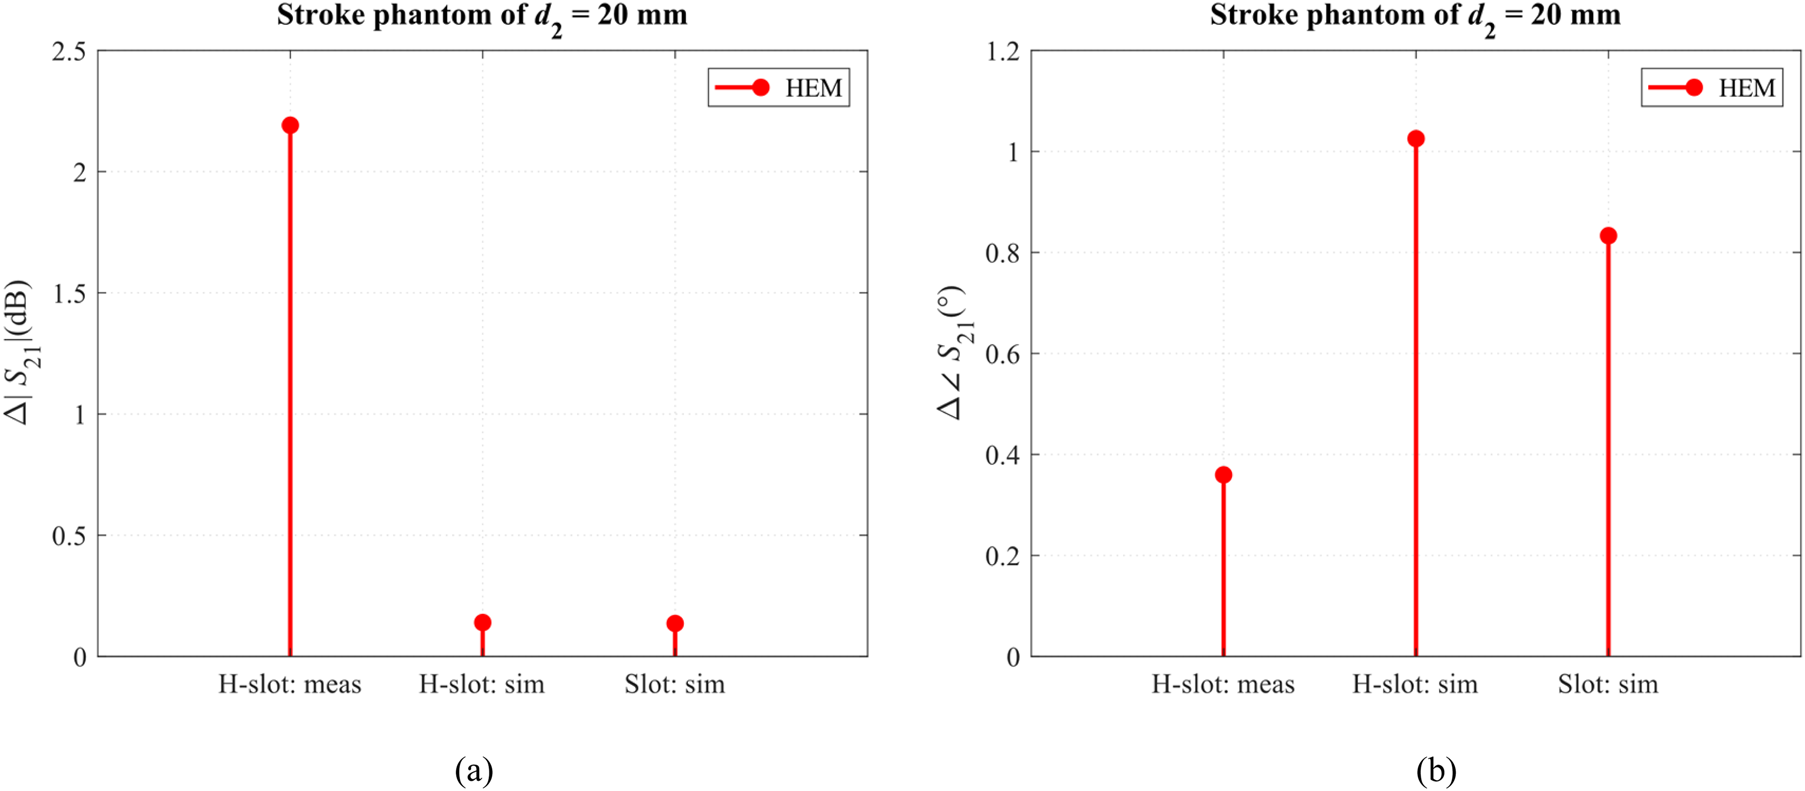
The two-port vector network analyzer R&S ZNB 8 (Rohde & Schwarz GmbH, Germany) with a dynamic range >120 dB operating up to frequency 8.5 GHz was used to measure reflection as well as transmission coefficients of a couple of H-slot antennas assembled in 3D printed box as shown in Fig. 16. Calibration of VNA ports was performed by the automatic six-port calibration kit R&S ZN-Z152. The S-parameters of the system were measured in the frequency range from 500 MHz to 1.5 GHz with intermediate frequency bandwidth 10 Hz and VNA output power 10 dBm. Results of measurements were compared with numerical results and are shown in Fig. 17. Also, comparison of measured magnitudes and phases of transmission coefficients of the system without and with placed 20 mm HEM stroke phantom was done and is shown in Fig. 18. Each measurement was done 10 times and averaged. The standard deviation of measurements moved in the order of 10−6 dB. In Fig. 19 the comparison of measured differences Δ of magnitudes and phases of transmission coefficients with numerically obtained for H-slot and slot antenna for single frequency 1 GHz is shown.
The experimental configuration/system consisting of 3D printed box with dimensions (mm) assembled with H-slot antennas, liquid head phantom, VNA, and calibration kit (a) and detail of placing of HEM stroke phantom with the diameter of 20 mm to the middle of the two-port system (b).

Comparison of measured and numerically computed magnitudes of reflection coefficient (a) and transmission coefficient (b) of a couple of H-slot antennas mounted in the experimental system. The level of −10 dB is marked in (a) by the black dotted line.

Comparison of measured magnitude (a) and phase (b) of the transmission coefficient of H-slot antennas for the case without and with the 20 mm HEM stroke phantom placed inside the head phantom/two-port system.

Comparison of measured (meas) differences Δ of magnitudes (a) and phases (b) of transmission coefficients with numerically obtained (sim) of H-slot and slot antenna for frequency 1 GHz.

Discussion
Numerical study
The results presented in section “Numerical study” showed the sensitivity of S-parameters (transmission coefficients S 21) of different antenna types (bow tie, slot, and waveguide-based) on the change of stroke phantom type (HEM versus ISCH) as well as on stroke phantom diameter (Figs 4–6). The slot antenna proved very good while its magnitude of transmission coefficient |S 21| moved around −76 dB. The change of dielectric parameters of stroke phantoms led to an almost linear change of magnitude and phase (0.14 dB and 1°) of transmission coefficient Δ|S 21| (dB),  $\Delta \angle $S 21 (°), respectively. Also, the bow tie antenna showed good sensitivity on dielectric parameters of HEM stroke phantom, however not the same sensitivity on parameters of ISCH stroke phantom. The bow tie antenna showed a higher value of |S 21| (around −63 dB) compared to the slot antenna. For both antennas, a linear increase of the HEM stroke diameter resulted in a quadratic increase of the magnitude and phase of the transmission coefficient.
The waveguide-based antenna was the least sensitive on stroke phantom type and did not prove the quadratic dependency between stroke phantom diameter and change of magnitude and phase of the transmission coefficient, respectively. The magnitude of S 21 for the waveguide-based antenna was around −69 dB. Please note that the presented tests represent the worst-case scenarios. A stroke phantom of a small size is located in the middle of head phantom and its impact on the transmission coefficient for the most distant antennas is studied. The most common artery involved in ischemic stroke is the middle cerebral artery which supplies a large area of the lateral surface of the brain and a part of the basal ganglia and the internal capsule via four segments [Reference Capriotti and Murphy31]. It is obvious that detection of the ischemic region in inner (middle) parts of the brain via MWI method could be much more challenging in the future than detection of ischemic stroke of lateral brain surface due to lossy behavior of white and grey matter.
The study focused on antenna radiation and antenna immunity to plane wave exposure was proposed in section “Antenna radiation and immunity testing to plane wave exposure”. As studied antenna was supposed to operate in the near-field region, there would have been difficult to compute radiation patterns (condition of the far-field region and computational demands). Instead, a method was suggested and used to evaluate antenna radiation based on the comparison of magnitudes of electric field obtained in lossy medium and air along the given angle (see Fig. 7). The ratios of electric field intensities of EM waves irradiated by antennas after propagation through two 20 cm-radius hemispheres: (a) air-filled (back radiation) and (b) lossy with average dielectric properties of human head tissues (radiation into the investigation domain) for a slotted antenna, bow-tie antenna, and rectangular waveguide-based antenna were 8, 40, and 32 as shown in Table 3 and Fig. 8.
On the other hand, the slot antenna delivered the lowest intensity of electric field to lossy medium compared to bow tie and waveguide-based antenna which corresponds to the lowest magnitude of the transmission coefficient of slot antenna (−76 dB) mentioned above. However, −76 dB is still a reasonable value regarding the MWI. Besides, all three antennas were exposed to a plane wave irradiated by a plane source positioned in the back domain (air) of antennae (see Fig. 9(a)) and the value of transmission coefficient between this source and antenna port proved that slot antenna (−55 dB) is the most immune to the plane wave exposure compared to bow tie (−35 dB) and waveguide-based (−39 dB) as reported in Fig. 9(b).
H-slot antenna element
Designed miniaturized 3 × 3 cm H-slot antenna was experimentally verified on liquid head phantom and HEM stroke phantom in terms of measurement of its reflection and transmission coefficients. The experimental two-port system was designed and fabricated as shown in Fig. 16. A good match between the numerically computed magnitude of the reflection coefficient in COMSOL Multiphysics and measured results was obtained as presented in Fig. 17(a). The H-slot antenna can satisfactorily operate in the frequency range from 0.9 to 1.1 GHz where |S 11| ≤−10 dB. Also, a very good correlation was proven by comparison of numerical transmission coefficient (~−78 dB at 1 GHz) and measured transmission coefficient (~−81 dB at 1 GHz) as shown in Fig. 17(b). Some small differences between both signals could be caused by the calibration process where it was not possible to ensure the same position of coaxial cables during calibration and measurements due to positions of ports of calibration kit. In real clinical use, this could be eliminated by using in-house developed calibration kit with a number of ports corresponding to the number of ports of MWI system or by using differential MWI approach where no calibration is needed. Getting closer to measured |S 21| equals to −120 dB which is the dynamic range of the used VNA, some oscillations of the signal of |S 21| were observed. The effect of plastic boundaries of the two-port system (3D printed box) on measured data is not expected due to the relative permittivity lower than 2.4 at 1 GHz and electrical conductivity close to zero.
The sensitivity of H-slot antennas (regarding the change of magnitude and phase of transmission coefficient |S 21|,  $\angle $S 21) on 20 mm HEM stroke phantom as a local increase of dielectric properties was evaluated. The measured transmission coefficient of the two-port system filled with liquid head phantom was compared with the measured transmission coefficient of the two-port system with head phantom and HEM stroke phantom placed inside, and it is shown in Fig. 18. The comparison showed the difference of magnitude as well as the phase of transmission coefficient in two mentioned signals, especially in the frequency range from 0.9 to 1.1 GHz.
The H-slot antenna radiation was validated in the same way as presented in section “Antenna radiation and immunity testing to plane wave exposure”. It was expected that H-slot antenna will prove the same behavior as the slot antenna. Nevertheless, the H-slot antenna radiated to back domain (air) 14 times more (slot seven times more) as shown in Fig. 12(a). It is still almost three times lower level than bow tie antenna showed. In the study of H-slot antenna immunity to plane wave exposure, the transmission coefficient between the source of the plane wave and port of H-slot antenna reached the value of −49 dB (slot antenna −55 dB, bow tie −35 dB, and waveguide-based −39 dB) as depicted in Fig. 12(b). The differences between slot and H-slot antenna operation can be caused by smaller dimensions of H-slot antenna substrate. The slot is close to substrate edges and thus the currents flow not only around the H-slot but also to the ground plane of the antenna.
In comparison with antennas mentioned in section “Introduction” (planar monopole, monopole, rectangular waveguide-based, triangular patch, and slotted dipole), the H-slot antenna is the most compact regarding the antenna dimensions 30 × 30 × 3 mm and therefore it is possible to fit them directly on the head phantom. Also, it is mechanically stable and can be inexpensively and repeatedly fabricated. For instance, the waveguide-based antenna [Reference Semenov, Hopfer, Planas, Hamidipour and Henriksson9] needs to be filled with ceramic or another high-dielectric constant material to reduce its dimension under 3 cm at considered frequencies around 1 GHz. The planar monopole antenna [Reference Tobon Vasquez, Scapaticci, Turvani, Bellizzi, Joachimowicz, Duchêne, Tedeschi, Casu, Crocco and Vipiana11] is close by its dimension to H-slot antenna, but in our opinion, it could be difficult to place these antennae into geometrically more complex MWI system due to antennae structure and SMA port position. On the other hand, the monopole antenna provides wideband characteristic compared to narrowband H-slot antenna which can be able to adapt to the working frequency of the given scenario. It can be also easily fabricated. The geometry of monopole antenna [Reference Meaney, Fanning, Raynolds, Fox, Fang, Kogel, Poplack and Paulsen12] does not allow to be attached directly on phantom and cannot fit well to different MWT system setup shapes except circular. Also, the monopole antennae radiate omnidirectionally and have to be immersed in lossy coupling medium to eliminate cross-coupling effect among the antennae. The good mechanical stability of the monopole antenna can be supposed. The dimensions of the triangular patch antenna [Reference Trefná and Persson13] and slotted dipole [Reference Mobashsher, Abbosh and Wang15] antenna are not suitable to be present in the MWI system with more than 20 antennae. The slotted dipole antenna also radiates omnidirectionally and its fabrication process can be quite challenging.
Conclusion
In this paper, we designed and experimentally validated the compact dimensions-reduced H-slot antenna suitable for newly developed multichannel MWI system at CTU – FBME. The slot antenna type was selected based on the numerical comparative study of three different AEs, i.e. bow tie, slot, and rectangular waveguide-based antenna. The measured reflection and transmission characteristics of H-slot antenna matched with numerical characteristics. The antenna fulfilled the requirements of the sensitivity of transmission coefficient on dielectric contrast inside the investigating domain and sufficient one-directional front domain (lossy medium) radiation or low back domain (air) radiation, respectively. Due to the reduction of the substrate dimensions, the H-slot antenna showed a deterioration of the radiation characteristics compared to the numerically studied slot antenna. However, the H-slot antenna still showed better characteristics than the bow-tie and the rectangular waveguide-based antenna. The H-slot antenna due to its compact size, unlike all three mentioned AEs, is used in a compact multichannel MWI system with more than 20 antenna elements.
Acknowledgements
This work was supported by the research program of the Czech Science Foundation, Project no. 17-00477Y Physical nature of interactions of EM fields generated by MTM structures with human body and study of their prospective use in medicine and by the student research program of the Czech Technical University in Prague, Project no. 161 – 1611715G000 Microwave system for detection and classification of cerebrovascular accidents. The authors declare that they have no conflict of interest.
 Jan Tesarik received a master's degree in biomedical engineering from the Czech Technical University in Prague, Faculty of Biomedical Engineering in 2016. The title of his thesis was “Simplified Microwave Imaging System for Brain Stroke Follow Up”. He currently studies Ph.D. program at the same faculty and also works as a researcher at the Department of Biomedical Technology from 2017. His main research interests are design and optimization of microwave imaging systems for brain stroke detection, non-invasive temperature monitoring using microwave imaging technique, and the design of antenna elements for microwave diagnostics and therapy.
 Tomas Pokorny successfully defended a master's thesis at the Faculty of Biomedical Engineering, Czech Technical University in Prague in 2018. Title of the thesis was “Detection of Strokes Using Microwave Imaging System and SVM”. Currently, from 10/2018, he studies Ph.D. program at the Faculty of Biomedical Engineering, Department of Biomedical Technology, CTU in Prague. The subject of his interest is the detection and classification of brain strokes using machine learning algorithms as well as the development of human head phantoms suitable for testing of microwave imaging systems.
 Jan Vrba, Jr. received the M.Sc. and Ph.D. degrees in electrical engineering from RWTH Aachen University, Germany in 2006 and 2013, respectively. In 2011, he joined the Faculty of Biomedical Engineering of the Czech Technical University in Prague, and in 2017, he became an associate professor. His main research interests are the interaction of the electromagnetic fields with matter and biological systems. In particular, he focuses on the development of microwave sensors, antennas, phantoms, and algorithms for microwave imaging and systems and applicators for superficial and deep microwave hyperthermia.