INTRODUCTION
The Quaternary period is characterized by high amplitude, glacial-interglacial global climate variability (Zachos et al., Reference Zachos, Pagani, Sloan, Thomas and Billups2001). The most heavily studied of these cycles is the transition between the Last Glacial Maximum (LGM) (ca. 21 ka) and the onset of the current interglacial period, marking the start of the Holocene epoch (11.6 ka to present) (Koch et al., Reference Koch, Diffenbaugh and Hoppe2004). Across this transition, numerous episodes of abrupt climate change occurred, including the Younger-Dryas event, the short-lived interruption in Northern Hemisphere warming representing a return to glacial conditions at the end of the last ice age (Hald and Aspeli, Reference Hald and Aspeli1997). These events provide natural instances that can be used to examine the response of terrestrial ecosystems to sudden climate change. The events also allow for detailed study of ecosystem responses to rapid climate shifts, and thus provide empirical data to improve projections of biotic responses to comparable rates of future change (Boulanger et al., Reference Boulanger, Martinez and Segura2006). However, high-resolution pre-LGM climate records based on sedimentary or biological material from terrestrial environments are rare and spatially disparate. Most often these records are limited to lake sediments, which are biased towards temperate climate regions.
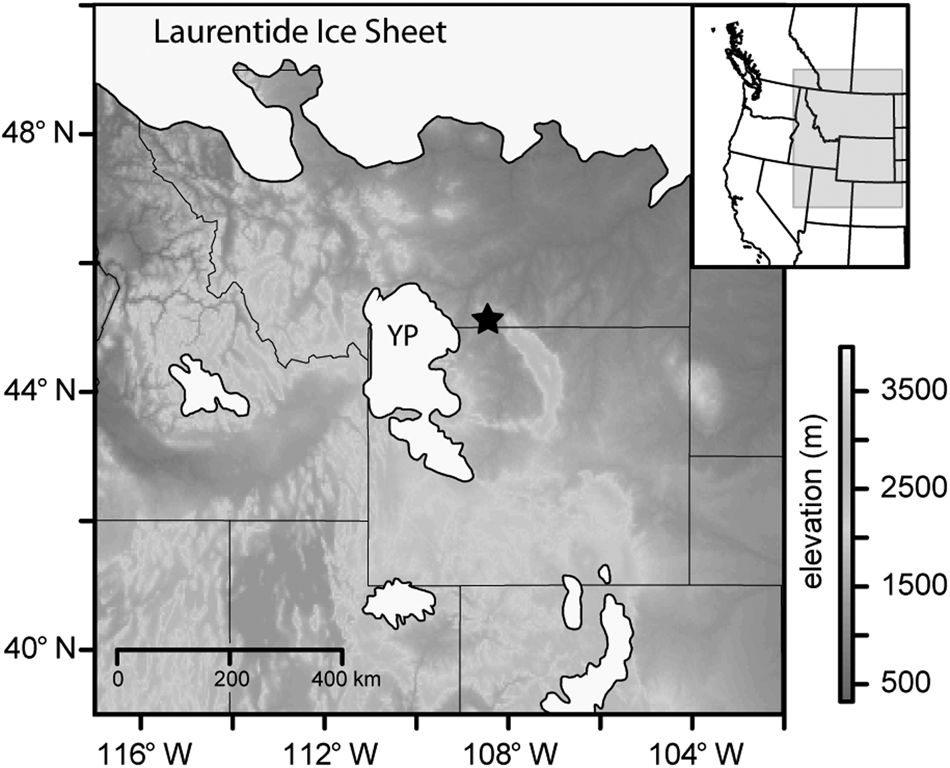
Closed sites such as caves are excellent repositories of paleoenvironmental data in arid regions (Davis, Reference Davis1990; Jass and George, Reference Jass and George2010). Like lakes and bogs, caves are persistent landscape features capable of recording environmental change over many millennia (Jass and George, Reference Jass and George2010). Through examination of fossil plant pollen and organic matter preserved in closed-site sediments, it is possible to dynamically interpret past landscape and climate conditions by incorporating independently-sourced records of plant communities (aeolian-derived pollen and organic matter). Using data from these two records of vegetation history, we explore environmental and climatological variations near the southwestern margin of the Laurentide Ice Sheet from prior to the LGM, ca. 21.0 ka to the Holocene transition (Fig. 1).
Location of Last Canyon Cave relative to the Laurentide Ice Sheet and alpine glaciated regions in western North America including the Yellowstone Plateau (YP). Ice margins derived from Dyke et al. (Reference Dyke, Moore and Robertson2003).

We look to elucidate the late Pleistocene environment of the Bighorn Basin using a multiproxy approach of pollen analysis and measurement of organic, inorganic, and carbon isotopic compositions of aeolian sediments. Multiproxy records serve an important role in constraining interpretations of the past, particularly in environments where modern analogs provide limited insights into past climate controls, vegetation assemblages, or faunal assemblages. The application of modern analogs is particularly problematic for analysis of Pleistocene climates as planetary boundary conditions were significantly different from present (Bartlein et al., Reference Bartlein, Anderson, Anderson, Edwards, Mock, Thompson, Webb and Whitlock1998; Felzer et al., Reference Felzer, Webb and Oglesby1998; Kutzbach et al., Reference Kutzbach, Gallimore, Harrison, Behling, Selin and Laarif1998). Major differences during the glacial periods include the presence of continental ice sheets in the Northern Hemisphere and lower atmospheric CO2 (Wright et al., Reference Wright, Kutzbach, Webb, Ruddiman, Street-Perrott and Bartlein1993). Here, the use of pollen and sedimentary organic matter recovered from Last Canyon Cave in the Pryor Mountains of southern Montana complements and expands previous methods of quantifying late Pleistocene and Holocene climates at the intersection of the Great Plains and Rocky Mountain regions.
Fossil pollen data have been analyzed for well over a century as a proxy for Earth's climate history (VonPost, Reference VonPost1916; Reference VonPost1946), and using modern pollen climate databases (Whitmore et al., Reference Whitmore, Gajewski, Sawada, Williams, Shuman, Bartlein and Minckley2005; Fyfe et al., Reference Fyfe, de Beaulieu, Binney, Bradshaw, Brewer, Le Flao and Finsinger2009) these data are useful for quantifying magnitudes of change from sub-centennial to millennial timescales (Minckley et al., Reference Minckley, Booth and Jackson2012a). However, independent validation of these types of analyses can be difficult as many paleoecological datasets are auto-correlated with inferred climate interpretations derived from similar datasets.
Carbon isotope (δ13C) analysis of sedimentary organic matter can provide additional insight into the composition and condition of past floras as a result of effects of environmental conditions on carbon isotope discrimination by plant species (Tipple and Pagani, Reference Tipple and Pagani2007; Diefendorf et al., Reference Diefendorf, Mueller, Wing, Koch and Freeman2010). Different photosynthetic pathways used by plants (C3, C4, or CAM photosynthesis) can impart distinct and discernible δ13C values that can be useful for determining the proportion of each plant group contributing to the organic matter recovered at a site (O'Leary, Reference O'Leary1988; Farquhar et al., Reference Farquhar, Ehleringer and Hubick1989). Yet, even when only one of these plant groups is present, small but measurable differences in the carbon isotopic composition of sedimentary organic matter can be used to infer past environmental conditions and test interpretations drawn from other proxies (e.g., pollen). Carbon isotope fractionation in plants, especially C3 plants, is sensitive to local environmental conditions that include, but are not limited to, water stress, humidity, light intensity, and temperature (Vogel, Reference Vogel1993; Yakir et al., Reference Yakir, DeNiro and Ephrath1990; Cerling et al., Reference Cerling, Hart and Hart2004; Sun et al., Reference Sun, Callahan, Pyzoha and Trettin2006). Furthermore, plant δ13C values can also reflect changes at the global scale in terms of temporal variation in atmospheric CO2 concentration and carbon isotopic composition (Diefendorf et al., Reference Diefendorf, Mueller, Wing, Koch and Freeman2010; Kohn, Reference Kohn2010). When used alone, interpretation of sedimentary organic matter δ13C values can be complicated by the various environmental factors in play, but, when combined with information on floral communities based on pollen assemblages, these independent records of vegetation can provide a powerful means of reconstructing community composition and environmental conditions in the past.
REGION AND SITE DESCRIPTION
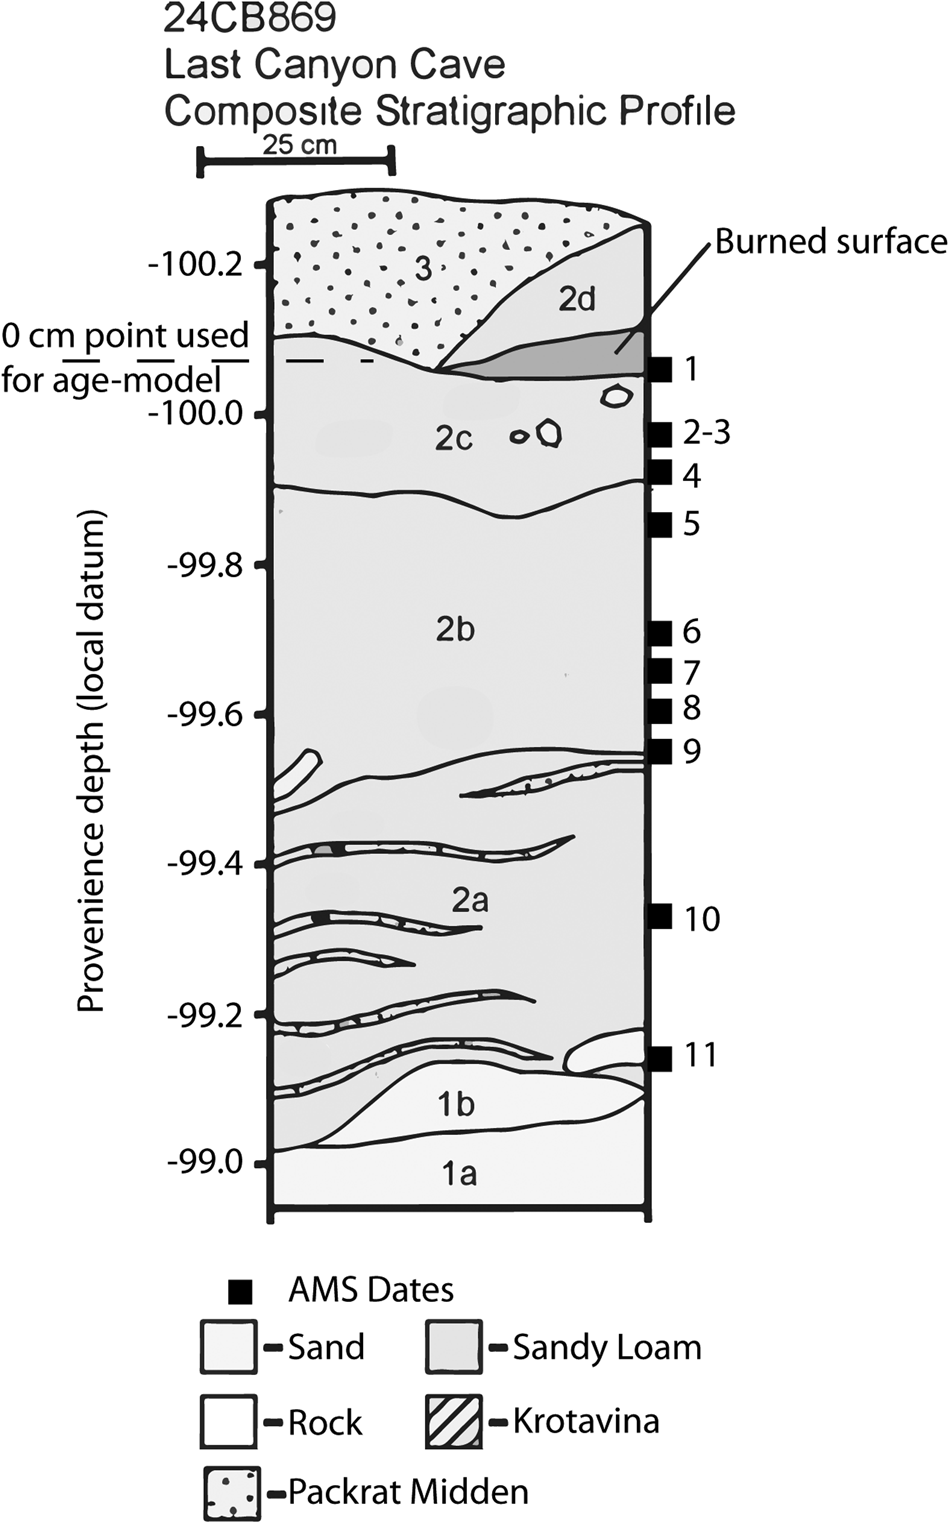
Last Canyon Cave is located in the southwest portion of the Pryor Mountains, near Warren, Montana (Fig. 1). The site is situated ~15 meters upslope from the canyon bottom, near the top of the Tensleep Sandstone, which is locally interbedded with limestone (Lopez, Reference Lopez2000). The southwest facing shelter opening is approximately 1.5 m high by 6 m wide, and is roughly perpendicular to the dominant wind direction. The interior is ~6 m wide and 8 m deep with tapering walls toward the interior. Aeolian sediments with a dominant silty very fine sand texture are 1.2–1.5 m thick, thinning towards the margins of the cave walls (Fig. 2). Last Canyon Cave is on the northern margin of the Bighorn Basin, an area long identified as containing a rich history of paleoenvironmental and paleoclimatological data (Koch et al., Reference Koch, Zachos and Dettman1995; Secord et al., Reference Secord, Gingerich, Lohmann and MacLeod2010).
Stratigraphy of Last Canyon Cave section sampled for pollen and sedimentary organic matter. Depth is based on local datum established to identify location of all material collected from cave deposit. Dashed line identifies top of section (0 cm) described in this study and serves as the uppermost-position dated and used to construct age-depth model (Fig. 3). Numbered squares show the position of AMS-dated material used to determine age-depth relationships.

Present-day vegetation surrounding the site is characterized by herbaceous taxa (Poaceae, Amaranthaceae, Asteraceae), and shrubs (Artemisia, Crysothamnus, Opuntia). Tree cover (Juniperus osteosperma, Pinus flexilis) is sparse, mostly on the ridge above and talus slope below the cave opening. Though C4 grasses are present in the area, they are not abundant and their contribution to overall biomass today is small (<5.0%; Paruelo and Lauenroth, Reference Paruelo and Lauenroth1996; Fischer et al., Reference Fischer, Joseph, Tieszen and Schimel2008). Present-day fauna include rodents (Neotoma cinerea, Peromyscus), rabbits-hares (Sylvilagus, Lepus ), and ungulates (Odocoileus hemionus, Ovis canadensis, Cervus canadensis, Odocoileus virginianus, Antilocapra americana, Equus caballus), which are representative mammal species of open, arid habitats.
METHODS
Field Protocols
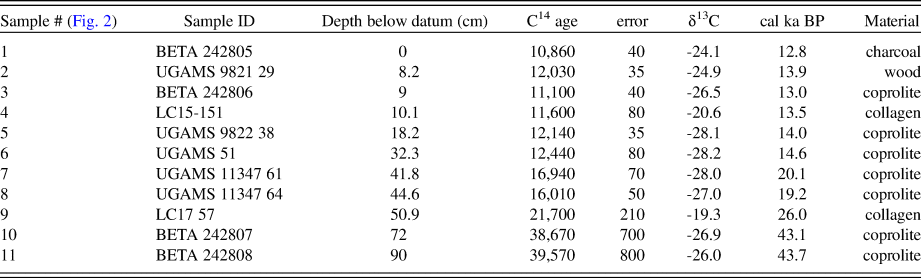
During the 2007 field season, archeological investigations cleared slumped sediment from an undocumented excavation in the center of Last Canyon Cave and allowed for the profiling of exposed walls of this hole (Fig. 2). Among the material recovered from the slumped sediment was a horse (Equus sp.) astragalus (17.2 ± 0.2 ka) and—based on its size—a Pleistocene bighorn sheep (Ovis catclawensis) distal tibia (Harris and Mundel, Reference Harris and Mundel1974; Neas and Wang, Reference Neas and Wang1987; Fedorchenko et al., Reference Fedorchenko, Kornfeld, Finely and Larsen2009). Profiles showed up to 1.5 m of homogeneous fine-grained sediment. Within the exposed walls of the excavated hole were several stratigraphically consistent radiocarbon assays, the lowest of which reached 43.5 ± 0.7 cal ka BP and the uppermost (other than the recent surface) yielded a date of 12.8 ± 0.5 cal ka BP, consistent with the presence of Rancholabrean fauna. The uppermost date also appeared to be from an anthropogenic context, a thermal feature that might signify the presence of early human occupation (e.g., Madsen, Reference Madsen2004; Kornfeld and Politis, Reference Kornfeld, Politis, Cummings, Jordan and Zvelebil2014). This potentially unique feature alone engendered further exploration of the shelter and in particular the reconstruction of the paleoecological context that would have confronted the First Americans.
In the 2008 and subsequent field seasons, controlled excavation techniques were enhanced with the use of EDMwin software (McPherron and Dibble, Reference McPherron and Dibble2002) and included determining point provenience of all objects larger than 1 cm encountered during excavation. Smaller items and various samples of smaller and microscopic specimens were also recovered in the 50 cm x 50 cm horizontal spits excavated 5 cm deep. One hundred twenty-five sediment samples were removed from the 12.8 cal ka BP feature to bedrock in 1 cm contiguous levels, while two adjacent column samples for faunal and other materials were removed in 25 cm x 25 cm horizontal and 5 cm deep splits from the same stratigraphic sequence as the pollen samples. For this study, the 12.8 cal ka BP feature forms the arbitrary 0 cm datum separating Pleistocene material from the overlying sediment that may have been influenced by Holocene anthropogenic activity. The provenience of samples used in this study was thus systematically determined, but at various levels of resolution. Provenience of the specimens and level of resolution is traceable through the site database and field notes.
Dating
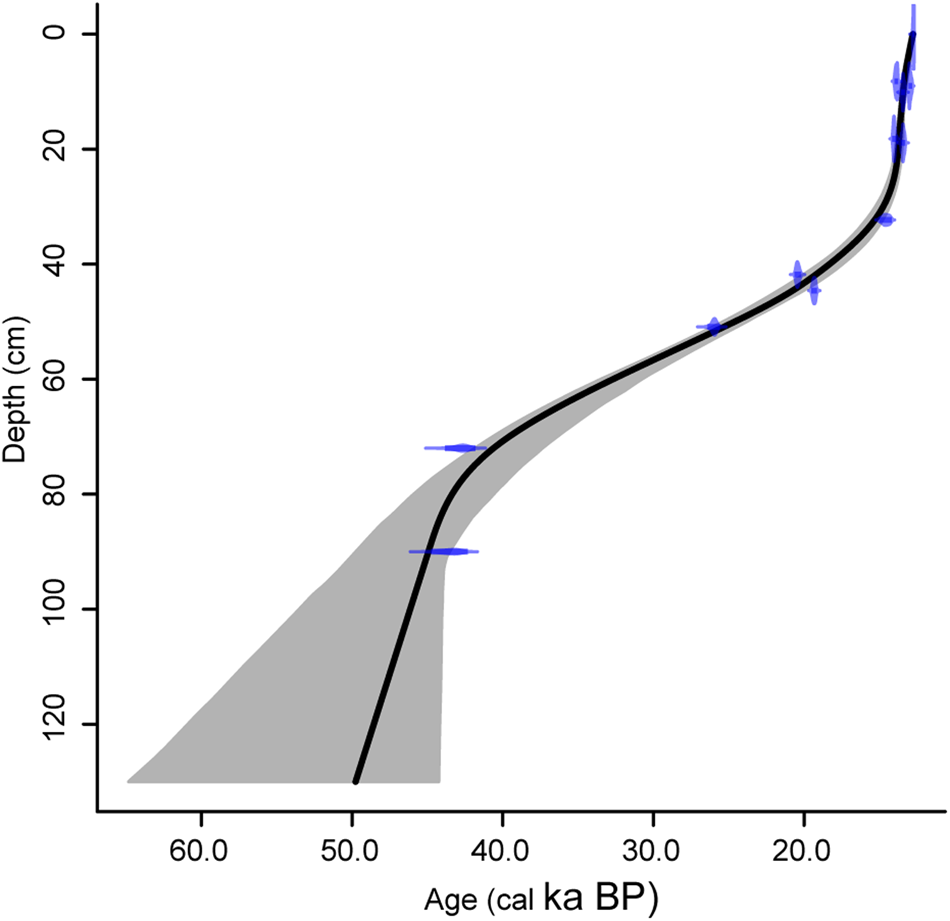
Accelerator Mass Spectrometry (AMS) dating of material was conducted after preliminary analyses were performed, so that significant patterns in the proxy data could be directly dated rather than dated using interpolated ages based on age-depth modeling (Table 1, Fig. 3). Age-depth relationships were estimated using a 10,000 model run of a smooth spline using R-Code CLAM (Blaauw, Reference Blaauw2010) based on the IntCal13.14C calibration curve (Reimer et al., Reference Reimer, Bard, Bayliss, Beck, Blackwell, Ramsey, Buck, Cheng, Edwards and Friedrich2013).
(color online) Age-depth relationships for Pleistocene section from Last Canyon Cave. Positions of AMS-dated material were converted from the local datum within the cave to cm-below charred soils (labeled burned surface in Fig. 2).

Uncalibrated and calibrated 14C ages used in constructing the Last Canyon Cave age vs. depth model based on the IntCal13 14C calibration curve (Blauuw Reference Blaauw2010, Reimer et al. Reference Reimer, Bard, Bayliss, Beck, Blackwell, Ramsey, Buck, Cheng, Edwards and Friedrich2013).

Pollen Analysis
Pollen was chemically extracted from 29 1-cm3 samples taken from 5 cm intervals through the section, following standard acid-base-acid procedures (Faegri et al., Reference Faegri, Kaland and Kzywinski1989). Pollen samples were counted to minimums of 300 terrestrial pollen grains, identified to the lowest possible taxonomic level. Pollen counts were converted to percentages and plotted by time. Zonation was determined using constrained cluster analysis (Grimm, Reference Grimm, Huntley and Webb1988).
Fossil pollen data were compared to modern pollen sites in western North America using the modern analog technique (Minckley et al., Reference Minckley, Bartlein, Whitlock, Shuman, Williams and Davis2008). We used these data to inform environmental interpretations as well as seasonal distribution of selected climate variables. However, because of complications induced by planetary boundary conditions (e.g., large ice sheets, lower CO2 levels) during the Pleistocene, we discuss climate reconstruction in general terms of seasonality of precipitation rather than estimated values of precipitation or temperature based on modern pollen-climate relationships.
Sediment organic matter analysis
Organic matter was analyzed from 125 contiguously sampled sediments taken at 1-cm intervals through the measured section. Subsamples were sieved through 250 and 125μm screens for subsequent loss-on-ignition (LOI) and isotopic analyses.
Organic matter, carbonate, and mineral compositions of all sediment samples were measured by LOI analysis following standard procedures (Dean, Reference Dean1974; Heiri et al., Reference Heiri, Bugmann, Tinner, Heiri and Lischke2006). Sediments were oven dried for 24 hours at 105°C and then weighed to obtain a dry weight for calculation of initial water content; subsequent compositional percentages are reported relative to dry weight. Next, organics and carbonates were removed by combusting sediments in a muffle furnace at 500°C and 1000°C, respectively. Target temperatures were held for 1 hour (ramp rate: 3.5°C per minute). Following combustion, samples were cooled and weighed to determine sample loss and calculate organic content (sample loss at 500°C), carbonate content (sample loss at 1000°C), and mineral content (remaining ash from sample). Repeated analysis of two internal standards, one carbonate and one organic, showed a standard error of measurement of 0.1% (n = 12).
Along with compositional analysis based on LOI, we measured the carbon isotopic composition (δ13C) and organic carbon and nitrogen content of sediments (n = 136) retrieved from aeolian deposits in the cave. After powdering and homogenizing sediments, a 100-mg split was taken from each, weighed into glass tubes, and acid-rinsed to remove carbonates following a modified method from Larson et al. (Reference Larson, Heikoop, Perkins, Chipera and Hess2008). Samples were heated to 50°C in a heat block, treated five times with 100 μL of 6 N HCl, rinsed five times with deionized water, and then dried overnight at 50°C in a fume hood. A 50-mg split was taken from each sample, transferred to tin capsules, tightly crimped, and analyzed on a Costech 4010 Elemental Analyzer coupled to a continuous-flow isotope ratio mass spectrometer (IRMS; Thermo Finnigan Delta Plus XP) at the University of Wyoming Stable Isotope Facility.
Carbon isotope ratios are reported as delta (δ) values and calculated using the following equation:

All δ13C values were reported as per mil (‰) deviation from the internationally recognized standard Vienna PeeDee Belemnite (VPDB). Analytical precision was assessed by repeated analysis of an in-house standard (n = 28), and was better than 0.1‰ for δ13C values, 0.01% for N wt%, and 0.03% for C wt% (± 1σ).
RESULTS
Sedimentation rates and compositional analysis of Last Canyon Cave
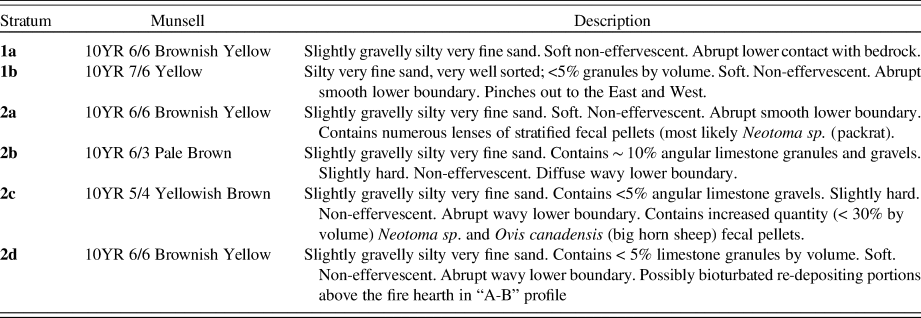
The extrapolated basal age for Last Canyon Cave was 47.3 ka BP (Fig. 3), indicating the latter third of the last glacial period is represented. Prior to 44.0 cal ka BP, modeled sedimentation was initially rapid (<180 yr/cm). Between 44.0 and 14.5 cal ka BP aeolian sedimentation slowed to between ~200 yr/cm to the low of ~830 yr/cm at 28.6 cal ka BP, the inflection point in the age-depth curve (Fig. 3). Sedimentation rates increase to the top of the section to 22 yr/cm to an approximate age of 12.8 cal ka BP. There is no evidence of a hiatus in the stratigraphic description, in the morphology of the sediments, or in the microfossil analyses (Table 2). The extrapolated age exceeds the range of calibrated radiocarbon dating resulting in a broad error for our basal age estimation (Blaauw, Reference Blaauw2010). Based on the stratigraphy, sedimentation rates, and comparison of sedimentary isotope data to global records, we present our oldest data conservatively in terms of ka BP reflecting that this material is older than the range of the calibration curve.
Sediment profile description for Last Canyon Cave.

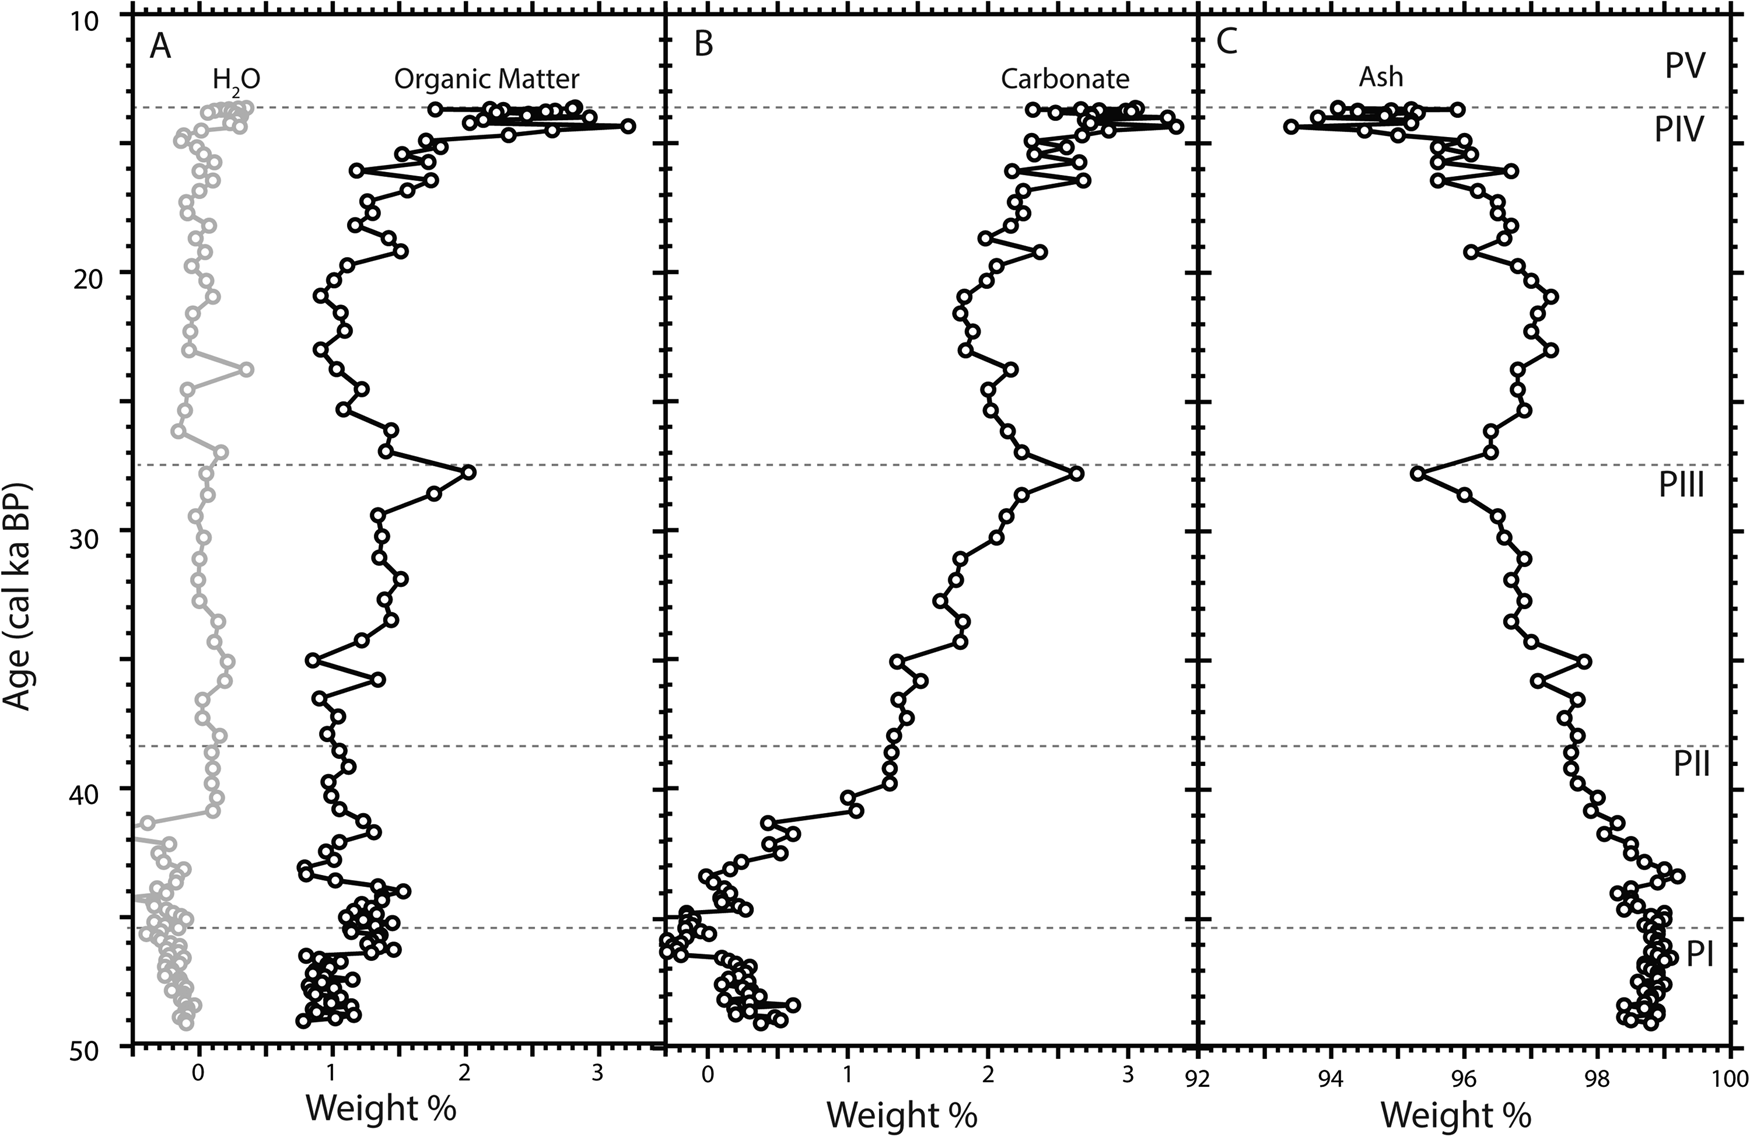
Water, organic matter, carbonate, and mineral concentrations within sediments varied with depth. Water content was extremely low throughout the section (0.0 ± 0.2 wt%) and only showed a slight decrease in wt% towards the base of the section (Fig. 4A). Values < 0 wt% likely reflect a small loss of water adhering to ceramic crucibles and are comparable to water loss determined from blanks (i.e., empty crucibles) included in each run (0.0 ± 0.13, n = 19). Organic matter content was also low, ranging from 1–1.5 wt% through most of the section and then increasing to 2–3 wt% towards the top (15 cal ka BP and younger) (Fig. 4A). Carbonate concentration varied significantly through the section, starting at 0.0 to 0.5 wt% at the base of the section (50–45 ka BP), before rapidly increasing to 1.5 wt% by 40 cal ka BP (Fig. 4B). Above this level, carbonate content slowly increases to a brief peak at 2.6 wt% (27.8 cal ka BP) and then drops to a baseline value of ~2.0 wt% (Fig. 4B). A final increase in carbonate wt% occurs towards the top of section (14.3 cal ka BP and younger) where values range from 2.5 to 3.3 wt%. The remaining ash showed its highest concentration at the base (~99.0 wt%) of the section, which was maintained until ~43 cal ka BP when the concentration began to steadily drop, reaching its lowest values at the top of the section (~93.4 wt%) (Fig. 4C).
Composition based on loss-on-ignition. A) Water (gray) and organic matter (black) content (wt.%), B) carbonate content (wt. %), and C) remaining ash contents of sediments from Last Canyon Cave plotted against age and separated by pollen zones I-V. Dashed horizontal lines denote boundaries between pollen zones.

Pollen and Isotopes
The pollen and isotope record from Last Canyon Cave was divided into five zones based on a constrained cluster analysis performed on the pollen data (CONISS [Grimm, Reference Grimm, Huntley and Webb1988]). All pollen data are presented as zonal averages unless otherwise noted.
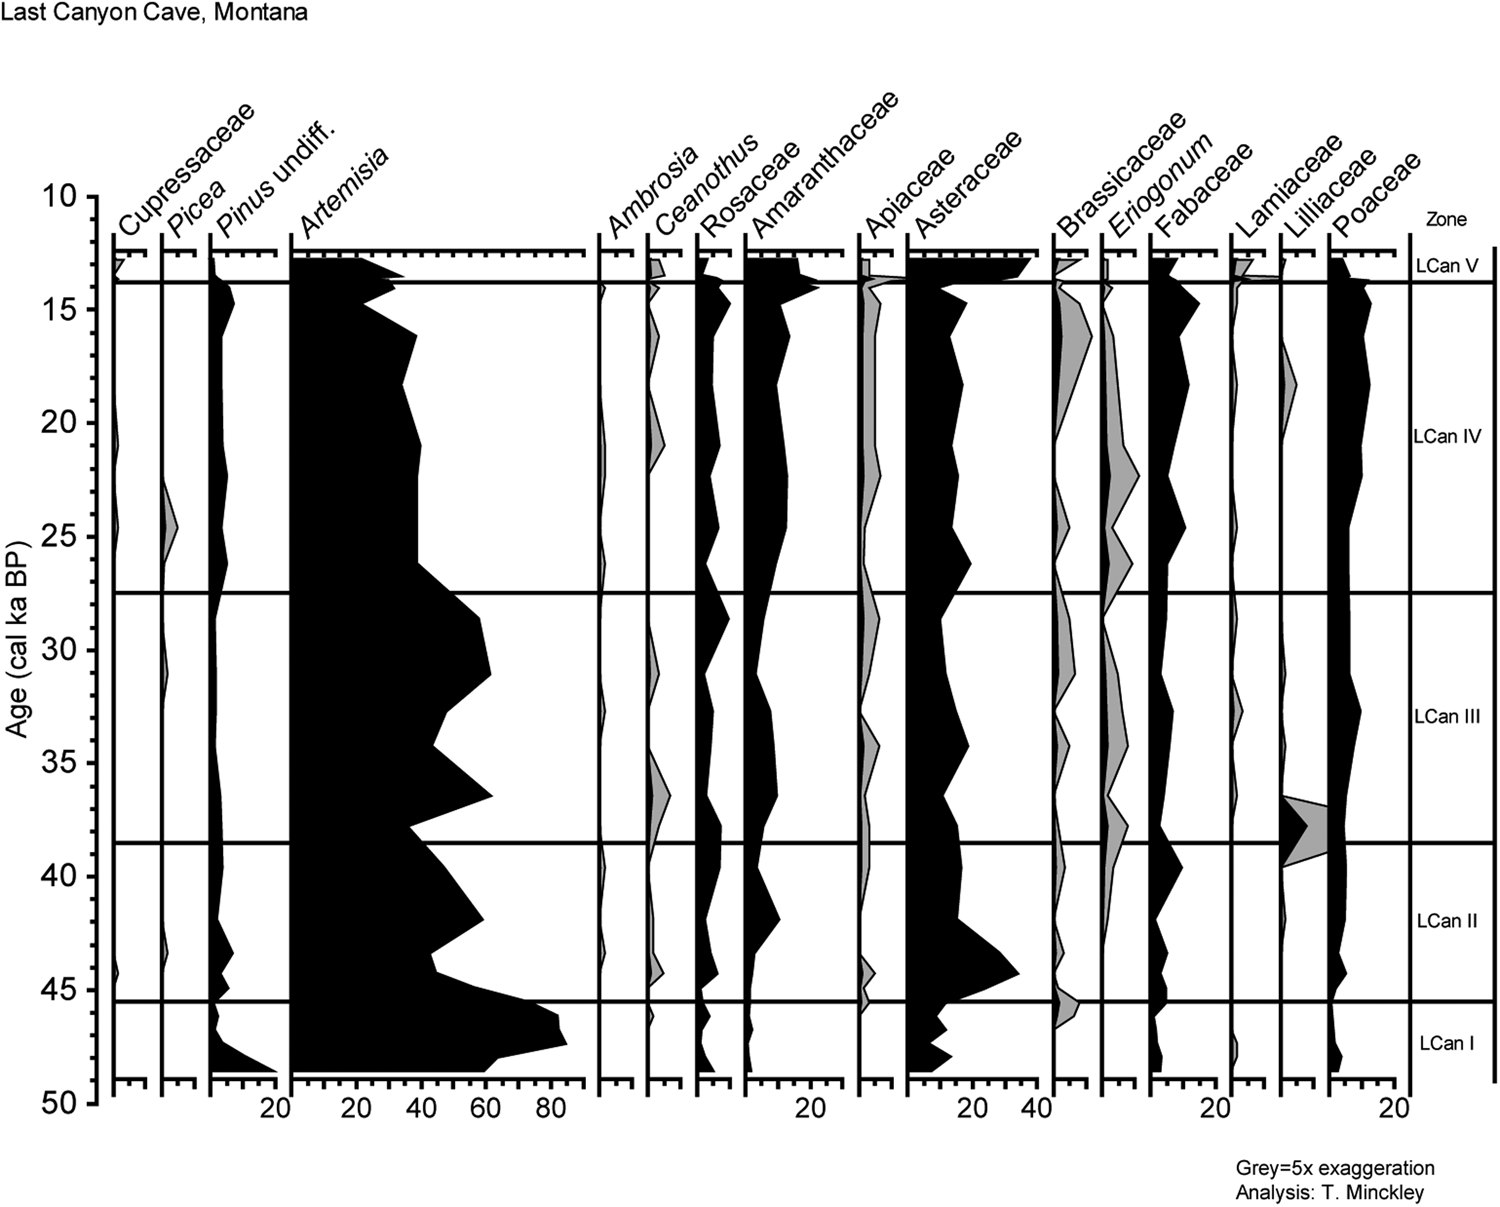
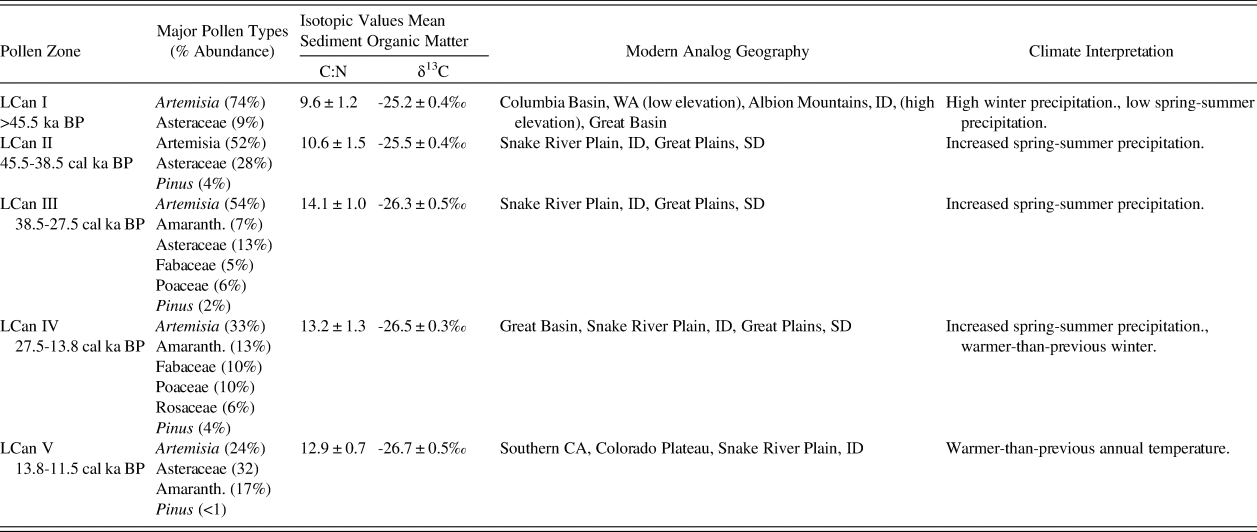
Zone I of Last Canyon Cave (LCan I) (>45.5 ka BP) has high percentages of Artemisia pollen (74%) with Asteraceae pollen (9%) the other major type in this zone (Fig. 5). No other pollen taxa are significant in this zone and all riparian types are absent. The hyper-abundance of Artemisia and lack of significant herbaceous taxa diversity in this zone suggests arid conditions supporting deep rooted taxa (e.g., sagebrush), possibly representing greater winter, but lower spring and summer moisture availability (Grimm, Reference Grimm2001). Few modern samples in western North America and no last glacial fossil pollen records have Artemisia pollen as high as those seen in this zone (Grimm, Reference Grimm2001; Minckley et al., Reference Minckley, Bartlein, Whitlock, Shuman, Williams and Davis2008). Modern pollen analogs are distributed primarily in the Columbia Basin, WA (low elevation) and the Albion Mountains, ID (high elevation), and in the Great Basin.
Pollen diagram for Last Canyon Cave with age plotted on the y-axis and relative abundance of each taxa plotted on individual x-axes. Grey shading represents 5x exaggeration so patterns in rare pollen types can be seen. Pollen zonation is based on stratigraphically constrained cluster analysis (Grimm, Reference Grimm1987).

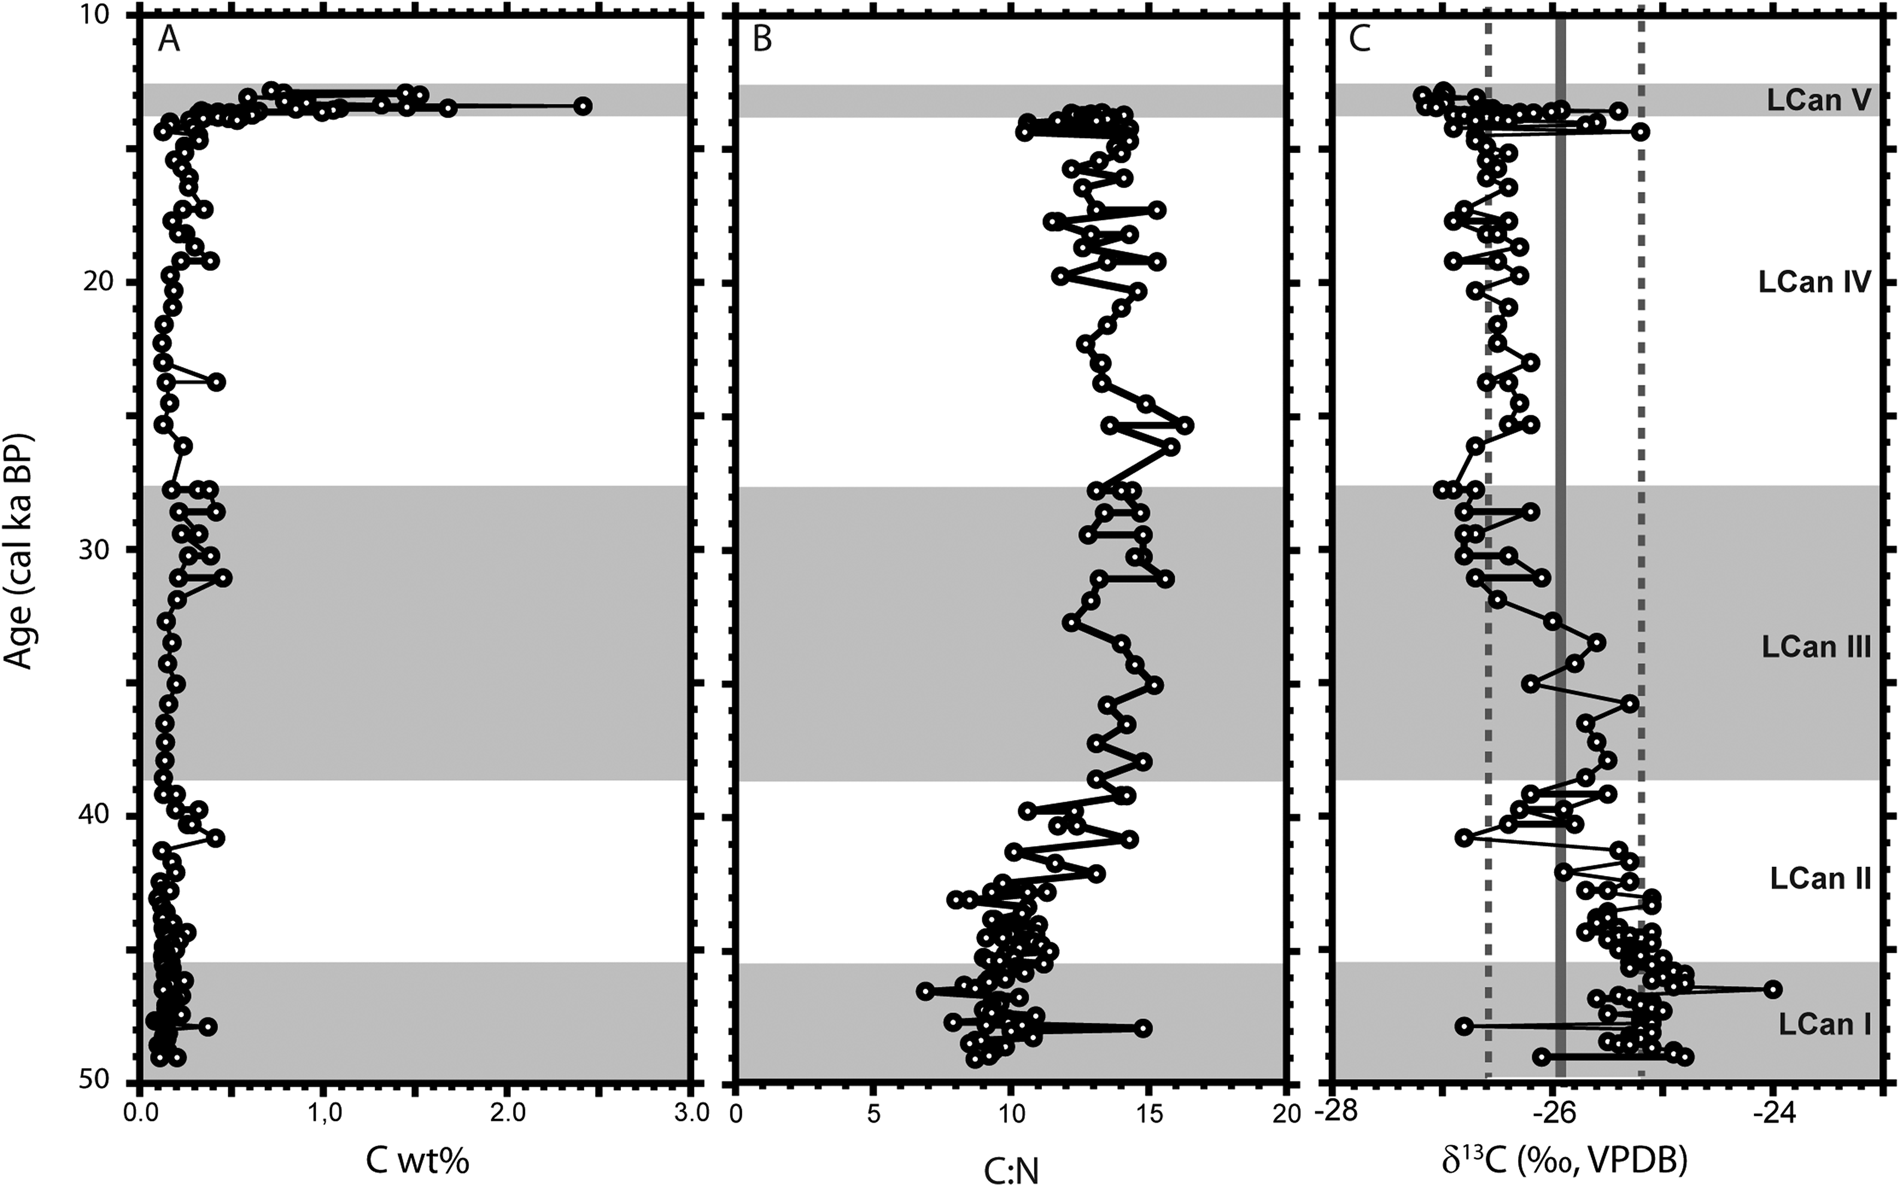
Organic C wt% for sediments was low for LCan I (mean = 0.15 ± 0.07 wt%, min. = 0.1 wt%, max = 0.4 wt%) (Fig. 6A). Likewise, C:N values were lowest at the base of the section and rose steadily and consistently through LCan I (mean = 9.6 ± 1.2, min = 6.9, max = 14.8) (Fig. 6B). Organic matter δ13C values from sediments were low and uniform through LCan I (mean δ13C = -25.2 ± 0.4‰), consistent with a flora dominated by C3 vegetation and similar to the present condition (Fig. 6C).
Compositional data for sedimentary organic matter from Last Canyon Cave including A) organic carbon wt% (C wt%), B) carbon to nitrogen ratio (C:N), and C) carbon isotope values (δ13C). Data in all graphs are plotted against age using the age model generated for this study. Alternating gray and white zones in each graph identify the five major pollen zones (LCan I to LCan V) recovered from Last Canyon Cave.

Zone LCan II (45.5–38.5 cal ka BP) was still dominated by Artemisia pollen (52%), but had a higher representation of herbaceous taxa (Amaranthaceae, Asteraceae, Fabaceae, Poaceae, Polygonaceae). Of these herbaceous types, Asteraceae was dominant (28%). The increase in herbaceous taxa suggests an increase in spring/summer precipitation in the Bighorn Basin. Pinus pollen was relatively abundant (4%) as compared to the rest of this record, possibly indicating in-migration of this genus to low elevations of the Bighorn Basin distal to glacial margins. However, compared to modern pollen spectra Pinus pollen could easily be considered extra-local (Minckley et al., Reference Minckley, Bartlein, Whitlock, Shuman, Williams and Davis2008). Modern pollen analogs for this period come mostly from the Snake River Plain, ID, extending eastward into the Great Plains region in South Dakota (Minckley et al., Reference Minckley, Bartlein, Whitlock, Shuman, Williams and Davis2008).
Carbon content (mean = 0.16 ± 0.08 wt%, min = 0.1 wt%, max = 0.4 wt%) and C:N values (mean = 10.6 ± 1.5) in LCan II remained low and similar to those from LCan I, though the range in C:N values was slightly smaller (min = 8.0, max = 14.3) (Fig. 6A, B). Carbon isotope values of organic matter (Fig. 6C) at the base of LCan II (45.5–41.5 cal ka BP) were similar to those in LCan I (mean δ13C = -25.4 ± 0.2‰) and consistent with little to no C4 presence (<10% of vegetation biomass). However, towards the top of this zone (41.5–38.5 cal ka BP), δ13C values significantly decreased, peaking at -26.8‰ at 40.8 cal ka BP and yielding a new mean value of -26.0 ± 0.5‰.
Zone LCan III (38.5–27.5 cal ka BP) had slightly higher-than-previous Artemisia pollen percentages (54%), but was highly variable (47–61%). Increases in herbaceous taxa (Amaranthaceae [7%], Asteraceae [13%], Fabaceae [5%], Poaceae [6%]) were notable during this time. Pinus pollen percentages decrease slightly to 2%. The herbaceous pollen increase suggests continued increase in growing season precipitation. Modern pollen analogs are equally distributed between the Snake River Plain, ID, and the Great Plains region.
Organic carbon content was slightly higher in LCan III (mean = 0.23 ± 0.11 wt%) than in lower levels but the range in content was similar (min = 0.1 wt%, max = 0.5 wt%) (Fig. 6A). Organic matter C:N values rose steadily in LCan III (mean C:N = 14.1 ± 1.0), which coincided with a significant decrease in δ13C values (mean δ13C = -26.3 ± 0.5‰) (Fig. 6B). As with the earlier zone, there is a pronounced, but larger decrease in mean δ13C values (0.9‰), from a high of -25.7 ± 0.3‰ from 38.5 to 33.0 cal ka BP to a low of -26.6 ± 0.3‰ from 33.0 to 27.5 cal ka BP (Fig. 6C).
Zone LCan IV (27.5-13.8 cal ka BP) had a steep decline in Artemisia pollen percentages (33%), which was offset by increases in Rosaceae (6%), Amaranthaceae (13%), Fabaceae (10%), and Poaceae (10%) pollen percentages. Pinus pollen percentages (4%) were similar to values in LCan II. Deciduous tree pollen (Acer, Populus) was present at trace values. The growing significance of herbaceous pollen abundance and evidence of deciduous trees establishing within the pollen source area suggest warmer-than-previous winters, and continued increases of growing season moisture. Modern pollen analogs come from the Great Basin, Snake River Plain, and Great Plains regions.
Carbon content of organic matter from LCan IV was similar to that of LCan III in terms of mean value (0.25 ± 0.12 wt%) and range (min = 0.1 wt%, max = 0.6 wt%) (Fig. 6A). Organic matter C:N values for sediments (mean C:N = 13.2 ± 1.3; n = 40) were slightly lower than and statistically distinct (Student's t test, t = 2.5498, p = 0.013) from those recovered from the preceding interval (Fig. 6B). Sediment δ13C values also continued to decrease slightly (mean δ13C= - 26.5 ± 0.3‰), but did show a short excursion to higher values (-25.7‰ to -25.2‰) from 14.3 to 14.0 cal ka BP. This increase in δ13C values represents a dramatic and short-lived return to values that had not been matched since 33 cal ka BP (Fig. 6C).
Zone LCan V (13.8-12.8 cal ka BP) dates to the onset of the Younger Dryas chronozone. Pollen data show a marked increase in Asteraceae (32%) and Amaranthaceae (17%), with a corresponding decrease in Artemisia (24%). Pinus pollen percentages were negligible (<1%), suggesting local loss of this genus prior to the late-glacial/Holocene transition. Increases in herbaceous taxa and decreases in shrub taxa indicate warmer-than-previous conditions establishing. Modern pollen analogs are widely distributed from southern California, the Colorado Plateau, and the Snake River Plain, ID.
Organic carbon content significantly increased in LCan V (mean = 0.90 ± 0.52 wt%) (Fig. 6A). Organic matter C:N values for sediments remained high (mean C:N = 12.9 ± 0.7) and δ13C values (Fig. 6B,C) were similar to average values reported from zone IV (mean δ13C = -26.6 ± 0.5‰; n = 27), reaching the lowest value observed in the section (-27.2‰ at 13.0 cal ka BP). These values are consistent with seasonally wetter and warmer conditions in the area.
DISCUSSION
Multiproxy analyses provide insights into environmental changes that would be difficult to attain from any single proxy. The record from Last Canyon Cave provides a unique, continuous view of conditions in the Bighorn Basin during much of Marine Isotope Stage 3 (MIS 3), the buildup to the LGM (MIS 2), and the decline of the continental ice sheets at the end of the Pleistocene. Our analysis combines millennial-scale observations of palyno-floristic composition and sedimentary isotopic data for the latter half of the last glacial period in western North America.
Sedimentary organic matter retrieved from Last Canyon Cave showed an order of magnitude drop in yield, starting at 1–2 wt% organic carbon at the top of the section and dropping off to 0.1–0.5 wt% for all layers below 23 cm (~ 1 m of section). This decline in abundance may reflect either an increase in degradation of the organic matter or a decline in organic matter influx with age. Of these two options, the C:N values for the organic matter support the latter interpretation; the change in ratio of these two elements is small through most of the section even though the C wt% drops significantly. Furthermore, associated coprolites from small mammals, which likely represent a primary source of organic matter at this site, show a similar pattern with depth/age even though the C wt% of these trace fossils are an order of magnitude greater (22.3 ± 6.6 wt%) than that of the surrounding sediment. This indicates that even though the yield of organic matter is low, its original isotopic and elemental compositions have not been significantly changed, and because δ13C values of feces have been used as a recorder of diet and local vegetation (Sponheimer et al., Reference Sponheimer, Robinson, Ayliffe, Passey, Roeder, Shipley, Lopez, Cerling, Dearing and Ehleringer2003; Codron et al., Reference Codron, Codron, Sponheimer, Lee-Thorp, Robinson, Grant and De Ruiter2005; Sponheimer et al., Reference Sponheimer, De Ruiter, Codron, Codron and Lee-Thorp2005; Codron et al., Reference Codron, Codron, Lee-Thorp, Sponheimer, De Ruiter, Sealy, Grant and Fourie2007; Hwang et al., Reference Hwang, Millar and Longstaffe2007), the isotopic record from these sediments can serve as a robust proxy for the local vegetation history of the area.
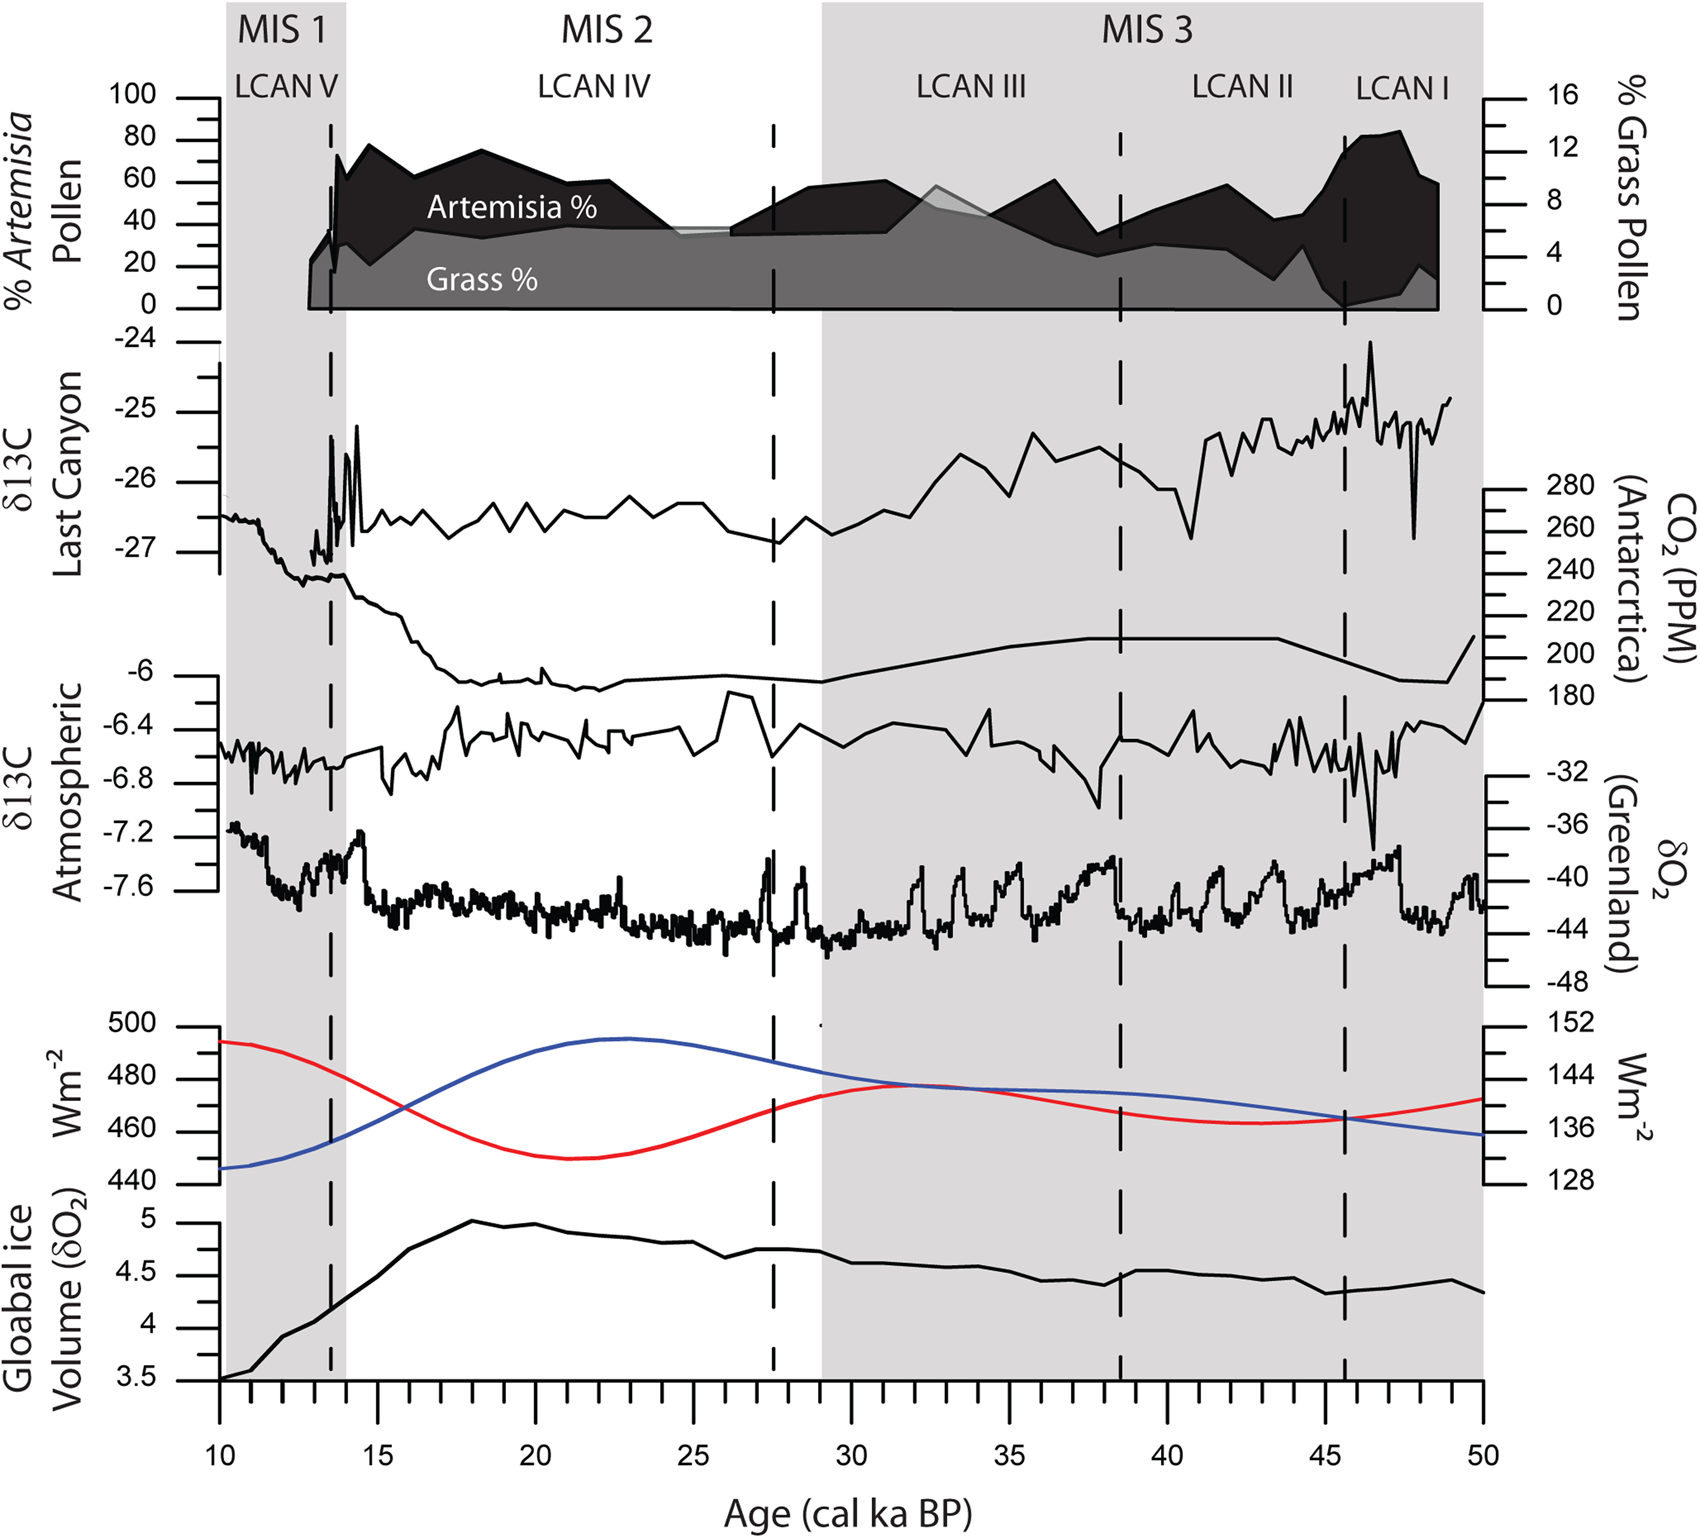
Organic matter δ13C values from Last Canyon Cave fell within a range typical for C3 vegetation from the Pleistocene (-27.2‰ to -24.0‰) with no evidence for a significant contribution of C4 grasses (modern δ13C = -12.5‰ [Cerling et al., Reference Cerling, Harris, MacFadden, Leakey, Quade, Eisenmann and Ehleringer1997]). Sedimentary organic matter showed a small but robust negative shift of 1.5‰ to 2.0‰ in baseline δ13C values from the base to the top of the section. The transition in values occurred between 60–80 cm depth, which, based on the age model, is equivalent to the interval from 35.0 to 40.0 cal ka BP and pollen zone LCan III. Another small drop of ~0.5‰ occurs in the upper 10 cm of the section, which is dated as extending from 12.8 to 14.0 cal ka BP and preceding the onset of the Younger Dryas event. A comparison of these isotopic shifts with records of the carbon isotopic composition of atmospheric CO2 for this interval (Schmitt et al., Reference Schmitt, Schneider, Elsig, Leuenberger, Lourantou, Chappellaz, Köhler, Joos, Stocker and Leuenberger2012; Eggleston et al., Reference Eggleston, Schmitt, Bereiter, Schneider and Fischer2016) does not show a strong correlation; the largest shift in atmospheric CO2 δ13C values (~0.5‰) during this interval (10–50 cal ka BP) occurs at ~17 cal ka BP, which falls between the dates for the two isotopic shifts observed from this site (Fig. 7). This suggests that the carbon isotopic record from these sediments may be more strongly controlled by the local environmental conditions at this site rather than global changes in atmospheric CO2. We therefore interpret the carbon isotopic data through the lens of floral changes determined through pollen analysis at Last Canyon Cave.
(color online) Comparison of late Pleistocene climate data: Top panel: Summary of major changes of dominant pollen types Artemisia (black) and Poaceae (grey); second panel: δ13C values from sedimentary organic matter sampled through the measured section; third panel: atmospheric CO2 from Antarctica (Monnin et al., Reference Monnin, Indermuhle, Dallenbach, Fluckiger, Stauffer, Stocker, Raynaud and Barnola2001; Monnin et al., Reference Monnin, Steig, Siegenthaler, Kawamura, Schwander, Stauffer, Stocker, Morse, Barnola, Bellier, Raynaud and Fischer2004; Petit et al., Reference Petit, Jouzel, Raynaud, Barkov, Barnola, Basile, Bender, Chappellaz, Davis and Delaygue1999); fourth panel: composite atmospheric δ13C (Eggleston et al., Reference Eggleston, Schmitt, Bereiter, Schneider and Fischer2016; Schmitt et al., Reference Schmitt, Schneider, Elsig, Leuenberger, Lourantou, Chappellaz, Köhler, Joos, Stocker and Leuenberger2012); fifth panel: δ18O from Greenland (members, 2004); sixth panel: summer and winter insolation for 45°N (Berger and Loutre, Reference Berger and Loutre1991); seventh panel: global ice volume for the last 50 ka (Lisiecki and Raymo, Reference Lisiecki and Raymo2005). Gray bars show the timing of Marine Isotope Stage, dashed lines indicate ages of vegetation changes based on pollen zones.

The vegetation history from Last Canyon Cave suggests an increase in the floristic diversity surrounding the site from 49.0 ka BP to the end of the Pleistocene (Table 3). Sagebrush dominates the entire record, but was particularly abundant (Artemisia values >80%) prior to 46 ka BP. Relatively cool summers would be expected based on decreasing 45°N July insolation at this time (Berger and Loutre, Reference Berger and Loutre1991). The NorthGRIP (2004) δ18O record indicates initially cold conditions rapidly transitioning to a warm interval prior to 47 ka BP. The nearest terrestrial record, Carp Lake, WA, indicates open forests/parklands with a dominance of sagebrush and grasses suggestive of cool-dry conditions on the east slope of the Cascade Range (Whitlock and Bartlein, Reference Whitlock and Bartlein1997). The high δ13C values from sedimentary organic matter through this interval, which are the highest for the section (max. δ13C = -24.0‰, mean δ13C = -25.2‰) are consistent with extremely dry and open conditions.
Summary of pollen, isotopic, and climatic interpretations from Last Canyon Cave.

Between 45.5 and 38.5 cal ka BP, increases in the Asteraceae and Poaceae pollen types and the slight increase in Pinus pollen abundance indicate greater plant diversity, and possible lengthening of the growing season (Fig. 7). Winter-dominated precipitation is suggested based on the distribution of modern pollen analogs. A steady decline in isotopic values indicates slightly wetter conditions or at least less water-stressed vegetation, which might indicate increases in spring-summer precipitation.
Summer insolation was lower than the onset of the paleoenvironmental record, and winter insolation was increasing in the Northern Hemisphere between 45.5 and 38.5 cal ka BP (Berger and Loutre, Reference Berger and Loutre1991) (Fig. 7). In western North America, fluctuations of warm-wet conditions are suggested by variation in total organic carbon content within pluvial lakes in the Great Basin (Benson, Reference Benson1999), while closing of forests, possibly indicative of higher effective moisture, is suggested in the temperate Pacific Northwest (Whitlock and Bartlein, Reference Whitlock and Bartlein1997; Minckley et al., Reference Minckley, Bartlein, Whitlock, Shuman, Williams and Davis2008). In the valleys of the intermountain West, widespread steppe conditions, suggestive of cold dry conditions, are inferred from abundant Artemisia and Amaranthaceae pollen at Grays Lake, ID (Beiswenger, Reference Beiswenger1991).
Between 38.5 and 27.5 cal ka BP, pollen data suggest highly variable conditions with large changes apparent in Artemisia pollen percentages consistent with millennial- scale climate fluctuations of Northern Hemisphere temperatures (Dansgaard et al., Reference Dansgaard, Johnsen, Clausen, Dahljensen, Gundestrup, Hammer and Hvidberg1993; Bond et al., Reference Bond, Showers, Elliot, Evans, Lotti, Hajdas, Bonani, Johnson, Clark, Webb and Keigwin1999; Van Meerbeeck et al., Reference Van Meerbeeck, Renssen and Roche2009). Modern pollen analogs suggest winter precipitation dominance, but total palynologic diversity is higher, suggesting increased effective moisture during the summer growing season. While hemispheric temperatures were variable and the seasonal contrast of summer to winter insolation was low from 45 to 30 cal ka BP (Berger and Loutre, Reference Berger and Loutre1991) increased aridity appears in most records from western North America (Beiswenger, Reference Beiswenger1991; Whitlock and Bartlein, Reference Whitlock and Bartlein1997; Benson, Reference Benson1999).
The interval between 27.5 to 13.8 cal ka BP spans the LGM and the decline of North American glaciation (Lisiecki and Raymo, Reference Lisiecki and Raymo2005). After 27 cal ka BP, pollen data show increases in arboreal types, and decreases in Artemisia and forbs. Increases in arboreal pollen spectra at this time might be indicative of low-elevation stands of pine (Pinus) and spruce (Picea) trees on the lower slopes of the Pryor Mountains (Fig. 5). Rosaceous taxa might also have increased at this time, but this pollen type had been consistently present since 45.0 cal ka BP (Fig. 5).
Model simulations comparing temperatures between MIS 3 and the LGM estimate global temperatures decreased 1.7–2.0°C during this time (Van Meerbeeck et al., Reference Van Meerbeeck, Renssen and Roche2009). Consistent with the Last Canyon Cave record, the Carp Lake record indicates the coldest, driest period of that record as well (Whitlock and Bartlein, Reference Whitlock and Bartlein1997). Increased arboreal pollen suggests wetter than previous conditions in the Rocky Mountains, supported by regional lake level increases during the full glacial (Beiswenger, Reference Beiswenger1991; Benson, Reference Benson1999). Carp Lake, WA (Whitlock and Bartlein, Reference Whitlock and Bartlein1997), which recorded increases in forest cover after 15.0 cal ka BP, lags the response to warming Northern Hemisphere temperatures prior to the Younger Dryas chronozone observed at Last Canyon Cave. Other records from Wyoming indicate persistent cold temperatures, but increases in arboreal pollen reflect generally increasing moisture availability in the region (Beiswenger, Reference Beiswenger1991; Whitlock, Reference Whitlock1993; Minckley et al., Reference Minckley, Shriver and Shuman2012b).
Post-glacial conditions, coincident with the onset of the Younger Dryas chronozone, are environmentally similar to those observed around 46.0 cal ka BP at Last Canyon Cave with low arboreal pollen abundances and high Asteraceae pollen abundances. Despite cooling associated with the Younger Dryas chronozone, proximal continental ice sheets no longer directly influenced conditions in the Bighorn Basin (COHMAP, 1988; Bartlein et al., Reference Bartlein, Anderson, Anderson, Edwards, Mock, Thompson, Webb and Whitlock1998; NorthGRIP_members, 2004). The qualitative character of the pollen assemblages of the Younger Dryas chronozone at Last Canyon Cave, with their increase in annuals, and modern pollen analogs, suggest greater effective springtime moisture. Organic matter δ13C values through this interval exhibit little variation through most of the section, maintaining the low δ13C values established by the end of the preceding pollen zone (mean δ13C = -26.5 ± 0.3‰). During the Younger Dryas chronozone, regional temperature depression in the Rocky Mountains is estimated to be between 0.4 to 0.9°C (Reasoner and Jodry, Reference Reasoner and Jodry2000). While the Last Canyon record only captures the beginning of the time interval, our data may reflect lower temperatures that would have reduced evaporative rates at lower elevations, such as in the Bighorn Basin, thus increasing effective moisture and promoting the net increase in herbaceous taxa. However, in southeast Wyoming, high resolution pollen data suggest the Younger Dryas was climatically variable with periods of cold-arid and cool-wet conditions (Minckley et al., Reference Minckley, Shriver and Shuman2012b).
Full glacial climate in North America was strongly influenced by the height and extent of the Laurentide Ice Sheet (Kutzbach et al., Reference Kutzbach, Gallimore, Harrison, Behling, Selin and Laarif1998; Licciardi et al., Reference Licciardi, Clark, Jenson and Macayeal1998; Van Meerbeeck et al., Reference Van Meerbeeck, Renssen and Roche2009). Model simulations and empirical proxy data indicate the presence of strong glacial anticyclones, displacing moisture flow from the Pacific Ocean into the continent, which in turn filled pluvial lake basins and promoted woodland expansion throughout the North American deserts. The Pryor Mountains did not experience late-Pleistocene glaciation. However, the region has been modeled as being strongly influenced by the proximity of the Laurentide Ice Sheet to the north and east, and to a much lesser extent the Yellowstone Ice Cap to the west (COHMAP, 1988; Licciardi et al., Reference Licciardi, Clark, Jenson and Macayeal1998; Licciardi et al., Reference Licciardi, Clark, Brook, Elmore and Sharma2004). Last glacial climates likely altered local climate with a strong glacial anticyclone producing cold, arid airflow into the Bighorn Basin and reducing moisture flow from the west (Broccoli and Manabe, Reference Broccoli and Manabe1987; Bartlein et al., Reference Bartlein, Anderson, Anderson, Edwards, Mock, Thompson, Webb and Whitlock1998; Kutzbach et al., Reference Kutzbach, Gallimore, Harrison, Behling, Selin and Laarif1998; Hostetler et al., Reference Hostetler, Clark, Bartlein, Mix and Pisias1999). Within this hemispheric context, the local to regional scale record of Last Canyon reveals a dynamic response to climate variability through MIS 3 and MIS 2 (Fig. 7). Isotopic data record a small but significant shift in δ13C values of ~0.5‰ just before the onset of the Younger Dryas event; values drop from an average of -26.5‰ at 13.8 cal ka BP to -27.0 ± 0.1‰ for the upper 10 cm of the section. This shift is consistent with the initial warming and wetter conditions that marked the end of the last glaciation and occurred just before the Younger Dryas event.
Environmental records spanning large portions of the last glacial period in North America are relatively rare (e.g., Beiswenger, Reference Beiswenger1991; Whitlock et al., Reference Whitlock, Sarna-Wojcicki, Bartlein and Nickmann2000). Our multiproxy study contributes to a greater understanding of the world under vastly different boundary conditions (Kutzbach et al., Reference Kutzbach, Gallimore, Harrison, Behling, Selin and Laarif1998) and provides insight to the resources available to the fauna of that time (Wang, Reference Wang1988; Chorn et al., Reference Chorn, Frase and Frailey1988; McNulty et al., Reference McNulty, Calkins, Ostrom, Gandhi, Gottfried, Martin and Gage2002).
CONCLUSIONS
Our study provides rare insight to the environmental responses as the North American ice sheets grew and eventually collapsed. A 40,000 year-long North American record from the last ice age was used to examine environmental change in the Bighorn Basin. Interpretation of pollen and isotope data suggests changes in the annual distribution of precipitation were the main drivers of vegetation changes at the boundary of the Rocky Mountains and Great Plains. Increases in floristic diversity are evident, as aridity decreased locally from MIS 3 to the LGM (MIS 2). Isotopic analysis reveals a significant shift of ~1.5‰ across this interval with a second smaller shift of ~0.5‰ just before the Younger Dryas—shifts that most likely reflect changes in the amount and season of precipitation as the climate moved from glacial to interglacial conditions.
ACKNOWLEDGMENTS
For this paper, the research was designed by Thomas Minckley, Mark Clementz, and Marcel Kornfield. Research was performed by Minckley, Clementz, and Kornfield, as well as by Mary Lou Larson and Judson Finley. The data was analyzed by Minckley and Kornfield, and Minckley, Clementz, Kornfield, Larson and Finley wrote the manuscript. Last Canyon Cave study is a partnership between the Bureau of Land Management, Billings Office, and the University of Wyoming, with the funding provided through Rocky Mountain CESU (Cooperative Ecosystem Study Unit). We appreciate the effort of Glade Hadden of the Montana BLM who initiated this project and Carolyn Sherve-Bybee who followed Hadden at the Billings office and was the team leader and our contact since the project was put into practice. Funding was also provided by the Grant-in-Aid from the University of Wyoming to Mark Clementz and Marcel Kornfeld. We acknowledge the many field and lab personnel who excavated, sorted, and cataloged the material used in this study. We thank Quaternary Research Associate Editor Aaron Diefendorf and two anonomous reviewers whose comments improved this manuscript