

Opposition is often seen as a defining feature of modern representative democracy (Dahl Reference Dahl1966b: xviii), as it provides voters with a choice at the ballot box. But this assumes that opposition and governing parties are at least somewhat distinctive for this choice to be meaningful (Thomassen Reference Thomassen, Jennings and Mann1994). In the literature, there are two seemingly contrasting observations regarding the distinction between government and opposition. On the one hand, there are concerns about a ‘blurring of opposition’, which refers to a situation in which the distinction between opposition parties and governing parties has become less clear-cut (Andeweg Reference Andeweg, Müller and Narud2013; De Giorgi and Ilonszki Reference De Giorgi and Ilonszki2018). On the other hand, there are concerns about increasing polarisation among political parties (Bäck and Carroll Reference Bäck and Carroll2018; Carothers and O’Donohue Reference Carothers and O’Donohue2019; Fiorina Reference Fiorina2017). How can we reconcile these apparently conflicting observations: how can there be both elite polarisation and a blurring of opposition?
One part of the answer is that the blurring of opposition thesis has not been studied in a comparable way over a long time. Although there is clear evidence of moderate to high levels of consensual behaviour in parliamentary voting between government and opposition in many countries, the empirical findings about the trends in opposition distinctiveness have been mixed and based on either single country studies and long time frames (De Giorgi and Marangoni Reference De Giorgi and Marangoni2015; Loxbo and Sjölin Reference Loxbo and Sjölin2017) or comparative studies and limited time frames (De Giorgi and Ilonszki Reference De Giorgi and Ilonszki2018; Hix and Noury Reference Hix and Noury2016). Therefore, we do not know how the distinctiveness of opposition parties vis-à-vis the government has developed systematically over time and how these trends can be explained.
The other part of the answer to the apparent paradox is theoretical. Elite polarisation and opposition blurring may co-exist when some opposition parties choose a polarising strategy and act very distinctively, while other opposition parties choose a more consensual style of politics and act less distinctively from the government. Thus, rather than only looking at the overall patterns of opposition party distinctiveness, it is important to also look at the trends for different types of opposition parties. We will thus focus on the different trends in opposition distinctiveness between opposition parties with government experience and permanent opposition parties (De Vries and Hobolt Reference De Vries and Hobolt2020; Tuttnauer Reference Tuttnauer2018).
Moreover, polarisation may be stronger in the electoral arena than in the parliamentary arena (Andeweg Reference Andeweg, Müller and Narud2013), while blurring has been argued to occur mostly in the latter. And within the parliamentary arena, there may be differences between the type of activity. In speech-making, parties may display increasing levels of rhetorical polarisation, while in parliamentary voting, they may act in less distinctive ways.
Thus, our contribution lies in offering (1) a longitudinal empirical analysis of opposition distinctiveness in four parliaments in terms of speech-making and parliamentary votes, and (2) an analysis of the potential explanation of these trends, with a focus on the distinction between opposition parties with and without government experience. Our empirical analyses concern the period from 1945 to 2020, which is a much longer time frame than most previous work. This allows us to track changes in parliamentary opposition distinctiveness from the heyday of the mass party until very recently. We do this by analysing four institutionally diverse country cases, in terms of their party system and the frequency of minority governments: Canada, Denmark, the Netherlands and the United Kingdom (UK). By analysing this diverse set of cases, we are most likely to find out whether trends in distinctiveness are general or limited to particular types of established democracies.
We find evidence of some opposition blurring in voting behaviour, while there is rhetorical polarisation between opposition and governing parties. Opposition parties have supported government legislation somewhat more often since the 1980s, whereas the gap between government and opposition party sentiment in speech-making has increased, especially in the UK and Canada. In terms of voting, we find the Netherlands to be an exception with increasing distinctiveness since 2000. This, however, obscures a pattern of stronger distinctiveness of permanent opposition parties and lower distinctiveness of opposition parties with government experience. Our explanatory analyses find support for the government experience of opposition parties as an important factor in explaining the differences between parties and over time, in particular in the two country cases with proportional representation.
Opposition distinctiveness
In Robert Dahl’s seminal work, an opposition is defined as an actor B that ‘cannot determine the conduct of the government’ and that is ‘opposed to the conduct of government by A’ (Dahl Reference Dahl1966b: xviii). In parliamentary democracies, this definition implies that the opposition includes the parties that do not form the government and that oppose the government’s policies. Despite the etymological roots of the word ‘opposition’, opposition parties do not always oppose the government. In ideal-typical ‘Westminster’ systems, the main opposition party (the ‘Official Opposition’) aims to replace the government of the day at the next elections and therefore indeed often opposes government legislation, rarely cooperates with the government on legislative initiatives or amendments, and rhetorically distances itself from the government of the day (Helms Reference Helms2004). However, in an ideal-type consensus democracy, not all opposition parties may take such a strongly adversarial stance: particularly smaller opposition parties that are ideologically close to the governing coalition may often choose to cooperate with the government to achieve policy goals or increase the probability of joining a future coalition government (Louwerse et al. Reference Louwerse, Otjes, Willumsen and Öhberg2017; Tuttnauer Reference Tuttnauer2018; Van Well Reference van Well2025).
We use the term opposition distinctiveness to denote the extent to which opposition parties in parliament act distinctively from the government and governing parties in parliament. As such, it is an important aspect of government–opposition relationsFootnote 1 (Andeweg Reference Andeweg, Müller and Narud2013). High levels of opposition distinctiveness can, for example, be observed when opposition parties vote distinctively from governing parties most of the time, when opposition parties rhetorically differentiate themselves from the government and governing parties, and when cooperation between governing and opposition parties in using parliamentary instruments is limited. When opposition parties often vote in line with the governing parties, when they do not rhetorically distinguish themselves from the government, and when opposition and governing party MPs often co-sponsor parliamentary bills, resolutions or questions, opposition distinctiveness is low. Patterns of opposition parties supporting a large share of government legislation have been observed in many parliaments (Andeweg Reference Andeweg, Müller and Narud2013; Blyth and Katz Reference Blyth and Katz2005; Otjes and Louwerse Reference Otjes and Louwerse2014; Russell et al. Reference Russell, Gover, Wollter and Benton2015). Many government bills pass without a parliamentary vote, and even bills that get a vote frequently receive broad support (Andeweg Reference Andeweg, Müller and Narud2013; De Giorgi and Ilonszki Reference De Giorgi and Ilonszki2018). This is not only the case in consensus systems but even in Westminster systems such as the UK (Van Mechelen and Rose Reference Van Mechelen and Rose1986).
Opposition distinctiveness is related to but different from existing concepts such as party system polarisation. Party system polarisation describes the overall differences in parties’ ideological positions in the electoral arena. There is much empirical evidence on the policy convergence of political parties related to the erosion of social cleavages that used to structure party systems and the strategy of mainstream parties to appeal to a broad audience of volatile voters (Katz and Mair Reference Katz and Mair2018). Opposition distinctiveness is, however, conceptualised in behavioural terms; it refers to the degree to which opposition parties act distinctively from the government in parliament.
Trends in opposition distinctiveness
Concerns that opposition distinctiveness is decreasing are voiced eloquently by Rudy B. Andeweg (Reference Andeweg, Müller and Narud2013), who identifies a blurring of opposition in parliament which limits party competition to the electoral arena, although he admits that his evidence is ‘largely anecdotal’ and in need of more rigorous empirical research (Andeweg Reference Andeweg, Müller and Narud2013: 111). Cross-country analysis has shown that opposition parties often vote with the government in many European countries, but the evidence on longitudinal patterns is mixed (De Giorgi and Ilonszki Reference De Giorgi and Ilonszki2018). In most of the 11 countries studied by the multi-country study edited by Elisabetta De Giorgi and Gabriella Ilonszki, a majority of opposition parties behave ‘quite’ or ‘very’ consensually. Only two parties consistently show very conflict-oriented behaviour (M5S and SEL in Italy). The analyses show stability over time in most countries, but in some, there has been a modest decrease in opposition distinctiveness in the last 20 years.
The few studies that use parliamentary voting data to examine opposition distinctiveness over a longer time provide a mixed picture. Karl Loxbo and Mats Sjölin (Reference Loxbo and Sjölin2017) provide longitudinal evidence for Sweden (1970–2014), which shows increasing levels of partisan struggle in parliament. Opposition parties have become more likely to table counter-proposals in committee, raise reservations or reject legislation outright. And governing parties have become less likely to accept opposition amendments or alternative proposals offered by the opposition. However, the analysis includes only opposition parties in the opposing ideological bloc and is based on a single country case.
Contrarily, Lukas Hohendorf et al. (Reference Hohendorf, Saalfeld, Sieberer, Bukow and Jun2020a) find a slight decrease in the opposition’s rejection of government proposals since 1998 in Germany (1949–2013). Andeweg et al. (Reference Andeweg, Irwin and Louwerse2020: 157) find that opposition support for government proposals has increased in the Netherlands between 1948 and 1990 and declined only slightly after 2006. Or Tuttnauer (Reference Tuttnauer2020) also observes a weakening government–opposition divide in the Israeli Knesset between 2003 and 2014. Thus, the evidence on opposition distinctiveness is mixed. Each of these country case studies employs different measures of opposition distinctiveness and examines different time frames. There is ‘no up-to-date comparative empirical assessment of the waning-of-opposition thesis in sight’ (Helms Reference Helms2022).
Explaining trends in opposition distinctiveness
Overall expectation and between-country variation
We expect that the profoundly changing relations between political parties and voters have led to decreasing levels of opposition distinctiveness over time. Since the 1960s and 1970s, a gradual process of partisan dealignment has occurred in Western democracies (Dalton et al. Reference Dalton, Flanagan, Beck and Alt1984; Dalton and Wattenberg Reference Dalton and Wattenberg2002; Dassonneville Reference Dassonneville2022). The bonds between parties and voters – often based on social groups such as social class or religion – have weakened and policy positions among parties have converged (Katz and Mair Reference Katz and Mair2018). Increasing volatility has incentivised opposition parties to behave distinctively from the government in the electoral arena. However, it has also resulted in party system fragmentation and an increasingly complex bargaining environment in parliament. As a result, increasingly ideologically mixed or grand coalition governments are formed (Katz and Mair Reference Katz and Mair2018).
Electoral volatility may also result in divided government, especially when elections for different houses of parliament do not coincide or when voters engage in split-ticket voting (Andeweg Reference Andeweg, Müller and Narud2013). Under ‘divided government’, the government party or parties do not command a majority in at least one house of parliament, and lawmaking requires cooperation between governing and opposition parties (Laver Reference Laver1999; Strøm Reference Strøm1990). This leads governments to accommodate the wishes of opposition parties that have a veto (or delaying) power (Hohendorf et al. Reference Hohendorf, Saalfeld and Sieberer2020b). We therefore expect that overall opposition distinctiveness in parliament shows a long-term declining trend.
We acknowledge that longitudinal patterns may diverge between country cases. One source of such divergence is the institutional setting, in particular the electoral system. In proportional electoral systems, partisan dealignment translates more easily into party system fragmentation and more complicated government formation, especially in the absence of pre-electoral coalitions or bloc politics, than in majoritarian systems. In other words, in majoritarian systems, two-party-dominated competition is more likely to remain the norm, even if voters are more volatile and consider voting for smaller parties. Although there are exceptions, such as the Conservative–Liberal Democrat coalition and the Hung Parliament witnessed in the UK in the 2010s, the coalition formation and executive-legislative relations remain more clear-cut than in, for example, the increasingly fragmented parliament of the Netherlands. Thus, we expect that opposition distinctiveness is most likely to have decreased in countries with proportional electoral systems.
Within-country variation of opposition distinctiveness
To explain the changes in opposition distinctiveness over time, we focus on institutional and party-level changes within countries. One key institution is the type of government. After all, the government and the party or parties forming the government are what opposition parties are opposing (or supporting). Lower levels of opposition distinctiveness are expected to be more prevalent when the parties that make up the government do not have a majority in all houses of parliament (minority government or divided government). In situations of minority governance, the government cannot pass legislation without support (or at least abstention) from part of the opposition. Therefore, opposition parties have an incentive to work together with the government to extract policy concessions in exchange for their support (Strøm Reference Strøm1990).
Hypothesis 1: Opposition parties behave more distinctively under majority cabinets than under minority cabinets.
Another structural explanation of low opposition distinctiveness is party system fragmentation. If the effective number of parties increases, this increases the number of parties required for a majority, which will make it more difficult to form a majority (coalition) government (Mitchell and Nyblade Reference Mitchell, Nyblade, Strøm, Müller and Bergman2008). Moreover, party system fragmentation results in a fragmented opposition (Best Reference Best2013). Under such circumstances, opposition parties may not only be interested in distinguishing themselves from the government but also from other opposition parties. Governments may end up with relevant opposition parties on both their ideological left and right (or whatever policy dimensions are relevant), and in many parliamentary votes, part of the opposition may side with the governing parties against other opposition parties (Louwerse and Otjes Reference Louwerse and Otjes2016).
Hypothesis 2: The higher the fragmentation of the party system, the less distinctively opposition parties behave.
Focusing on party-level explanations, opposition distinctiveness is likely to be affected by ideological or programmatic differences between political parties. If ideological or programmatic differences increase or decrease over time, this would likely affect the extent to which opposition parties behave distinctively in parliament. After all, if one’s ideological or issue positions are closer to the government’s, there is more reason to support their proposals and use more positive sentiment in parliamentary speeches, compared to ideologically distant parties. Previous work has demonstrated a convergence of party policy positions, particularly as a result of economic integration (Dorussen and Nanou Reference Dorussen and Nanou2006; Katz and Mair Reference Katz and Mair2018; Ward et al. Reference Ward, Kim, Graham and Tavits2015). Party position convergence in election manifestos is likely to decrease the policy differences between opposition parties and the governing coalition, decreasing opposition distinctiveness in parliament (Tuttnauer Reference Tuttnauer2018).
Hypothesis 3: The smaller the ideological distance between an opposition party and the government, the less distinctively that opposition party behaves.
Finally, trends in opposition distinctiveness may differ between (types of) parties. In the literature a distinction has been drawn between dominant (or mainstream) and challenger parties, where the key distinction is having prior experience as a governing party (De Vries and Hobolt Reference De Vries and Hobolt2020, 21). Peter Mair argues that the declining capability of mainstream parties to act both responsibly and responsively has led to a new form of opposition by parties that ‘rarely govern and also downplay office-seeking motives’ (Mair Reference Mair and Van Biezen2009: 17). We therefore expect the overall decline of government distinctiveness to be mostly driven by the increasing cooperative behaviour of opposition parties with government experience rather than the behaviour of permanent opposition parties (De Giorgi and Marangoni Reference De Giorgi and Marangoni2015; Hohendorf et al. Reference Hohendorf, Saalfeld, Sieberer, Bukow and Jun2020a). These opposition parties, without governing experience, have become stronger across Europe over the last 25 years. Moreover, there have been more and more such parties that take a strong anti-establishment position, most recently right-wing populist parties.
Hypothesis 4: Opposition parties without prior government experience behave more distinctively from the government than opposition parties with prior government experience.
The institutional context may moderate how government experience relates to opposition distinctiveness. In majoritarian systems, the official opposition has more incentives to oppose government legislation than in proportional systems with multiple opposition parties. Particularly in systems without full government alternation, opposition parties may be considering future cooperation with parties that are currently in government (Otjes and Willumsen Reference Otjes and Willumsen2019; Van Well Reference van Well2025). For other types of parliamentary behaviour, however, like speech-making, the official opposition in majoritarian systems may want to avoid overly negative language to present itself as a more convincing ‘government in waiting’. Therefore, in the analyses, we explore these patterns across systems and between the two types of parliamentary behaviour.
Data and methods
Our longitudinal observational analysis of opposition distinctiveness focuses on two key parliamentary activities: votes and speeches. These represent two important but distinct aspects of parliamentary work. Parliamentary voting is highly structured and constrained: unless all MPs choose to leave the chamber, most parliaments require MPs to choose between voting ‘yes’ or ‘no’ on a proposal. Thus, voting records reflect each MP’s or party’s expressed positions on a range of proposals. Parliamentary voting, especially on legislation, also has direct consequences for public policies. Speech-making in the plenary session is a central parliamentary activity, and while it is constrained by rules regarding floor access and the topic that is discussed, parties usually have quite a lot of freedom in deciding whether their MPs participate in a debate and what points and arguments they raise in a debate. While most work has focused on voting behaviour only, we argue that it is relevant to complement these analyses with a focus on parliamentary speech-making. Due to the constrained nature of parliamentary voting, opposition parties may behave differently when voting than when speaking. Not all proposals and topics get to a vote, thus painting a partial picture of what opposition parties do in parliament, which can be complemented by looking at their speech-making activities as well. Both instruments are used in most (national) parliaments across the world, thus enabling us to observe the same tools in multiple countries.
We acknowledge that voting procedures across countries vary, both in terms of the selection of proposals that get to a vote and the voting method used. If opposition parties in country A support a higher share of government legislation in parliamentary votes than in country B, this may be (partly) the result of selection effects (Hug et al. Reference Hug, Wegmann and Wuest2012). In some countries, only the most (politically) salient proposals get to a vote, especially if the voting procedure is cumbersome. In such circumstances, opposition distinctiveness is likely higher than in countries in which all or a very large share of bills get to a vote. Most comparative analyses of parliamentary voting behaviour do not explicitly take these selection and procedural effects into account. We opt to focus on within-country variation over time, which motivates our case selection strategy.
Country case selection
Even though parliamentary data have become available in a digitised form in many countries, the time frames covered vary substantially. Collecting and pre-processing voting and speech data requires substantial work, especially for older data, based on scanned official documents. Rather than working with a convenient selection of available data, we selected four country cases on theoretical grounds and subsequently gathered relevant data for an extended time frame (1945–2020).
Our case selection strategy is thus based on the ambition to track the development of opposition distinctiveness within countries over time. Therefore, we select a diverse set of cases in terms of two systemic variables that are known to relate to opposition distinctiveness: the size of the party system and the prevalence of minority cabinets. Concerning the former, we distinguish between systems with an effective number of parties that is close to two, and systems with a larger number of effective parties. In systems with two large parties, we expect higher levels of opposition distinctiveness, as the (main) opposition is a clear ‘government in waiting’. Concerning minority cabinet governance, we distinguish between countries with a tradition of minority cabinets and countries where such cabinets are exceptional. Minority governments require at least some opposition support to pass legislation and, therefore, one would expect lower levels of opposition distinctiveness in countries where such governments are prevalent. For each combination of the two variables, we select one country case (see Table 1). We will analyse the development of opposition distinctiveness in each country over time, thus focusing on the within-country variation in four different types of established parliamentary democracies.
Case Selection

Table 1 Long description
The table classifies four countries by two dimensions: minority cabinet formation type (regular or exceptional) and party system size (smaller or larger). Under regular minority cabinet formation, Canada is listed in the smaller party system column and Denmark in the larger party system column. Under exceptional minority cabinet formation, the United Kingdom appears in the smaller party system column and the Netherlands in the larger party system column. Each formation type includes one country with a smaller party system and one with a larger party system. The table provides categorical placement only and does not indicate how party system size or formation type were defined or measured.
Parliamentary voting data
The parliamentary voting data were obtained from various country-specific sources, which allowed us to obtain coverage between approximately 1945 and 2020 for all four country cases. For Canada, we combined data from Jean-Francois Godbout and Bjørn Hoyland (Reference Godbout and Hoyland2018), OpenParliament.ca (Mulley Reference Mulley2022) and the official parliamentary website OurCommons.ca (House of Commons 2022). For Denmark, we used data from Martin Ejnar Hansen (Reference Hansen2008), the website Hvem Stemmer Hvad (2022) and the Open Data available on the official parliamentary website (Folketinget 2022).Footnote 2 Data on the Netherlands were derived from the Dutch Parliamentary Behaviour Data set (Louwerse et al. Reference Louwerse, Otjes and van Vonno2018). For the UK, we used data from The Public Whip (2018) and David Firth and Arthur Spirling (Reference Firth and Spirling2003). Data before 1992 were collected by processing the XML files provided by the Political Mashup project (Gielissen and Marx Reference Gielissen and Marx2009).Footnote 3 In all cases, we processed information about the votes (title, type of vote) and vote decisions (including party affiliation of MPs, which was subsequently linked to government/opposition status). The parliamentary voting data were enriched with information about the partisan composition of the cabinet provided by ParlGov (Döring et al. Reference Döring, Huber and Manow2022).
We operationalised opposition distinctiveness as opposition parties opposing government legislation. For government legislation, the most complete parliamentary voting data were available, and the voting decisions in this selection of votes will, to a lesser extent, be influenced by the decision of (some) opposition parties to introduce many amendments or resolutions on specific issues, which can potentially substantially affect the voting patterns we find.Footnote 4 For our descriptive analyses, we calculated the seat-weighted opposition party opposition to bills per year. For the analyses at the party level, we measured the percentage of votes in which an opposition party opposed a government bill (during a cabinet term).
Parliamentary speech data
The data on parliamentary speech-making were also derived from various country-specific sources. For Canada, we made use of the Linked Parliamentary Data Project (Beelen et al. Reference Beelen, Thijm, Cochrane, Halvemaan, Hirst, Kimmins, Lijbrink, Marx, Naderi, Rheault and Polyanovsky2017). Danish data were derived from ParlSpeech V2 (Rauh and Schwalbach Reference Rauh and Schwalbach2020) and, before 1997, from our own scraping and processing of the scanned minutes available from the parliamentary website. Data on the Netherlands were based on The Political Mashup project (1946–1995) (Gielissen and Marx Reference Gielissen and Marx2009) and on our own processing of parliamentary speeches from official sources (Officiële Bekendmakingen 2015) (after 1995). For the UK, we used the collection of speeches collected and cleaned by Evan Odell (Reference Odell2021) (1979–2020) and the Political Mashup project (Gielissen and Marx Reference Gielissen and Marx2009) (before 1979). For most data sets, some further cleaning and pre-processing of data were necessary, for example, to add correct party affiliations to speakers and to identify whether speakers were (junior) ministers. Additional information was added from ParlGov (Döring et al. Reference Döring, Huber and Manow2022) and Who Governs (Nyrup and Bramwell Reference Nyrup and Bramwell2020).
We measured the sentiment of opposition party MPs’ speeches using the Lexicoder Sentiment Dictionary (Young and Soroka Reference Young and Soroka2012), using translated dictionaries for the Netherlands and Denmark as suggested by Sven-Oliver Proksch et al. (Reference Proksch, Lowe, Wäckerle and Soroka2019). In this approach, the number of positive and negative words in the total number of speeches held by a party’s MPs in a particular year is used to derive a sentiment score using the formula:
 \begin{equation*}{\text{Log}}\left( {\frac{{{\text{negative}} + 0.5}}{{{\text{positive}} + 0.5}}} \right)\end{equation*}
Note that we use the log-ratio of negative over positive sentiment. This means that higher values represent more negative sentiment, and thus more opposition distinctiveness. We explore the reliability of this approach in the online Supplementary Material, part D.
Independent variables
To examine whether opposition distinctiveness is lower under minority government, dummies for different cabinet types were added to the model. Data from ParlGov on governing parties’ parliamentary seat shares were used to distinguish between minority cabinets, minimal winning cabinets and surplus majority cabinets. Minority cabinets were further distinguished into substantive minority cabinets and formal minority cabinets. The latter were defined by an explicit commitment of a support party to the cabinet’s survival and its policies that helped the government to a parliamentary majority. Information on support parties was retrieved from the Party Government in Europe Dataset (Hellström et al. Reference Hellström, Bergman and Bäck2021). Data on party system fragmentation were taken from ParlGov, which provides the effective number of parliamentary parties after each parliamentary election (Laakso and Taagepera Reference Laakso and Taagepera1979).
At the party level, we expected the ideological distance between opposition parties and the government to affect the level of distinctiveness of opposition parties in voting and speech-making. Data from the Manifesto Research on Political Representation dataset were used to estimate left–right positions for each party (Volkens et al. Reference Volkens, Burst, Krause, Lehmann, Matthieß, Regel, Weßels and Zehnter2021). The Manifesto Project has collected and hand-coded election manifestos since 1945 in over 50 countries, including our four country cases. Sentences in parties’ election manifestos were sorted into one of 56 categories, resulting in percentages of each manifesto falling into each category. General left–right positions were calculated for each party using Will Lowe et al.’s (Reference Lowe, Benoit, Mikhaylov and Laver2011) scaling method. The left–right positions of governments were operationalised as the seat-weighted average of the governing parties’ left–right positions. The left–right distances between opposition parties and the government were calculated by taking the absolute distances between opposition parties’ positions and the government’s position.
To distinguish mainstream from non-mainstream opposition parties, we used a simple dichotomous measure of government experience (De Vries and Hobolt Reference De Vries and Hobolt2020). Opposition parties that had held office before the beginning of a cabinet term were considered mainstream opposition parties, whereas opposition parties that had not held office before the beginning of a cabinet term were considered non-mainstream opposition parties. This measurement is dynamic in the sense that some opposition parties’ status changes over time. Successor parties of (at least one) mainstream opposition party were coded as having had government experience. Following Catherine de Vries and Sara Hobolt (Reference De Vries and Hobolt2020), permanent opposition parties that had experience in formally supporting a minority government were treated as non-mainstream opposition parties.
As control variables, we included party seat share, whether a party was a support party, and a dummy variable for coalition government. In addition, in the country-specific models, we included two country-specific control variables: belonging to the government bloc in Denmark (Green-Pedersen and Skjæveland Reference Green-Pedersen, Skjæveland, Christiansen, Elklit and Nedergaard2020; Green-Pedersen and Thomsen Reference Green-Pedersen and Thomsen2005) and, for the Netherlands, a dummy variable that captures differences between votes taken before and after 1969, when voting procedure and registration changed in a major way.
Methods of analysis
Our analyses started by describing trends in opposition distinctiveness over time in the four country cases. We also show these trends for opposition parties with and without governing experience. We subsequently ran three types of linear regression models for legislative voting and speech-making: a party-level model, a cabinet-term-level model and a within–between model. In the party-level model, the unit of analysis is an opposition party within a cabinet term. This was implemented using a linear multilevel regression analysis with random intercepts for cabinet terms and country fixed effects. This allows us to look at both party-level explanatory factors as well as differences over time, but the downside of this approach is that part of the explanatory power might derive from explaining the differences between parties during a specific cabinet term, rather than differences over time. As our main aim is to look at explanations for the patterns over time, we also ran cabinet term-level analyses, where the unit of analysis is formed by the combined opposition during a cabinet term. In the cabinet-level model, the dependent variable thus captures the (seat-weighted) average opposition party support for government legislation and the (seat-weighted) average opposition party sentiment during a cabinet term. This was implemented using a linear regression model with country fixed effects. The third model combines these approaches: the within–between model is a version of the party-level model in which the variables that vary between parties and between cabinet terms are included in two ways: as cabinet-term mean-centred, to capture the difference between cabinet terms, and the deviation from the cabinet-term mean, to capture the within-cabinet term effects (Bell and Jones Reference Bell and Jones2015). The within–between specification thus separates the variation over time (between cabinet terms) and within-cabinet terms.
In the main text, we present the pooled models that include all four countries; the online Supplementary Material contain further model specifications and robustness checks, including separate models for each country (parts B and C of the Supplementary Material). The descriptive statistics of all variables included in the models are presented in part A of the Supplementary Material.
Patterns of opposition distinctiveness
Opposition distinctiveness in voting
We start by describing the distinctiveness of opposition parties’ voting behaviour regarding government legislation (see Figure 1). The figure shows the seat-weighted mean of opposition parties’ votes against government legislation per year. Higher levels represent more opposition distinctiveness in terms of voting. We observe much higher levels of opposition distinctiveness in Canada and the UK compared to the Netherlands and Denmark, which was expected given the majoritarian nature of democracy in the former countries, as well as the fact that voting procedures in the UK and Canada are more cumbersome than in Denmark and the Netherlands,Footnote 5 resulting in votes being called only on the more contentious issues.
Opposition Distinctiveness in Votes on Government Legislation

Figure 1 Long description
The image showing four scatter plots titled Canada, Denmark, United Kingdom and Netherlands. Text on the vertical axis: Mean share of opposition MPs opposing government legislation. Tick labels: 0 percent, 20 percent, 40 percent, 60 percent, 80 percent, 100 percent. Range: 0 percent to 100 percent. Text on the horizontal axis: Year. Tick labels: 1960, 1980, 2000, 2020. Range: 1960 to 2020. Canada: Points span from near 0 percent up to near 100 percent across the years shown. A smooth line with a shaded band runs through the points. Denmark: Points lie mostly between about 0 percent and about 35 percent, with one point near 50 percent. A smooth line with a shaded band runs through the points. United Kingdom: Points lie mostly between about 60 percent and about 95 percent, with several points lower, including near 20 percent and near 40 percent. A smooth line with a shaded band runs through the points. Netherlands: Points lie mostly between about 10 percent and about 40 percent, with several points near 0 percent. A smooth line with a shaded band runs through the points.
Opposition distinctiveness in voting increased until the 1980s in Canada, Denmark and (very marginally) the UK, after which there is a slight decrease.Footnote 6 In the Netherlands, there was a decrease in opposition distinctiveness in voting on government legislation until the early 2000s, after which it slightly increased.Footnote 7 This was the time that populist challenger parties entered the Dutch parliament in force. Thus, we do not observe a linear decline, but rather a rise and fall of distinctiveness over time. Still, opposition distinctiveness in voting behaviour is quite similar to the 1950s, with the partial exception of the Netherlands, where it is lower.Footnote 8
The overall trends do, to some extent, hide differences between different types of opposition parties. In Figure 2, we analyse opposition distinctiveness in voting for parties with and without government experience separately. Our overall expectation that parties without prior governing experience would show higher levels of distinctiveness in voting is only partially met. We see some evidence for this in the Netherlands and Denmark. In Canada, there is no clear distinction between parties with and without government experience, while in the UK, parties without prior government experience show slightly lower levels of distinctiveness. This could potentially be attributed to the fact that these small challengers in the UK context are mostly Independents (or Independent Conservatives, National Liberals, etc.) during most of the twentieth century. Moreover, in the UK and Canada, the official opposition intends to replace the incumbent government with its own single-party government, and thus has fewer incentives to support legislation of the incumbent government than in Denmark and the Netherlands.
Opposition to Government Legislation by Government Experience

Figure 2 Long description
The figure contains four sub-images arranged in a two by two grid titled Canada, Denmark, United Kingdom and Netherlands. The image A showing Canada. The x-axis is labeled Year, with labeled ticks at 1960, 1980, 2000 and 2020. The y-axis is labeled Mean share of opposition MPs opposing government legislation, ranging from 0 percent to 100 percent with labeled ticks at 0 percent, 20 percent, 40 percent, 60 percent, 80 percent and 100 percent. Two point series are shown: circles for No and triangles for Yes, with two smoothed lines and shaded bands for each series. The No smoothed line is near 50 percent around the early years, rises to around 90 percent near about 1980, then declines to around 60 percent near about 2000 and rises again to around 70 percent by about 2020. The Yes smoothed line is near 60 percent in the early years, rises to around 80 percent near about 1980, declines to around 55 percent near about 2000 and rises to around 70 percent by about 2020. The image B showing Denmark. The x-axis is labeled Year, with labeled ticks at 1960, 1980, 2000 and 2020. The y-axis is labeled Mean share of opposition MPs opposing government legislation, ranging from 0 percent to 100 percent with labeled ticks at 0 percent, 20 percent, 40 percent, 60 percent, 80 percent and 100 percent. Two point series are shown: circles for No and triangles for Yes, with two smoothed lines and shaded bands for each series. The No smoothed line starts near about 10 percent in the early years, rises to around 40 percent near about 1980, then declines to around 25 percent by about 2020. The Yes smoothed line starts near about 5 percent in the early years, rises to around 20 percent near about 1980, then stays near about 15 percent to 20 percent through about 2020. The image C showing United Kingdom. The x-axis is labeled Year, with labeled ticks at 1960, 1980, 2000 and 2020. The y-axis is labeled Mean share of opposition MPs opposing government legislation, ranging from 0 percent to 100 percent with labeled ticks at 0 percent, 20 percent, 40 percent, 60 percent, 80 percent and 100 percent. Two point series are shown: circles for No and triangles for Yes, with two smoothed lines and shaded bands for each series. The No smoothed line is near about 40 percent in the early years, rises to around 70 percent near about 1980, then declines to around 60 percent near about 2000 and stays near about 60 percent to 65 percent by about 2020. The Yes smoothed line is near about 70 percent in the early years, stays around 75 percent to 85 percent through about 1980, then declines to around 65 percent near about 2000 and rises slightly to around 70 percent by about 2020. The image D showing Netherlands. The x-axis is labeled Year, with labeled ticks at 1960, 1980, 2000 and 2020. The y-axis is labeled Mean share of opposition MPs opposing government legislation, ranging from 0 percent to 100 percent with labeled ticks at 0 percent, 20 percent, 40 percent, 60 percent, 80 percent and 100 percent. Two point series are shown: circles for No and triangles for Yes, with two smoothed lines and shaded bands for each series. The No smoothed line starts near about 70 percent in the early years, declines to around 30 percent near about 1980, declines further to around 20 percent near about 2000, then rises to around 30 percent by about 2020. The Yes smoothed line starts near about 10 percent in the early years, rises to around 25 percent near about 1980, then declines to around 15 percent near about 2000 and stays near about 10 percent to 15 percent by about 2020. A legend below the plots is titled Government experience and lists two categories: No and Yes.
The Dutch case presents the strongest evidence for a divergent pattern of distinctiveness between opposition parties with and without prior government experience. Until the 1980s, permanent opposition parties were more distinctive than opposition parties with government experience. This is followed by a period where this difference is negligible, but in the last 20 years we observe increasing distinctiveness for permanent opposition parties and decreasing distinctiveness for parties with government experience.
In Denmark, we observe something different: there, the permanent opposition behaved most distinctively around 1980 and has become more like opposition parties with government experience since. One key difference between the Netherlands and Denmark is ‘bloc’ politics. Parties belonging to the same political bloc (left or right) as the prime minister regularly support legislation, even if they do not have a formal support agreement with the government. Even though bloc voting is not particularly strong in Denmark, the presence of blocs may partially explain why we do not observe an increasing gap in the voting patterns of permanent opposition parties and opposition parties with government experience, as in the Netherlands.
Opposition distinctiveness in parliamentary speeches
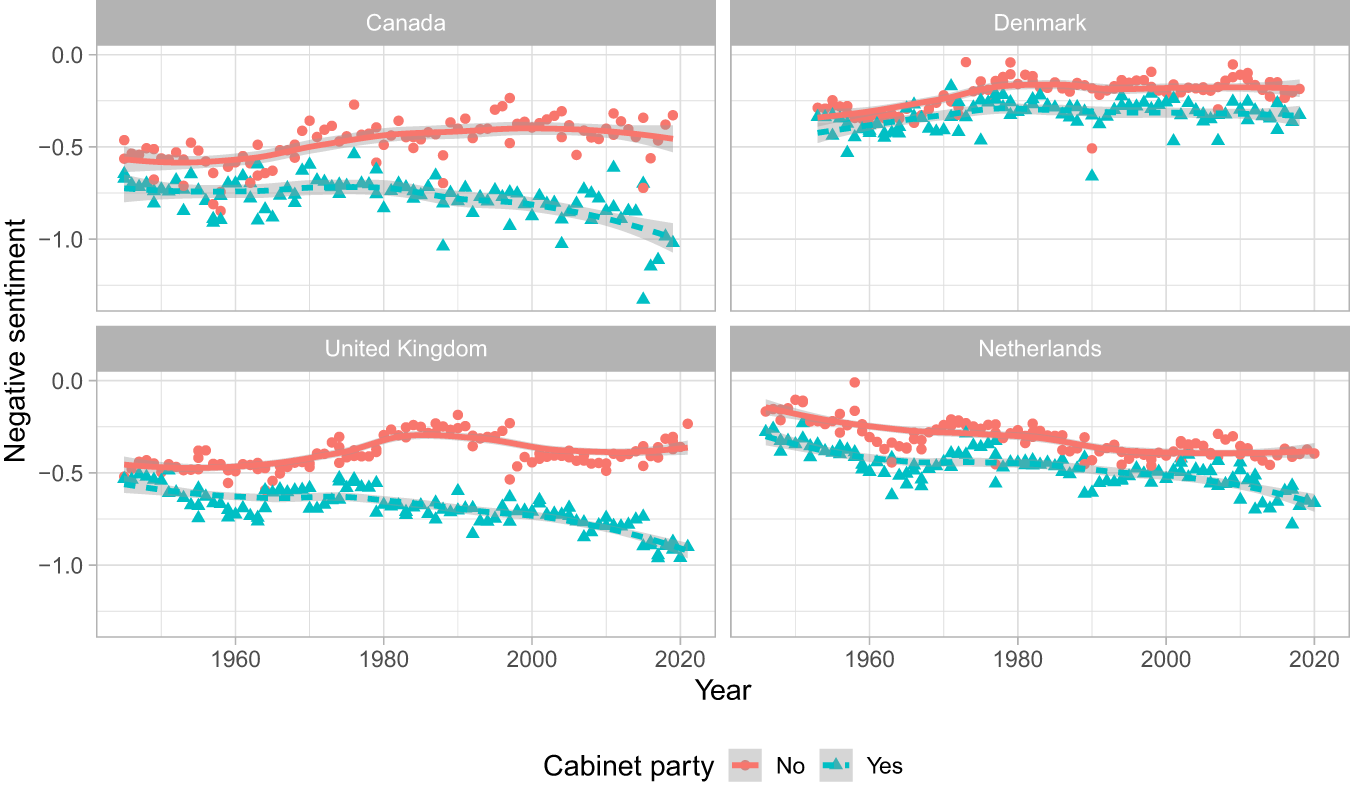
The patterns of opposition distinctiveness are quite different when we look at sentiment in parliamentary speeches (see Figure 3). High values represent more negative speech sentiment. Most clearly in Canada and the UK, we can see that the sentiment of governing party MPs has become less negative over time, while for opposition MPs it has rather become more negative. The sentiment gap between government and opposition has substantially widened in both countries, indicating increasing opposition distinctiveness in speech-making. In the Netherlands, the sentiment of both governing and opposition party MPs has become somewhat less negative over time; the sentiment gap has only increased a little bit and mainly in the 2010s. In Denmark, the speech sentiment of governing and opposition parties was very similar in the 1950s and diverged until the mid-1970s but has been stable since. These findings demonstrate that in terms of speech-making, opposition parties have generally become more distinctive over time, or remained at least as distinctive from governing parties. Admittedly, general sentiment scores for parliamentary speeches are an imperfect indicator of the distinctiveness of government and opposition, but the widening sentiment gap suggests that, on the whole, opposition parties have become more negative and governing party MPs have become less negative over time, particularly in the UK and Canada.
Negative Speech Sentiment of Governing and Opposition Parties

Figure 3 Long description
The image showing four country charts titled Canada, Denmark, United Kingdom and Netherlands. Text on the vertical axis: Negative sentiment. Text on the horizontal axis: Year. Legend text: Cabinet party; No; Yes. Legend markers: No is shown with circular markers and a smooth line. Yes is shown with triangular markers and a smooth line. Canada chart. Horizontal axis tick labels: 1960, 1980, 2000, 2020. Vertical axis tick labels: 0.0, minus 0.5, minus 1.0. Plotted values are shown as scattered markers for each year with a smooth line for each group. No series: markers and smooth line are mostly between minus 0.6 and minus 0.4, with the smooth line rising from around minus 0.6 in earlier years toward around minus 0.45 around the late twentieth century, then staying near around minus 0.5 toward 2020. Yes series: markers and smooth line are mostly between minus 0.9 and minus 0.6, with the smooth line near around minus 0.7 in earlier years and moving downward toward around minus 1.0 by 2020. Denmark chart. Plotted values are shown as scattered markers for each year with a smooth line for each group. No series: markers and smooth line cluster near the upper part of the negative range, with the smooth line near around minus 0.3 to minus 0.2 across most years. Yes series: markers and smooth line are close to the No series, with the smooth line near around minus 0.35 to minus 0.25 across most years. United Kingdom chart. Horizontal axis tick labels: 1960, 1980, 2000, 2020. Vertical axis tick labels: 0.0, minus 0.5, minus 1.0. Plotted values are shown as scattered markers for each year with a smooth line for each group. No series: markers and smooth line are mostly between minus 0.6 and minus 0.3, with the smooth line rising from around minus 0.5 toward around minus 0.35 around the late twentieth century, then moving back toward around minus 0.45 to minus 0.5 by 2020. Yes series: markers and smooth line are mostly between minus 0.9 and minus 0.5, with the smooth line moving downward over time and reaching around minus 0.9 by 2020. Netherlands chart. Plotted values are shown as scattered markers for each year with a smooth line for each group. No series: markers and smooth line are mostly between minus 0.5 and minus 0.2, with the smooth line gradually moving downward from around minus 0.25 to minus 0.3 in earlier years toward around minus 0.4 by 2020. Yes series: markers and smooth line are mostly between minus 0.7 and minus 0.3, with the smooth line gradually moving downward from around minus 0.35 to minus 0.4 in earlier years toward around minus 0.55 to minus 0.6 by 2020.
When we split opposition sentiment according to prior government experience, we observe a pattern that is somewhat comparable to the analysis of voting behaviour (see Figure 4). This is most clear for the Netherlands, where permanent opposition parties were quite negative in the 1950s and 1960s, became less negative for a significant timespan – up to a point where their sentiment was similar to that of mainstream opposition parties in the 1990s – and more negative since the 2000s. For Dutch opposition parties with government experience, we see a decline in negative sentiment during that same period. For the remaining countries, the permanent opposition parties are mostly more distinctive than the others (though not in Canada), but the development of opposition speech distinctiveness when we break down parties along government experience lines are less pronounced.
Negative Speech Sentiment of Opposition Parties with and without Government Experience

Figure 4 Long description
A) Canada. Vertical axis label: Negative sentiment. Tick labels: 0.00, minus 0.25, minus 0.50, minus 0.75. Horizontal axis label: Year. Tick labels: 1960, 1980, 2000, 2020. Legend label: Government experience. Legend entries: No; Yes. Circular markers represent No. Triangular markers represent Yes. The plotted values mostly fall between minus 0.75 and minus 0.25. The smoothed lines for both groups rise from around the minus 0.60 range in the earlier years toward around the minus 0.45 range by later years, with the two lines close to each other. B) Denmark. Vertical axis label: Negative sentiment. Tick labels: 0.00, minus 0.25, minus 0.50, minus 0.75. Horizontal axis label: Year. Tick labels: 1960, 1980, 2000, 2020. Legend label: Government experience. Legend entries: No; Yes. Circular markers represent No. Triangular markers represent Yes. Most points lie between about minus 0.35 and 0.00, with one triangular point near about minus 0.55. The smoothed line for No rises toward values near 0.00 around the middle years and then slopes downward slightly by later years. The smoothed line for Yes stays below the No line and remains around the minus 0.25 range for much of the period. C) United Kingdom. Vertical axis label: Negative sentiment. Tick labels: 0.00, minus 0.25, minus 0.50, minus 0.75. Horizontal axis label: Year. Tick labels: 1960, 1980, 2000, 2020. Legend label: Government experience. Legend entries: No; Yes. Circular markers represent No. Triangular markers represent Yes. Points extend down to around minus 0.75 and up to around minus 0.10. The smoothed line for No rises from around minus 0.50 to around minus 0.20 near the middle years, then declines toward around minus 0.40 by later years. The smoothed line for Yes rises from around minus 0.50 to around minus 0.30 near the middle years, then declines toward around minus 0.40 by later years. D) Netherlands. Vertical axis label: Negative sentiment. Tick labels: 0.00, minus 0.25, minus 0.50, minus 0.75. Horizontal axis label: Year. Tick labels: 1960, 1980, 2000, 2020. Legend label: Government experience. Legend entries: No; Yes. Circular markers represent No. Triangular markers represent Yes. The No series starts near 0.00 in earlier years and trends downward to around minus 0.35 by around the 1990s, then trends upward slightly toward around minus 0.25 by later years. The Yes series stays below the No series for most years and trends downward toward around minus 0.60 by later years. Across all four plots, the same axes and legend are used. Canada shows both groups close together with a gradual rise toward less negative values. Denmark shows the No group closer to 0.00 than the Yes group for much of the period. The United Kingdom shows both groups rising toward the middle years and then declining. The Netherlands shows the largest separation by later years, with the Yes group reaching the most negative values among the four countries.
The overall picture based on voting and speech data shows that in the Netherlands, opposition parties without prior government experience became more distinctive, whereas those with prior government experience became less distinctive. In Denmark, we see rather more stability, although in terms of voting, opposition distinctiveness has slightly declined. While both countries have a proportional electoral system, the frequency of minority governance in Denmark may require a continued effort in seeking political compromise on legislation. And even though a system of bloc politics exists, cooperation is usually not limited to these blocs. In the Netherlands, however, the rise of far-right parties has resulted in a party system that features more distinctive permanent opposition parties, while at the same time also seeing less opposition distinctiveness between opposition parties with government experience.
The overall picture based on the UK and Canada shows that the talk of opposition parties has become more distinctive, especially in comparison to governing parties, while their voting behaviour has remained distinctive overall. Perhaps the voting differences are inflated in these countries because many bills do not get a floor vote at all, but at least we see no strong trends here. If the opposition wants to increasingly distinguish itself from the government, this is done through parliamentary speech-making. In sum, we find rhetorical polarisation, but relative stability in terms of parliamentary voting.
Explaining opposition distinctiveness
Regression models of votes for government bills
We ran three regression models to examine our explanations for opposition distinctiveness: a party-level model, a cabinet-level model and a ‘within–between model’ (Bell and Jones Reference Bell and Jones2015). In the party-level and within–between models, the dependent variable is the share of government legislation opposed by an opposition party during a cabinet term. In the cabinet-level model, the dependent variable is the seat-weighted mean opposition party level of voting against government legislation. Table 2 presents the results of these analyses.
Linear Multilevel Regression Model Explaining Opposition Party Opposition to Government Bills

Table 2 Long description
Three linear multilevel regression specifications report estimates and standard errors for opposition parties’ opposition to government bills: a party-level model, a cabinet-level model, and a within-between model. Government experience is consistently negative and statistically reliable in the party-level and within-between models (about minus 0.11), indicating parties with more experience oppose less. Party seat share is consistently positive and statistically reliable in the party-level and within-between models (about 0.42 to 0.43), indicating larger parties oppose more. Substantive minority status is negative in all three models and is statistically reliable in the party-level and cabinet-level models, while formal minority and surplus majority show no clear effects. Left-right distance to the cabinet is positive and statistically reliable where included, and the cabinet-level mean distance is weakly supported in the within-between model. Cabinet-level mean government experience is negative and statistically reliable, and mean party seat share is positive and statistically reliable only in the within-between model. Model fit is high for the cabinet-level model (R squared about 0.80), and the party-level and within-between models report moderate marginal and conditional R squared values; all models include country fixed effects.
Notes: +p < 0.1, *p < 0.05, **p < 0.01, ***p < 0.001. AIC, Akaike Information Criterion; ICC, intraclass correlation coefficient; FE, fixed effects; RMSE, root mean squared error; S.E., standard error. In the ‘Within–between’ model, the party-level variables represent the difference from the cluster mean.
Under situations of a substantive minority government, opposition voting distinctiveness is significantly lower than under a minimal winning government (albeit only at the 0.1 level for the within–between model). This effect is, however, mostly driven by the short-lived Wilson III government in the UK. In Denmark and Canada, where substantive minority governments are much more common, we do not find a significant relationship (see part B in the Supplementary Material). Therefore, we should conclude that our data do not offer support for our first hypothesis.
We find little support for our hypothesis about the impact of party system fragmentation. The effective number of parties is not related to support for government legislation. Using the effective number of opposition parties as an alternative indicator of opposition fragmentation does not change this finding (see the Supplementary Material).
The left–right distance between an opposition party and the cabinet is clearly negatively related to opposition voting distinctiveness in the party-level model. The larger the left–right distance is between an opposition party and the government, the more often that opposition party votes against government bills ( $p \lt 0.01$). This effect is, however, not statistically significant in the cabinet-level models, meaning that the mean distance between opposition parties and the coalition is not related to opposition voting on government legislation. Similarly, in the within–between specification, we find that the mean left–right distance between opposition parties and the cabinet is only significantly related to opposition voting distinctiveness at the 0.1 level. When we exclude cases with a low number of votes, the finding is more robust and clearly significant (see part B.4 in the Supplementary Material). This suggests that left–right distance is clearly important in terms of the differences between parties within a cabinet term, but as an explanation for variation over time in opposition voting distinctiveness our evidence is weaker.
Finally, we turn to the difference between opposition parties with and without prior government experience. The models show that opposition parties with government experience vote against government legislation at a rate 11 percentage points lower than opposition parties without government experience ( $p \lt 0.001$). We also observe this effect in the cabinet-level model, meaning that the seat-weighted mean level of experience is negatively related to the seat-weighted opposition to government legislation across cabinet terms (
 $p \lt 0.05$). When opposition parties have more government experience on average, they reject government legislation less often. In the within–between model, both effects are statistically significant, suggesting that higher levels of government experience within and between cabinet terms drive opposition to government legislation. We should note, however, that this effect is only statistically significant in the Netherlands and Denmark, when we run the model for each country separately (see part B.1 in the Supplementary Material). In these countries, opposition parties with governing experience and ambitions may need to work together with some of the incumbent parties in the future, instead of replacing them at the next elections. Moreover, the permanent opposition in these countries includes parties with stronger populist or anti-establishment views. Those parties are generally less keen on supporting government legislation. In the UK and Canada, the official opposition has more incentives to oppose government legislation, as its main aim is to replace the incumbents.
All in all, our analysis shows the strongest support for our fourth hypothesis, namely that opposition parties without governing experience show higher voting distinctiveness than opposition parties with governing experience. The positive association in the pooled model is, however, driven by the two countries with proportional electoral systems. This association is the only one of the four we theorised that explains differences between cabinet terms: higher seat-weighted shares of opposition parties with governing experience are associated with less opposition distinctiveness in voting.
Regression models of sentiment in parliamentary speeches
A second series of multilevel linear regression models was conducted on parliamentary speeches (see Table 3). The dependent variable in these models is the negative sentiment score of opposition parties’ parliamentary speeches within a cabinet term. Higher scores represent more negative sentiment, which we see as an indication of higher opposition speech distinctiveness.
Linear Multilevel Regression Model Explaining Opposition Party Negative Sentiment

Table 3 Long description
The table reports coefficient estimates and standard errors from three linear multilevel regression specifications predicting opposition party negative sentiment: party-level, cabinet-level, and a within-between model. Intercepts are negative and statistically reliable in all three models. Government experience is consistently associated with lower negative sentiment in the party-level and within-between models, and the cabinet-level mean of government experience is also strongly negative. Surplus majority is linked to higher negative sentiment, reaching conventional significance in the within-between model and weaker evidence in the party-level model. Party seat share shows a positive association with negative sentiment in the party-level and within-between models. Most other predictors, including minority status types, effective number of parties, left-right distance measures, support party indicators, and coalition status, show small estimates without clear statistical evidence. Model fit is moderate to high where reported, with cabinet-level R-squared around seven tenths and marginal and conditional R-squared in the mid to high six tenths for the other models; country fixed effects are included throughout. Sample sizes differ by specification, with 474 observations for the party-level and within-between models and 112 for the cabinet-level model, so comparisons across columns should consider the different data structure and the within-between decomposition.
Notes: +p < 0.1, *p < 0.05, **p < 0.01, ***p < 0.001. AIC, Akaike Information Criterion; ICC, intraclass correlation coefficient; FE, fixed effects; RMSE, root mean squared error; S.E., standard error. In the ‘Within–between’ model, the party-level variables represent the difference from the cluster mean.
Parliamentary speech of opposition parties is not related to the type of government. Party system fragmentation is also unrelated to the speech sentiment of opposition parties. Contrary to our findings relating to voting behaviour, we do not find an association between the left–right distance to the cabinet and speech sentiment. This is true for all model specifications. Perhaps speech sentiment is more sensitive to the issue at hand, and therefore the overall left–right distance is less important. An alternative explanation is that speech sentiment is to a large extent stylistic and therefore the relationship with ideological distance is not as strong. We can also not exclude the possibility that our dictionary method is a relatively noisy indicator of opposition sentiment.
Similar to the analyses of parliamentary votes, opposition parties with government experience speak significantly less negatively in parliament than permanent opposition parties. We observe this relationship both at the party level and the cabinet level, and it also holds in the within–between specification. Thus, within each cabinet term, parties that have government experience use less negative (i.e. more positive) language than parties that do not have government experience. And between cabinet terms, this relationship also holds: when a larger (seat-weighted) share of the opposition parties had government experience, overall language use was less negative. We should note, however, that while the within-cabinet pattern is visible in all four countries, the between-cabinet pattern holds only in Denmark and the Netherlands (see the Supplementary Material). Still, in Canada and the UK, we do find evidence that within each parliamentary term, opposition parties with government experience use less negative speech than opposition parties without such experience.
Conclusion
We examined the widely held claim that the distinctiveness between government and opposition has weakened over time (Andeweg Reference Andeweg, Müller and Narud2013; Kirchheimer Reference Kirchheimer1957). Our findings suggest that trends in opposition distinctiveness vary across different political systems, supporting Robert Dahl’s early observation that ‘there is no single prevailing pattern of opposition in Western democracies’ (Dahl Reference Dahl and Dahl1966a: 332). In most of our four country cases, opposition distinctiveness in parliamentary votes increased between the 1950s and 1980s, with minor decreases afterwards. In the Netherlands, however, opposition distinctiveness has increased in recent decades, which our analysis relates to the number of permanent opposition parties.
The development in opposition parties’ voting behaviour in parliament can partially be explained by structural changes. In particular, we found support for a relationship between government experience of opposition parties and lower distinctiveness in opposition. We hypothesised that opposition parties with governing experience would increasingly support and cooperate with governments over time, leaving the ‘real’ opposition to permanent opposition parties. Our analysis reveals that opposition parties with government experience are generally more supportive than permanent opposition parties, in particular in the two countries with proportional representation (Tuttnauer Reference Tuttnauer2018; Van Well Reference van Well2025). This is clearest in the case of the Netherlands, where we found that opposition parties with government experience increasingly support government legislation, while permanent opposition parties in recent decades increasingly frequently oppose it. This pattern corresponds to Peter Mair’s observation that ‘there is a growing bifurcation in European party systems between parties which claim to represent but don’t govern and those which govern but no longer represent’ (Mair Reference Mair and Van Biezen2009: 17). In the Dutch parliament at least, the first group of responsive parties has increasingly acted distinctively over the last decades in contrast to the latter group of responsible parties that structurally support most pieces of government legislation (Louwerse and Otjes Reference Louwerse and Otjes2019).
Our regression models of opposition party support for government legislation and of opposition party sentiment confirmed this relationship for Denmark and the Netherlands. Opposition parties with government experience were less distinct from the government, both in terms of voting as well as speech-making. When we model the differences between cabinet terms, we found that when a larger (seat-weighted) share of opposition parties had government experience, opposition parties behaved less distinctively. Our within–between model confirms that both the party-level and the cabinet-level effects play a role. In the UK and Canada, these associations were far less robust, and were completely absent for opposition voting distinctiveness.
The distinction between opposition parties with and without government experience is most clearly visible in the Netherlanparties interact when they compete for government participation (Mair Reference Mair, Leduc, Niemi and Norris1996). In the Netherlands, there has always been partial alternation between governments, meaning some of the governing parties were also in the previous government. In the other three country cases, there has been mostly wholesale government alternation (or no alternation); in the UK between the Conservatives and Labour, in Canada between the Liberals and the Conservatives, and in Denmark between a left bloc and a right bloc of parties (Otjes Reference Otjes2020). As partial alternation leads to the formation of (left-leaning or right-leaning) centre or grand coalitions, permanent opposition parties may become frustrated with the rigidity of the political process and become ‘irresponsible’ (Sartori Reference Sartori1960). Future analyses of opposition distinctiveness in other countries should examine to what extent the Dutch experience can be generalised to other systems of partial alternation.
Interestingly, opposition distinctiveness in terms of voting behaviour is not always the same as opposition distinctiveness in terms of speech-making, especially in the UK and Canada. We observe a clear increase in opposition speech distinctiveness in these two countries. A possible explanation for these diverging patterns is the nature of these two different aspects of parliamentary behaviour. Both parliamentary debates and votes communicate parties’ positions to the wider public, but speeches in parliament have fewer constraints (Laver Reference Laver2021). Parliamentary rhetoric does not have immediate consequences for policy outputs and is less constrained by the legislative agenda. In that sense, parliamentary debates function in part as an instrument to improve the party brand with the next elections in mind. This is especially true for arena-like parliaments, such as the ones in the UK and Canada, which are mostly formal sites of the competition between political parties (Polsby Reference Polsby, Greenstein and Polsby1975). In contrast, parliamentary votes on government legislation may be more constrained by non-electoral considerations in the parliamentary arena, and used as an instrument to influence public policies (Hix and Noury Reference Hix and Noury2016). Voters may be less likely to notice a lack of opposition distinctiveness in terms of voting on government bills if the opposition is able to distinguish itself from the government rhetorically.
Our findings motivate various lines of future research on the important topic of opposition distinctiveness and, more broadly, government–opposition relations. First, while our diverse case selection provides a good overview of how opposition distinctiveness has developed in various established democracies, our finding concerning divergent patterns calls for further longitudinal case-specific analysis in a broader set of countries. Furthermore, country-specific analyses also enable the consideration of parliamentary instruments that may not travel easily across parliaments, such as co-sponsorship of bills, resolutions and amendments, legislative cooperation in committees, and the use of parliamentary interruptions (Loxbo and Sjölin Reference Loxbo and Sjölin2017). Second, whereas our explanatory framework was based mostly on a rational choice institutionalist framework, future work may explore the norms that structure government–opposition relations and changes in the expectations that have structured opposition behaviour over time (Louwerse and Otjes Reference Louwerse and Otjes2016). Third, the consequences of opposition distinctiveness on democratic satisfaction, electoral turnout and party choice are topics that warrant further attention (Tuttnauer and Wegmann Reference Tuttnauer and Wegmann2022).
Supplementary material
The supplementary material for this article can be found at https://doi.org/10.1017/gov.2026.10048.
Data availability
Replication data for the article are available at: https://doi.org/10.7910/DVN/KM2YHU.
Acknowledgements
Earlier versions of this article were presented at the 2023 Opposition Studies Conference in London, the 2022 EPSA Annual Conference in Prague, and the 2022 Annual Political Science Workshops of the Low Countries (Politicologenetmaal) in Nijmegen. We are grateful to Rebecca Kittel, Petr Kopecký, Tim Mickler, Anchrit Wille and other participants at these events, as well as to the anonymous reviewers for their valuable feedback and constructive discussions, which helped improve the manuscript. We also thank Flemming Juul Christiansen for sharing data on legislative agreements (forlig) in Denmark.
Financial support
This work is supported by a grant from the Dutch Research Council (NWO VI.Vidi.195.020).
Disclosure statement
The authors report that there are no competing interests to declare.




 Open access

