INTRODUCTION
Nitrous oxide (N2O) is of global importance both as a greenhouse gas and as an indirect cause of stratospheric ozone depletion (Crutzen Reference Crutzen and Delwiche1981). The global warming potential of N2O is 296 times higher than that of carbon dioxide (CO2) and it has a long atmospheric residence time (114 years) (IPCC Reference Solomon, Qin, Manning, Chen, Marquis, Averyt, Tignor and Miller2007). Agriculture currently accounts for 0·18 of total global greenhouse gas emissions with N2O comprising almost half of this total (US-EPA 2006). In Ireland, N2O emissions account for >0·08 of national emissions with 0·47 of emissions arising from pasture, paddock and range emissions associated with animal urine and faecal deposition (Duffy et al. Reference Duffy, Hanley, Hyde, O'Brien, Ponzi, Cotter and Black2013). This is due to grassland constituting 0·90 of the utilizable agricultural area in Ireland (Central Statistics Office 2007), most of which is grazed by ruminant animals.
In intensive grazing systems such as dairy farming, nitrogen (N) in excreta deposited by cattle is a major source of N2O loss, particularly from urine (Jarvis et al. Reference Jarvis, Scholefield, Pain and Bacon1995). Of the N ingested by the animal 0·60–0·90 is returned to the soil–plant system as urine and dung (Haynes & Williams Reference Haynes and Williams1993). The proportion and amount of N excreted in a urine patch is influenced by several factors but predominantly the feed N content (Barrow & Lambourne Reference Barrow and Lambourne1962; Mulligan et al. Reference Mulligan, Dillon, Callan, Rath and O'Mara2004). For example, while faecal N remains relatively constant, a positive relationship exists between feed N content and the proportion of N excreted in the urine (Barrow & Lambourne Reference Barrow and Lambourne1962). Reported urinary N contents from grazing cattle vary widely from 2 to 20 g N/l (average 8·6 g N/l) (Petersen et al. Reference Petersen, Sommer, Aaes and Soegaard1998) and when urination volume and patch surface area are taken into account, urine N loading rates on pasture are 400–1200 kg N/ha (Haynes & Williams Reference Haynes and Williams1993; Jarvis et al. Reference Jarvis, Scholefield, Pain and Bacon1995).
Most of the N in urine is in the form of urea (Petersen et al. Reference Petersen, Sommer, Aaes and Soegaard1998) which, when deposited onto soil, is rapidly hydrolysed to ammonium (NH4 +) and may be subsequently nitrified to nitrate (NO3 −) by microbes. Nitrate may then be denitrified to produce N2O and di-nitrogen (N2) gases. Depending on soil and climatic conditions N2O may be emitted from both the nitrification and denitrification processes (Bateman & Baggs Reference Bateman and Baggs2005). Urine patch N is particularly vulnerable to loss via denitrification in autumn and winter (Qiu et al. Reference Qiu, Di, Cameron and Hu2010) and when water-filled pore space (WFPS) is high and plant N demand is low (van Groenigen et al. Reference Van Groenigen, Velthof, Van Der Bolt, Vos and Kuikman2005b ). Although several studies have measured N2O loss from urine patches, the relationship between urine N content and N2O emissions in the field has been less well explored (Clough et al. Reference Clough, Sherlock, Mautner, Milligan, Wilson, Freeman and McEwan2003; van Groenigen et al. Reference Van Groenigen, Velthof, Van Der Bolt, Vos and Kuikman2005b ).
Recent efforts have been focussed on finding effective mitigation technologies to reduce N2O emissions from agriculture (Luo et al. Reference Luo, De Klein, Ledgard and Saggar2010). Dietary manipulation such as reducing the crude protein content or feeding with supplementary amino acids have indicated that the N concentration of ruminant urine may be reduced, although results are mixed (Mulligan et al. Reference Mulligan, Dillon, Callan, Rath and O'Mara2004; Misselbrook et al. Reference Misselbrook, Powell, Broderick and Grabber2005; Meade et al. Reference Meade, Pierce, O'Doherty, Mueller, Lanigan and McCabe2011). However, few studies have quantified subsequent N2O emissions from corresponding reductions made in N excretion (Meade et al. Reference Meade, Pierce, O'Doherty, Mueller, Lanigan and McCabe2011) with the use of dietary manipulation. Another mitigation strategy is the use of a nitrification inhibitor which slows down the rate of nitrification, the conversion of NH4 + to NO3 − (Di & Cameron Reference Di and Cameron2002). One such nitrification inhibitor, dicyandiamide (DCD) inhibits the conversion of NH4 + to nitrite (NO2 −) in the first step of nitrification (Amberger Reference Amberger1989). The efficacy of DCD in reducing urine-derived N2O emissions is well-documented on a range of soils (Williamson & Jarvis Reference Williamson and Jarvis1997; Di et al. Reference Di, Cameron and Sherlock2007; Singh et al. Reference Singh, Saggar and Bolan2009; de Klein et al. Reference De Klein, Cameron, Di, Rys, Monaghan and Sherlock2011). However, efficacy across a range of urine N contents has not been well quantified.
The objective of the present study was to explore the relationship between urinary N loading rate and N2O emissions from a temperate grassland soil, and to quantify the effectiveness of DCD at reducing these emissions.
MATERIALS and METHODS
Soil characteristics and lysimeter collection
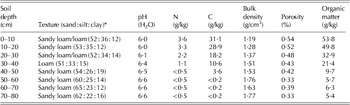
The soil type used was a Moorepark sandy loam located near Fermoy, county Cork, Ireland (8°15′W, 52°9′N). Some key properties of the soil are given in Table 1. The soil is classified as a haplic cambisol (IUSS Working Group WRB 2006), with a fine crumb structure in the top 30 cm overlying a weakly structured sandy loam. The mean values for the top 30 cm of soil were: pH 6·0, N content 3·0 g/kg, C content 26·1 g/kg, bulk density 1·28 g/cm3, porosity 51% and the organic matter content 45·5 g/kg (Table 1). The pasture was perennial ryegrass (Lolium perenne L.) which had been sown in June 2006.
Physical and chemical properties of soil monolith lysimeters

* USDA (2013) soil texture classification; determined using the hydrometer method.
Undisturbed monolith lysimeters (0·5 m diameter and 0·7 m depth) were collected from the Moorepark soil using established protocols and procedures in 2009 and 2010 (Cameron et al. Reference Cameron, Smith, McLay, Fraser, McPherson, Harrison and Harbottle1992). In brief, a hollow steel casing was placed on the soil surface and pushed down slowly in increments, together with digging of the soil, in order to minimize disturbance of the soil monolith. Once the casing had reached the desired depth (0·7 m), the soil monolith was cut off from the subsoil using a cutting plate and lifted out of the collection site. The gap between the soil monolith and the steel casing of each lysimeter was sealed using liquefied petroleum jelly in order to prevent edge-flow effects (Cameron et al. Reference Cameron, Smith, McLay, Fraser, McPherson, Harrison and Harbottle1992). Lysimeters were subsequently installed in a field facility at Teagasc (Irish Agriculture and Food Development Authority) Soil & Environmental Research Centre, Johnstown Castle Wexford, Ireland (6°30′W, 52°17′N, 54 m a.s.l.). Each year of measurement was conducted on a new set of lysimeters and can therefore be treated as a separate experiment.
Lysimeter treatments
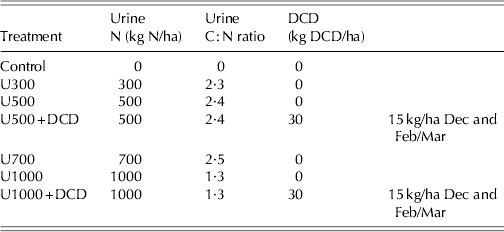
The same treatments were applied in year 1 (2009/10) and year 2 (2010/11) (Table 2) to new lysimeters constructed 2 months prior to urine application. Each treatment had four replicates. Treatments were allocated to lysimeters in a randomized block design with two blocks and two replicates of each treatment in each block. The urine N loading rates were chosen to simulate the range of urine N loads reported in the literature under dairy cow urine patches.
Description of urine nitrogen (N) and dicyandiamide (DCD) treatments applied in years 1 and 2
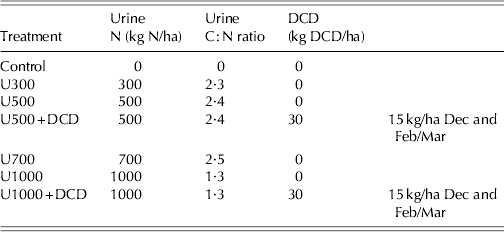
Fresh urine was collected from Holstein–Friesian mixed age cows during milking and was analysed immediately for total N using a TOC/N-VCPH analyser with an ASI-V auto sampler (Shimadzu Scientific Instruments, USA). Total N content was manipulated by dilution with water or addition of urea from an initial concentration of 8·6 g N/l to give four urine N concentrations: 3, 5, 7 and 10 g total N/l. Two litres of urine were applied in an even stream onto the surface of the lysimeter (0·2 m2) to simulate urine deposition in the field, corresponding to equivalent urine N loading rates of 300, 500, 700 and 1000 kg N/ha (Table 2). Urine was applied in early winter on 15 December 2009 (year 1) and on 28 December 2010 (year 2).
Dicyandiamide was sprayed uniformly onto the surface of the lysimeters in solution form at a rate of 15 kg/ha per application. It was applied twice, one immediately after urine and the other in late winter (mid-February, year 1) and early March (year 2), producing an annual application rate of 30 kg DCD/ha (Table 2). Pasture cover was short prior to DCD application to simulate conditions after cattle grazing and to ensure the DCD solution reached the soil surface. Pasture was cut periodically (approximately monthly) to simulate typical grazing practice. All harvested herbage was removed.
Nitrous oxide flux measurements
The static closed chamber method was used to measure N2O emissions, similar to that used by Hutchinson & Mosier (Reference Hutchinson and Mosier1981). During measurement, the outside edge of the chamber was inserted into a water channel which was fitted around the top edge of the lysimeter casing, in order to ensure a gas tight seal. At the beginning of each measurement period, the chamber was placed on top of each lysimeter and gas samples were taken through a rubber septum fitted into the top of the chamber, initially (t0), after 20 min (t20) and after 40 min (t40). Samples were transferred from the chamber to a pre-evacuated 7 ml glass vial using a plastic syringe and analysed within 7 days of collection. Sample nitrous oxide (N2O) concentration was analysed using a Varian 3800 gas chromatograph (Agilent Inc., Cheshire, UK) coupled to an electron capture detector (ECD) and Combi-Pal auto-sampler (CTC Analysis, Switzerland). Respective column, injector and detector temperatures were 60, 60 and 300 °C and the carrier gas was argon flowing at 35 ml/min. The area under each N2O peak was integrated using Varian Star Chromatography workstation version 5.51 (Varian, USA). Nitrous oxide measurement was carried out the day after urine application and 1–4 times weekly thereafter until the N2O flux of the urine and DCD treated areas was similar to background (control) levels. On each sampling day the measurement period took place between 12:00 h and 15:00 h, during which the air temperature represented the daily average.
Climate variables including mean daily 10 cm soil temperature (°C) and daily total precipitation were recorded at the Johnstown Castle meteorological station situated adjacent to the lysimeter facility.
Data analysis
Hourly N2O emissions were calculated based on the rate of increase in N2O concentration in the chamber (from t0 to t40 min) corrected for temperature and the ratio of surface area to chamber volume. Daily emissions were then calculated using the hourly flux, assuming that it represented the average hourly flux of the day (Blackmer et al. Reference Blackmer, Robbins and Bremner1982; de Klein et al. Reference De Klein, Barton, Sherlock, Li and Littlejohn2003). Cumulative emissions were calculated by integrating the calculated daily N2O fluxes and linear interpolation between measurement points. The N2O emission factor (EF3) was calculated for each urine N rate as:
 $$\eqalign {&{\rm Emission} \ {\rm factor} (\% )= \cr &\quad \displaystyle{\matrix{{\rm N}_2 {\rm O}\hskip-1pt - \hskip-1.5pt{\rm N}\,{\rm total}\,({\rm urine}) - {\rm N}{}_2{\rm O} - {\rm N}\,{\rm total}\, ({\rm control}) } \over {{\rm Urine}\,{\rm N}\, ({\rm applied})}} \times 100}$$
For each year, statistical analysis of the data was carried out on the log-transformed cumulative N2O emissions and the EF3 values using an analysis of variance (ANOVA) which fitted the difference between the two blocks as well as the treatment effects (Genstat Version 12.1, Lawes Agricultural Trust). The log-transformation ensured that the data were normally distributed and exhibited constant variance. The ANOVA included examination of two sets of orthogonal contrasts. The first set consisted of the linear and quadratic contrasts for the five urine N rates 0, 300, 500, 700 and 1000 kg N/ha (in the absence of DCD). The second set consisted of the 2×2 factorial contrasts for the factors urine N rate (500, 1000) and DCD (−, +). A least significant difference (LSD) was also calculated using the six urine and urine plus DCD treatments to test for significant difference between treatments on peaks of temporal N2O emissions.
RESULTS
Climatic conditions
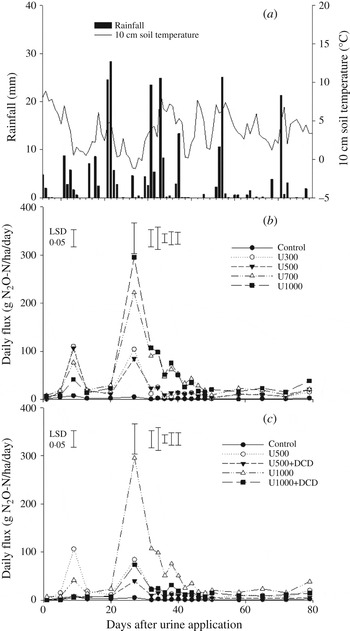
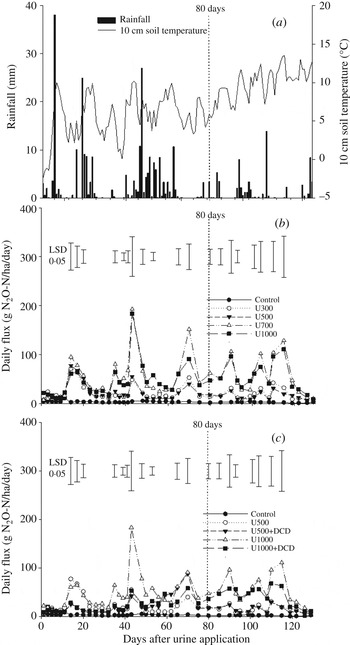
Cumulative precipitation during the experimental period in year 1 (Fig. 1(a)) was 272 mm with the majority of rainfall occurring in the first 40 days following urine application (15 December 2009–24 January 2010). In contrast, there was less rainfall in year 2 than average, with 241 mm cumulative rainfall over the same time period (Fig. 2(a)). Both seasons were colder than the 30-year average for the period (6·3 °C), particularly year 1 with a mean daily air temperature of 3·8 °C compared with 5·6 °C in year 2. Significant snowfall events occurred on 17 December 2009, 2 days after urine application in year 1 and on 20 December 2010, 8 days before urine application in year 2, both of which were highly unusual for the area. In addition, several hard frosts occurred during both years, with sub-zero soil temperatures recorded and significant soil surface freezing events occurring.
Year 1 (Day 0–Day 80). (a) Daily and cumulative rainfall inputs and mean daily 10 cm soil temperature; temporal nitrous oxide (N2O) flux following urine application to lysimeters with (b) varying urine nitrogen (N) rate and (c) the use of dicyandiamide (DCD) nitrification inhibitor. Urine treatments expressed as a loading rate of N in kg N/ha. Dicyandiamide applied twice in late autumn and early spring (30 kg DCD/ha annually).

Year 2 (Day 0–Day 130). (a) Daily and cumulative rainfall inputs and mean daily 10 cm soil temperature; temporal nitrous oxide (N2O) flux following urine application to lysimeters with (b) varying urine nitrogen (N) rate and (c) the use of dicyandiamide (DCD) nitrification inhibitor. Urine treatments expressed as a loading rate of N in kg N/ha. Dicyandiamide applied twice in late autumn and early spring (30 kg DCD/ha annually).

Temporal trends in nitrous oxide emissions
Increased N2O emissions relative to background fluxes were observed the day following urine application. However, daily emissions from the urine treatments did not differ significantly from the control until day 9 in year 1 and day 14 in year 2 (Figs 1 and 2, respectively).
There was significant inter-annual variation in both the pattern and duration of daily N2O emissions in both years. Two distinct emission peaks occurred in year 1, whereas emissions were spread across seven distinct peaks in year 2 (Fig. 1(b) and (c)). In year 1, the highest peak emissions were recorded in the U300 treatment 9 days after urine application (110 g N2O-N/ha/day), followed by a peak of 295 g N2O-N/ha/day in the U1000 treatment 27 days after urine application (Fig. 1(b)). Peak N2O emissions in year 2 were smaller and shorter in duration, with highest daily fluxes of 95, 80, 193, 151, 106, 102 and 128 g N2O-N/ha/day observed in the U700 treatment 14, 35, 43, 70, 90, 104 and 115 days after urine application, respectively (Fig. 2(b)). With the exception of the elevated flux in the U300 treatment 9 days after urine application in year 1, the highest daily N2O emissions were observed in the U700 and U1000 treatments in both years. Treatments U300 and U500 tended to produce larger daily N2O emissions than U700 and U1000 treatments in the first 20 days after urine application, after which the trend reversed. Daily N2O emissions returned to background levels 46 days after urine application in year 1 and 129 days after urine application in year 2.
The application of DCD reduced daily N2O emissions from urine application in both years. Peak N2O emissions in year 1 were reduced from 295 to 74 g N2O-N/ha/day in the U1000 and U1000+DCD treatments, respectively (P<0·05), and from 84 to 40 g N2O-N/ha/day in the U500 and U500+DCD treatments, respectively (P<0·05), 27 days after urine application (Fig. 1(c)). In year 2, emissions were reduced from 184 to 53 g N2O-N/ha/day (P<0·05) in the U1000 and U1000+DCD treatments, respectively, 43 days after urine application (Fig. 2(c)). Between 46 and 129 days after urine application, there was an apparent increase in daily N2O emissions in the DCD treatments relative to urine alone; however, the increase was not significant on any of the sampling days (Fig. 2(c)).
Cumulative nitrous oxide emissions
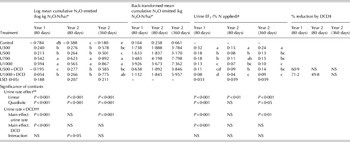
Cumulative N2O emissions were calculated for both the full measurement periods of 80 days after urine application in years 1 and 2 and 360 days in year 2. The cumulative N2O emissions between treatments over 80 days post-urine application in year 1 ranged from 0·2 to 3·9 kg N2O-N/ha for the control (0 N applied) and U1000 treatments (1000 kg N/ha urine applied), respectively, and from 0·3 to 4·2 kg N2O-N/ha in the control and U700 treatments, respectively, in year 2 (Table 3). In the 360-day period in year 2, cumulative N2O emissions almost doubled relative to the 80-day period, increasing to 0·7 and 7·8 kg N2O-N/ha for the control and U700 treatments, respectively. In both years, cumulative N2O emissions in the U700 and U1000 treatments were significantly higher compared with the U300 and U500 treatments (P<0·05).
Cumulative nitrous oxide (N2O) emissions and emission factors (EF3) in years 1 and 2 as affected by urine nitrogen (N) rate and dicyandiamide (DCD) nitrification inhibitor

* Log (base 10) used to calculate log-transformed means. Back-transformed means calculated using 10^(logmean)=back-transformed mean.
† Urine emission factor (EF3) %=[((N2O-N total, urine) – (N2O-N total, control))/(urine N applied)]×100.
‡ % reduction by DCD=[((N2O-N total-urine) – (N2O-N total-DCD))/(N2O-N total, urine)]×100. Value displayed where significant P<0·05.
§ Letters indicate a significant difference between two treatments (column) at P<0·05. Least significant difference (LSD) (5%) calculated from all treatments including control.
** Urine rate effect based on 5 urine treatments including control.
†† Urine rate× DCD based on a 2×2 factorial with factors urine rate (500 and 1000) and DCD (−,+).
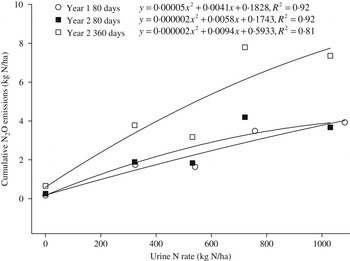
Increasing urine N rate increased the cumulative N2O emissions in both years, regardless of the length of measurement period used (Table 3). The relationships between urine N rate and cumulative N2O emissions in years 1 and 2 were curvilinear and diminishing (P<0·001, Table 3, Fig. 3).
The relationship between urine nitrogen (N) loading rate and cumulative nitrous oxide (N2O) emissions over 80 days in years 1 and 2 and over 360 days in year 2.

The application of DCD significantly reduced cumulative N2O emissions in year 1 from 3·9 to 1·1 kg N2O-N/ha where 1000 kg N/ha urine was applied. This corresponded to a reduction of 71% (P<0·05; Table 3). In the 500 kg N/ha urine treatment, DCD reduced cumulative N2O emissions from 1·6 to 0·6 kg N2O-N/ha which corresponded to a reduction of 61% (P<0·05). After the 80-day measurement period in year 2, a 50% reduction in cumulative N2O emissions, from 3·7 to 1·8 kg N2O-N/ha, was observed in the U1000+DCD treatment (P<0·05). However, there was no significant effect of DCD on N2O emissions in the U500. Over the longer measurement period of 360 days, there was no significant reduction in N2O emissions with DCD application observed at either urine N rate. The 2×2 factorial of urine rate× DCD shows that the main effect of DCD on cumulative N2O emissions was highly significant in year 1, but not in year 2 irrespective of the period of measurement. The main effect of urine N rate was highly significant from the 80-day measurement period in year 1 and from the 360-day measurement period in year 2, but not significant for the shorter measurement period. A significant interaction between urine N rate and DCD on cumulative N2O emissions was observed after 80 days of measurement in year 2.
Emission factors (EF3 values) for N2O in years 1 and 2 remained below 0·4% from urine N applied in all treatments (Table 3). Increasing the amount of urine N applied led to a highly significant (P<0·001) reduction in the EF3 values: emissions were reduced from 0·32 (at 300 kg N/ha) to 0·13% of N applied (at 1000 kg N/ha) after 80 days in year 1. In year 2, a similar significant reduction in EF3 values was observed, decreasing from 0·15 to 0·07% of N applied (after 80 days) (P<0·01) and from 0·24 to 0·10% (after 360 days) (P<0·001), in the U300 and U1000 treatments, respectively, in each period of measurement (Table 3). The largest EF3 value was 0·32% where 300 kg N/ha urine was applied in year 1. There was a trend to a reduction in EF3 value with the use of DCD, and significant reductions were observed where urine was applied at 500 and 1000 kg N/ha in year 1 (P<0·05). However, no similar significant reduction in EF3 value with the use of DCD was observed in year 2.
DISCUSSION
Effect of urine nitrogen rate on nitrous oxide emissions
Increased urine N loading rate resulted in a curvilinear, diminishing increase in the total amount of N2O-N emitted. Similar relationships have been reported from a range of N inputs, with linear increases in total N2O emissions ranging from 0·5 to 4·7 kg N2O-N/ha associated with N fertilizer rates of 0 to 880 kg N/ha in split applications (Velthof et al. Reference Velthof, Oenema, Postma and Van Beusichem1997). In contrast, exponential increases have been observed in laboratory studies of urine rates of 0 to 570 kg N/ha (Singh et al. Reference Singh, Saggar and Bolan2009). The stimulatory effect of urine on N2O emissions has been attributed to increases in N substrate, soluble C and WFPS which affects soil redox potential (Williams et al. Reference Williams, Ineson and Coward1999). If N substrate availability was the only limiting factor controlling N2O production, then it follows that increasing rates of N would produce an increase in total N2O emissions.
Despite an increase in the total N2O emissions, the EF3 values for N2O decreased significantly with increasing urine N rate. Conflicting evidence exists in the literature for the expected EF3 response to increasing N inputs. Clough et al. (Reference Clough, Sherlock, Mautner, Milligan, Wilson, Freeman and McEwan2003) reported an EF3 of 6·4% in the lowest (100 kg N/ha) urine rate, which decreased to 0·5% in the highest (1000 kg N/ha) urine rate, which agrees with the trend observed in the present study. However, other studies have found that the EF3 value increased with increasing urine N rate (Singh et al. Reference Singh, Saggar and Bolan2009) and increasing fertilizer N rate (Ryden Reference Ryden1983; Velthof et al. Reference Velthof, Oenema, Postma and Van Beusichem1997), while van Groenigen et al. (Reference Van Groenigen, Kuikman, De Groot and Velthof2005a , Reference Van Groenigen, Velthof, Van Der Bolt, Vos and Kuikman b ) found no significant effect of urine N on EF3 in laboratory or field studies.
One possible explanation for the decrease in the EF3 value with increasing urine N rate is that an increasing proportion of the urine N applied was removed from the potentially available N pool for N2O production in an alternate pathway of N transformation. Possible removal pathways include N leaching, plant N uptake, immobilization, ammonia (NH3) volatilization, emissions of other NOx gases or pathways resulting in di-nitrogen (N2) evolution, or a combination of the above. The removal of this N may have reduced the pool of N available for N2O production. It is more likely, however, that a factor other than N availability was limiting N2O production. Potential limiting factors include: an available carbon source (Firestone & Davidson Reference Firestone, Davidson and Andreae1989), gas diffusion and exchange (van der Weerden et al. Reference Van Der Weerden, Kelliher and De Klein2012), or microbial abundance and activity (Lovell & Jarvis Reference Lovell and Jarvis1996).
In order to explain the trends in total N2O emissions and EF3 values, the sources and rates of N transformation and N2O production would need to be defined, which was beyond the scope of the present study. The pattern and duration of temporal N2O emissions varied between years which was probably brought about by interactions between climatic and soil conditions. Freeze-thaw processes have been shown to produce large pulses of N2O emissions due to aggregate slaking and enhanced N mineralization (Muller et al. Reference Muller, Kammann, Ottow and Jager2003). This could explain the difference in the temporal pattern of N2O emissions between years observed in the present study. Nitrous oxide is produced by both nitrification and denitrification (Skiba et al. Reference Skiba, Smith and Fowler1993). The relative contributions of nitrification and denitrification to N2O emissions in fertilized soils are defined more by changes in WFPS (Bateman & Baggs Reference Bateman and Baggs2005), than by N and C availability (Firestone & Davidson Reference Firestone, Davidson and Andreae1989). The optimum range in WFPS for N2O production was found to be 60–70% (Linn & Doran Reference Linn and Doran1984), above which denitrification was the major contributor to N2O production, whereas below, nitrification was the major contributor (Bateman & Baggs Reference Bateman and Baggs2005). In another study of the sources of N2O production from the urine patch, 43% of N2O was derived from nitrification with the remainder from denitrification on a free-draining soil (Di & Cameron Reference Di and Cameron2008). Indeed the contribution of nitrifier denitrification is being increasingly recognized as a major contributor to N2O production from fertilized soils (Kool et al. Reference Kool, Dolfing, Wrage and Van Groenigen2011). It is likely that both nitrification and denitrification contributed to the total N2O production in the present study, and that both processes produced the difference in the temporal flux profiles between years.
Production of N2O may be derived from both applied N and native soil N (Lampe et al. Reference Lampe, Dittert, Sattelmacher, Wachendorf, Loges and Taube2006). An apparent priming effect of urine was detected by Di & Cameron (Reference Di and Cameron2008) where the contribution of soil-derived N to total N2O was 50% from 15N-labelled urine and 5% from 15N-labelled urea. The priming effect has been suggested (Wachendorf et al. Reference Wachendorf, Taube and Wachendorf2005; Di & Cameron Reference Di and Cameron2008), but rarely quantified for urine-affected soil. 15N balances have shown that immobilization can account for 10–23% of the N in soil beneath a urine patch (Whitehead & Bristow Reference Whitehead and Bristow1990; Frase et al. Reference Frase, Cameron and Sherlock1994; Clough et al. Reference Clough, Ledgard, Sprosen and Kear1998) which is most likely to be due to the assimilation of N by microbes (Ledgard et al. Reference Ledgard, Jarvis and Hatch1998). However, little research exists that quantified the net effect of mineralization and immobilization rates in soils under grazed pasture (Ledgard et al. Reference Ledgard, Jarvis and Hatch1998), possibly due to the confounding influence of other soil N transformations. Furthermore, there are methodological limitations in the measurement of both mineralization and immobilization (Davidson et al. Reference Davidson, Hart, Shanks and Firestone1991), mostly because the two processes occur simultaneously in soil, which is termed mineralization-immobilization turnover (MIT). It is likely that this continual cycling of N in the urine patch resulted in a significant contribution of native soil N to total N2O production in the present study. Further research is required into the contribution of MIT to N2O production and indeed urine patch N dynamics.
An apparent grouping of treatments was observed in years 1 and 2, with similar cumulative emissions for the 300 and 500 kg N/ha urine rates and the 700 and 1000 kg N/ha urine rates (Table 3). Clough et al. (Reference Clough, Sherlock, Mautner, Milligan, Wilson, Freeman and McEwan2003) reported repression of N2O production where urine was applied at 1000, but not 100, 250 or 500 kg N/ha; they related this to the NH3 inhibition of nitrification resulting in nitrite (NO2 −) accumulation and suggested a link between nitrification and N2O production. Elevated pH conditions (pH>7) following urea hydrolysis in the urine patch can produce NH3 inhibition of nitrification, observed elsewhere, e.g. Smith et al. (Reference Smith, Doyle, Burns and Stevens1997). Alternatively, acidic conditions (pH<5) following nitrification may generate emissions of NO and NO2 (Chalk & Smith Reference Chalk, Smith, Freney and Simpson1983), N2O and N2 (Spott et al. Reference Spott, Russow and Stange2011). Clearly, more research is required to understand the effect of N substrate additions on the relative sizes of inorganic N pools and N-gas emissions.
Effect of sampling duration of nitrous oxide measurement
Sampling for N2O following N application in the literature is recommended until the daily N2O flux has returned to background levels (de Klein et al. Reference De Klein, Barton, Sherlock, Li and Littlejohn2003), which is, in many studies, less than 180 days after N application (Clough et al. Reference Clough, Ledgard, Sprosen and Kear1998; Di et al. Reference Di, Cameron and Sherlock2007). For the present study, in year 1 this period was 80 days, whereas in year 2 the daily flux returned to background levels 129 days after urine application. Cumulative N2O emissions from the 80 day measurement period in years 1 and 2 were similar. The range in cumulative N2O emissions changed little from 0·4–7·3 kg N2O-N/ha after 129 days (data not presented) to 0·7–7·8 kg N2O-N/ha after 360 days. This finding supports the recommendation to cease sampling when the daily flux of N2O returns to background levels.
Effect of dicyandiamide application on nitrous oxide emissions
The application of DCD following urine application reduced cumulative N2O emissions in year 1 by 61 and 71% at urine application rates of 500 and 1000 kg N/ha, respectively. These reductions are comparable with those reported in a range of studies (Di & Cameron Reference Di and Cameron2002; Di et al. Reference Di, Cameron and Sherlock2007; Hoogendoorn et al. Reference Hoogendoorn, De Klein, Rutherford, Letica and Devantier2008; Zaman & Blennerhassett Reference Zaman and Blennerhassett2010; de Klein et al. Reference De Klein, Cameron, Di, Rys, Monaghan and Sherlock2011), one of which produced an average reduction in cumulative N2O of 70% for a range of soil types (Di et al. Reference Di, Cameron and Sherlock2007). The reduction in cumulative N2O emissions in the 500 kg N/ha treatment was less than that in the 1000 kg N/ha treatment in year 1, indicating that the efficacy of DCD increased with increasing urine N rate. This was supported by Singh et al. (Reference Singh, Saggar and Bolan2009) in a lab study, in which N2O emissions were measured from urine N rates of 14·4, 29·0 and 57·0 g N/m2 applied to soil cores with and without DCD, and reported increasing reductions of 33, 56 and 80%, respectively, with DCD. The results suggest that the inhibition of nitrifying bacteria, predominantly ammonia-oxidizing bacteria (AOB) (Di et al. Reference Di, Cameron, Shen, Winefield, O'Callaghan, Bowatte and He2009), by DCD remained the same despite increasing inputs of N, and the current results from year 1 support this.
However, inter-annual variation in the efficacy of DCD at reducing N2O emissions was observed between years 1 and 2. A significant urine rate× DCD interaction was produced after 80 days in year 2, due to the combination of a significant reduction in cumulative N2O emissions at the 1000 level and no change at the 500 level (Table 3). From 0 to 46 days after urine was applied, temporal N2O emissions were close to background in the DCD treatments. However after day 46, N2O emissions in the DCD treatments increased steadily and cumulative emissions eventually matched those in the urine treatments (Fig. 2, Table 3). Where the longer measurement period of 360 days in year 2 was taken into account cumulative N2O emissions in the DCD treatments doubled, and no significant reduction in emissions was observed at either urine N rate. A reduction in the efficacy of DCD was probably a result of a decrease in soil DCD concentration resulting from organic matter fixation, assimilation by microbes, decomposition or leaching out of the zone of denitrification. Decomposition of DCD has been related to temperature (Di & Cameron Reference Di and Cameron2004; Kelliher et al. Reference Kelliher, Clough, Clark, Rys and Sedcole2008), with a temperature of below 10 °C corresponding with consistent DCD efficacy at reducing N2O production. Sorption of DCD onto organic matter surfaces has been reported whereby functional groups on the DCD molecule (–NH2 and=NH) form hydrogen bonds with carboxyl groups (–COOH) (Zhang et al. Reference Zhang, Wu and Zhou2004). In addition, Shepherd et al. (Reference Shepherd, Wyatt and Welten2012) showed that 16–46% of the DCD applied was leached from clay, silt loam and sandy loam soils mainly via convective–dispersive flow, and therefore drainage volume was the main driver for DCD leaching. Monaghan et al. (Reference Monaghan, Smith and Ledgard2009) observed leaching of DCD following a significant rainfall event, most likely the result of preferential flow. Given that temperature in the present study remained below 10 °C until 90 days after urine application in year 2 (Figs 1 and 2), temperature degradation of DCD would have been slow. Significant rainfall and drainage during winter on a free-draining soil type, and vertical movement of DCD down the soil profile were probably the main causes of the reduction in DCD efficacy in the present study.
As suggested above, it is likely that high drainage rates during winter leached a proportion of the DCD from the soil. Nitrification in the DCD treatments was then able to proceed and accumulated NH4 + was emitted as N2O via nitrification or denitrification, producing similar cumulative N2O emissions to those produced in the urine-only treatments. If the accumulated NH4 + is not utilized by plants, it remains vulnerable to loss via N2O production or leaching. Nitrous oxide production in the DCD treatments returned to background levels 129 days after urine application in year 2. This finding suggests that if the amount and efficacy of DCD in the soil could be maintained until the end of the main N2O-producing period (i.e. winter), for example by increasing the frequency and/or rate of DCD application, then the DCD effect could be enhanced. Moreover, the saved N in this scenario would then be available for plant uptake under suitable conditions (i.e. spring). The present study highlights the need for research on the movement of DCD through soil, and the transformations and fate of the N saved with use of DCD.
Emission factor values
Irrespective of the N2O emissions measurement period and the urine N rate applied, the EF3 values for N2O from the urine and DCD treatments remained below 0·4% in both years. This was at the lower end of the 0·1–3·8% range in N2O EFs found by Oenema et al. (Reference Oenema, Velthof, Yamulki and Jarvis1997) for urine patches in grazed pasture, but expected from a free-draining soil type (de Klein et al. Reference De Klein, Barton, Sherlock, Li and Littlejohn2003; van der Weerden et al. Reference Van Der Weerden, Luo, De Klein, Hoogendoorn, Littlejohn and Rys2011). The low EF3 values observed in the present study are likely to be related to the soil type and the unusually cold and dry period post-urine application. Van der Weerden et al. (Reference Van Der Weerden, Luo, De Klein, Hoogendoorn, Littlejohn and Rys2011) suggest that the difference in urine EF3 between seasons are likely to be a result of the strong relationship between N2O emissions and the mean soil WFPS 10 days post-urine application.
Importantly, all of the EF3 values were well below the 2% default value for N deposited during grazing by the IPCC for Ireland (IPCC Reference Solomon, Qin, Manning, Chen, Marquis, Averyt, Tignor and Miller2007). This supports the finding by de Klein et al. (Reference De Klein, Barton, Sherlock, Li and Littlejohn2003), which concluded that a single EF3 value for New Zealand was not appropriate, and that soil type and drainage characteristics produced a range of EF3 values. A range of 0·3–2·5% EF3 for urine was specified, where the highest EF3 value was from a poorly drained soil and the lowest was from a well-drained stony soil (de Klein et al. Reference De Klein, Barton, Sherlock, Li and Littlejohn2003). A country-specific EF3 value (direct emissions from N excreted by grazing animals) of 1% has been adopted for New Zealand's greenhouse gas inventory reporting (Clough et al. Reference Clough, Di, Cameron, Sherlock, Metherell, Clark and Rys2007). Dicyandiamide is an effective mitigation tool both in terms of total N2O emissions and EF3, providing it remains in the topsoil throughout the period of greatest potential N2O loss. Therefore, further research is required to: (1) define EF3 values specific to Ireland's soil types, drainage characteristics and N inputs, and (2) further validate and define the effect of DCD on N2O emissions for a range of soil types in Ireland. Using this information, it is likely that country-specific EF3 for N2O will be produced for Ireland.
CONCLUSIONS
Increasing the urine N rate resulted in a curvilinear, diminishing increase in cumulative N2O emissions, apparently irrespective of the spatial and temporal variability in N2O production, or the source pathway in which N2O was produced. The EF3 values calculated for the free-draining soil type studied were considerably lower than the IPCC default value of 2% used in Ireland for all soils from urine patches deposited during grazing under pasture, paddock and range. The EF3 value for N2O decreased significantly with the increase in urine N rate, which was probably the result of a factor other than N, such as carbon availability, limiting N2O production. The application of DCD reduced cumulative N2O emissions in some cases which was comparable with previous work. The efficacy of DCD varied with urine N rate, and appeared to be more effective at the higher N rates. Total N2O emissions following DCD application were not consistent from year to year. The efficacy of DCD was most likely reduced by its removal from the soil via leaching or decomposition. In order to reduce cumulative N2O emissions from urine patches, DCD must remain in the soil at an effective concentration for the duration of the autumn and winter period.
Financial support for this study was provided through the Research Stimulus Fund Programme of the Irish Department of Agriculture, Fisheries and Food (RSF 07 536). The first author gratefully acknowledges funding received from the Teagasc Walsh Fellowship Scheme. The authors thank Cathal Somers, Alan Cuddihy and John Murphy for their technical assistance.