Introduction
The western Antarctic Peninsula (WAP) region is one of the most sensitive and dynamic areas of the Earth's surface, where ecological and cryospheric systems respond rapidly to climatic changes (Domack et al. Reference Domack, Leventer, Dunbar, Taylor, Brachfeld and Sjunneskog2001). Since the middle of the 20th century a mean atmospheric warming of nearly 3°C is observed along the WAP (e.g. Meredith & King Reference Meredith and King2005), which is significantly higher than the average global warming trend of 0.6 ± 0.2°C over the last 100 years (Houghton et al. Reference Houghton, Ding, Griggs, Noguer, van den Linden, Dai, Maskell and Johnson2001). The most recent reconstructions confirm this, showing a warming trend of 0.17°C per decade for West Antarctica between 1957 and 2006 (Steig et al. Reference Steig, Schneider, Rutherford, Mann, Comiso and Shindell2009). One of the consequences of the local warming trend is a significant increase in melting of land and sea ice. Since the late 1960s, a reduction of sea ice as well as a dramatic retreat of glaciers is reported that has accelerated in the last decade (Rignot et al. Reference Rignot, Bamber, van Den Broeke, Davis, Li, van De Berg and van Meijgaard2008). These changes are regionally accompanied by the creation of new ice-free areas (Braun & Gossmann Reference Braun and Gossmann2002, Cook et al. Reference Cook, Fox, Vaughan and Ferrigno2005) favouring soil formation on previously ice-covered bedrock. Whereas on continental Antarctica chemical weathering is still negligible (Lee et al. Reference Lee, Lim and Yoon2004), it is suggested that particularly under warmer and more humid conditions along the WAP, pedogenesis and weathering processes may have been more significant.
Furthermore, along with enhanced meltwater discharge, an increase in rock erosion has been observed. At Potter Cove, King George Island (KGI), for example, sub-, peri-, and proglacial meltwater streams transport suspended material of c. 0.14 kg m-3 (0.0042–0.532 kg s-1) into coastal waters during the melting period (Schloss et al. Reference Schloss, Ferreyra and Ruiz-Pino2002), which may have direct effects on marine ecosystems. In light of the sensitive character of this region, geochemical studies of sedimentary archives may provide critical information on the response of ecological and cryospheric systems to alternating environmental conditions along the WAP. High-resolution palaeoenvironmental records may be used to indicate to what extent this rapid regional warming is recorded by coastal sediments and whether similar events may have occurred in the recent past. Vertical distributions of major and minor elements in marine sediments serve as palaeoclimatic proxies and may reveal changes in bioproductivity, the origin and weathering of source rocks, glacier advance and retreat, sediment transportation processes, redox conditions, and diagenesis. To date, however, comprehensive geochemical investigations in this area are nonexistent or restricted to bulk parameters, like total organic carbon (TOC), nitrogen, carbonate and opal (e.g. Yoon et al. Reference Yoon, Park, Kim and Kim2000, Yoon et al. Reference Yoon, Yoo, Bak, Lim, Kim and Lee2010), granulometric data (Hass et al. Reference Hass, Kuhn, Monien, Brumsack and Forwick2010), and rare earth elements (REE) patterns of surface sediments (Santos et al. Reference Santos, Favaro, Schaefer and Silva-Filho2007). In this study a first comprehensive geochemical characterization of Holocene sediments from Maxwell Bay, KGI is presented. Inorganic geochemical data is used for provenance analyses to reconstruct possible local glacier extents during the last two millennia. Furthermore, in the context of the rapid warming trend of the past 50 years, shifts in the quantity and nature of the vertical sediment flux as well as the degree of chemical weathering in the supply area are examined. The results of this investigation may allow a better understanding of the impact of global climate change on regional terrestrial and marine ecosystems along the WAP in the past and future.
Regional setting
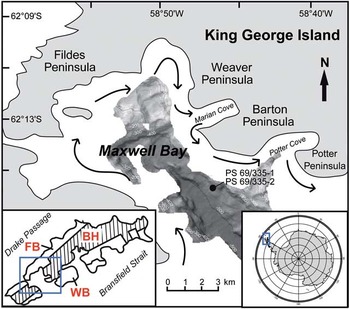
King George Island (62°23′S, 58°27′W) is the largest of the South Shetland Islands (SSI), a Jurassic–Quaternary magmatic island arc forming a 550 km long archipelago separated from the WAP by the Bransfield Strait. The interior of the island is mostly occupied by a 600 m thick ice cap covering the basement, which is mainly composed of igneous rocks of pyroclastic, volcanic or plutonic origin (Yeo et al. Reference Yeo, Lee, Hur and Choi2004). According to Fig. 1, KGI can be divided into three main tectonic blocks with different lithostratigraphies: the Barton Horst (Barton and Weaver peninsulas), the Fildes Block (Fildes Peninsula) at the north-west end, and the Warszawa Block (Potter Peninsula) in the south-east (Santos et al. Reference Santos, Favaro, Schaefer and Silva-Filho2007 and references therein). Geological investigations on Fildes Peninsula showed that the Fildes Block is dominated by basalts to basaltic andesites, trachybasalts, porphyritic basalts, and dacites and andesites interbedded volcanic breccias (Machado et al. Reference Machado, Lima, Chemale, Morata, Oteiza, Almeida, Figueiredo, Alexandre and Urrutia2005). Whereas Weaver Peninsula is characterized by basalts to basaltic andesites showing a relative mafic composition (Yeo et al. Reference Yeo, Lee, Hur and Choi2004), the bedrock of Barton Peninsula located close to the study site consist of more intermediate basaltic-andesitic rocks and the volcanoclastic Sejong Formation of late Palaeocene–Eocene age. In the central northern parts plutonic rocks (granodiorites) of Middle Eocene age dominate (Yeo et al. Reference Yeo, Lee, Hur and Choi2004 and references therein).
Map of the study site. The black dot marks the sediment core location. Black arrows indicate general ocean currents in Maxwell Bay and adjacent coves according to Chang et al. (Reference Chang, Jun, Park and Eo1990) and Roese & Drabble (Reference Roese and Drabble1998). Bathymetric data is from Hass et al. (Reference Hass, Kuhn, Monien, Brumsack and Forwick2010). FB = Fildes Block, BH = Barton Horst, WB = Warszawa Block.

Maxwell Bay, a U-shaped embayment with a length of 14 km and a width of 6–14 km, is located at the south-western end of KGI, enclosed by Nelson Island and the Fildes Peninsula (Yoon et al. Reference Yoon, Park, Kim and Kim2000). It is separated from the Bransfield Strait by a deep submarine sill (> 430 m) and characterized by a flat central part with water depths ranging from 400–550 m and a shallower part at the northern end displaying greater topographic irregularities (Griffith & Anderson Reference Griffith and Anderson1989, Yoon et al. Reference Yoon, Park, Kim and Kim2000). More than half of the coastline of the bay is governed by headlands and rocky beaches. Tidewater glaciers are only found in more protected tributary inlets, like Potter and Marian coves (Griffith & Anderson Reference Griffith and Anderson1989). From July–September the bay is completely covered by sea ice, which begins to break up in late October (Griffith & Anderson Reference Griffith and Anderson1989, Khim & Yoon Reference Khim and Yoon2003). During summer (November–February) the bay is ice-free and two different water masses may be distinguished. Relatively cold and saline open ocean water (subsurface water) enters the bay from the Bransfield Strait (< 0°C, 34.0–34.5 psu) generally showing wind driven cyclonic circulation patterns (Roese & Drabble Reference Roese and Drabble1998). It is overlain by a surface layer of warmer and less saline water (0–1.04°C, 33.9–34.0 psu) that is mixed with freshwater discharging from melting glaciers and surface runoff (Khim & Yoon Reference Khim and Yoon2003 and references therein). Sediment laden plumes are reported adjacent to most of the tidewater glaciers in the protected inlets during this period (Griffith & Anderson Reference Griffith and Anderson1989).
Today KGI is characterized by a maritime cold climate that is more humid and warmer than in other Antarctic areas, particularly compared to the Antarctic continent. It is characterized by a high relative humidity (89%), an annual precipitation rate of 437.6 mm water equivalent and a mean annual air temperature of -1.8°C (Lee et al. Reference Lee, Lim and Yoon2004). With summer temperatures frequently above 0°C it is one of the very few Antarctic regions with substantial summer melting.
Material and methods
Sampling
During RV Polarstern cruise ANT-XXIII/4 in April 2006, a gravity core (SL, PS 69/335-2) and a giant box core (GKG, PS 69/335-1) were recovered at a water depth of 450 m in Maxwell Bay off KGI (Gohl Reference Gohl2007) (Table I, Fig. 1). The gravity core was cut in 1 m sections onboard where wet bulk density was determined with a multi-sensor core logger (GEOTEK Ltd, UK) via gamma ray attenuation. Stored at 4°C the cores were transported to Bremerhaven, opened, and split for further analyses. Samples for the determination of geochemical and sedimentological parameters were taken from the working halves of the gravity core sections and a 60 cm long subcore obtained from the GKG. Sampling was performed at fixed intervals of 5 cm (SL) and 10 cm (GKG) using 10 cm3 syringes. After being freeze-dried and weighed, the samples were ground and homogenized in agate ball mills.
Coring sites on cruise ANT-XXIII/4.

Note: GKG = giant box corer, SL = gravity corer.
Depth correction
In order to correct for the loss of surface sediment and compressional effects during the coring process of gravity core PS 69/335-2, an undisturbed surface sediment subcore taken from GKG PS 69/335-1 was used for substitution. Based on high-resolution colour reflectance data (b*) and using the AnalySeries 2.0.4.2 software (Paillard et al. Reference Paillard, Labeyrie and Yiou1996) both cores were combined to one synthetic core ‘PS 69/335’. For further details see Hass et al. (Reference Hass, Kuhn, Monien, Brumsack and Forwick2010). In the following original core depths of PS 69/335-2 are converted to metres composite depth (mcd) with an offset of + 0.24 m.
Core description
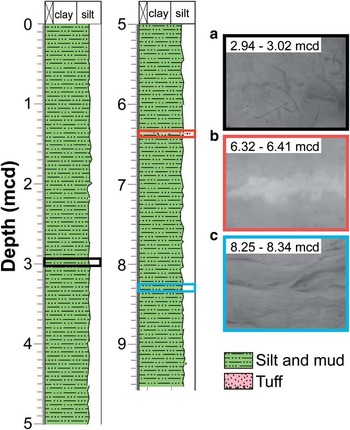
Figure 2 shows the lithology and selected radiographs (see http://doi.pangaea.de/10.1594/PANGAEA.509895) of core PS 69/335 that were taken at the Alfred Wegener Institute, Bremerhaven using a Faxitron X-ray Inspection System (Hewlett Packard, USA). The core PS 69/335 has a composite length of 9.51 m and it is dominated by homogenous brown-green-greyish silty clay with comparably few scattered ice rafted debris (average value for the fraction > 63 μm is 1.1%, only four samples exceeding 5%) (Hass et al. Reference Hass, Kuhn, Monien, Brumsack and Forwick2010). In the upper 8 mcd bioturbation is moderate to high, which is supported by radiographs revealing worm tubes (Fig. 2). The lower part displays weak lamination and evidence for flaser bedding. At 6.36–6.37 mcd a dark brown to black stratum was recognized which included coarser grained sediment with higher amounts of silt (67%), fine sand (20%) and volcanic glass shards and represents most probably a tephra layer.
Lithology of core PS 69/335. Radiographs of selected sections showing a. worm tube evidence for high bioturbation rates in the upper part of the core, b. the coarser grained tephra layer at 6.36 mcd, and c. evidence for flaser bedding at the bottom.

Laboratory analyses
The content of total sulphur (TS) was determined using a carbon and sulphur analyser (ELTRA CS 500, Germany) equipped with a solid-state infrared detector. Total organic carbon was determined with a CS-analyser (LECO, Germany) after calcareous material had been removed from sample splits by adding concentrated HCl (≥ 37%). Quantitative X-ray fluorescence (XRF) analysis was carried out with a conventional wavelength dispersive XRF (WD-XRF) spectrometer (Philips PW 2400). Glass beads were prepared from the samples with di-lithium tetraborate according to Schnetger et al. (Reference Schnetger, Brumsack, Schale, Hinrichs and Dittert2000) and measured in random order to avoid artificial trends. Further element analyses (REE, Cs, Nb, Th, U) of selected samples were performed by Inductively Coupled Plasma Mass Spectrometry (ICP-MS) at 5000-fold dilution using an Element 2 mass spectrometer (Thermo Fisher GmbH, Germany). Sample preparation was conducted following Schnetger (Reference Schnetger1997) with slight modifications using 1 ml HClO4 (70%, sub-boiled) and 3 ml HF (40%, Suprapur®) for acid digestions. Based on the water content of each sample, element contents were corrected for seawater salt assuming seawater composition and a salinity of 34‰, which is consistent with the subsurface salinity found at Maxwell Bay (Roese & Drabble Reference Roese and Drabble1998). This method was checked using 13 selected samples, which were washed with 18.2 MΩ water and ultrasonicated three times to dissolve the sea salts. Chloride and sulphate concentrations of the filtrate were then quantified by ion chromatography using a DIONEX ion chromatograph. Both methods agreed within 11% based on a linear correlation between water content and measured chloride concentration with r 2 = 0.974. Smear slides of selected sediment layers were prepared for petrographic investigations. Sediment samples were taken from the undisturbed archive half. After fixation with Canada balsam at 130°C the samples were analysed at Bremen University, Germany using a LEICA DMRX polarization microscope (Leica Camera AG, Germany). Photomicrographs were taken with a LEICA DFC 320 digital camera system and processed with IM50 software (Leica Camera AG, Germany).
The Accelerator Mass Spectrometry 14C chronology of core PS 69/335-2 is based on the age model after Hass et al. (Reference Hass, Kuhn, Monien, Brumsack and Forwick2010). For the sediments from Maxwell Bay a reservoir effect of 1100 years was assumed (Hass et al. Reference Hass, Kuhn, Monien, Brumsack and Forwick2010), which is consistent with literature where reservoir effects between c. 1000 and 1400 years (Björck et al. Reference Björck, Hjort, Ingolfsson and Skog1991b) were found for this area. In addition, 210Pb analyses were carried out for eight samples obtained from both cores. Activities of radionuclides were measured by gamma spectrometry (Ge-detector, GWC 2522-7500 SL, Canberra Industries Inc., USA) and processed with GENIE 2000 3.0 (Canberra Industries Inc., USA). Counting statistics were better than 5% for the samples except those with very low 210Pb activity (< 0.08 Bq g-1). The accuracy of this method was tested by using a standard reference material similar in matrix composition to the WAP samples (UREM-11). It averaged 10% for all radioisotope concentrations, which were corrected for the samples by factors calculated using the certified reference values. To take account of changing sedimentation rates with time, the age of each sediment slice was determined according to the constant rate of supply model after Appleby & Oldfield (Reference Appleby and Oldfield1978). Compaction effects were taken into account by correcting the radiolead excess activities with the dry bulk density. The total 210Pb inventory was determined by integration of the corrected 210Pb activity data versus the depth profile, whereas 210Pb excess values of lacking sediment samples were interpolated at 1 cm steps. Mass accumulation rates of the bulk sediment (MARBS) were calculated from the product of the linear sedimentation rate and the dry bulk density.
Analytical data are available at http://doi.pangaea.de/10.1594/PANGAEA.737926, 737995, 733677, 738106, and 738123.
Calculation of SiO2 excess
SiO2 excess (SiO2xs), which represents the biogenic, non-lithogenic fraction of total SiO2 and thus the content of biogenic silica (BSi), was calculated after Böning et al. (Reference Böning, Cuypers, Grunwald, Schnetger and Brumsack2005):

In keeping with an average bedrock calculation, a lithogenic SiO2/Al2O3 ratio of 3.07 was assumed. SiO2xs was chosen as a proxy for biosiliceous production for different reasons: particularly for wet alkaline extraction, the precision and accuracy of the BSi determination vary depending on the extraction time, the solid to solution ratio, and the pH (Liu et al. Reference Liu, Ye, Zhang and Zhao2002 and references therein). In addition, the variable amounts of reactive Si-containing components, including quartz, clay minerals, aluminosilicates and volcanic glasses, leached by this procedure may bias the results (Koning et al. Reference Koning, Epping and van Raaphorst2002).
Chemical Index of Alteration
In order to estimate the degree of chemical weathering of the source material the Chemical Index of Alteration (CIA) after Nesbitt & Young (Reference Nesbitt and Young1982) was calculated. Usually, the CIA ranges between ≤ 50 for fresh rocks and 100 for highly residual clays. An increase in this index therefore reflects a decreasing primary mineral content and increasing amount of secondary phases. Thus, high values indicate intensive chemical weathering due to high precipitation and air temperatures, whereas low values may evidence a colder and/or more arid climate where physical weathering prevails.
Statistics
In order to guarantee the precision and accuracy of the methods at least eightfold measurements of several carefully selected in-house (PS-S, UT-S, TW-TUC, Loess, DR-BS) and international reference standards (BIR-1, JA-2, JB-1, PACS-1, JG-1a, IAPSO Standard Seawater 35%) were conducted. To determine the degree of statistical spread and therefore the precision of a method, the relative standard deviation was used (Skoog & Leary Reference Skoog and Leary1996). In the case of TS and XRF analyses multiple determinations of reference material were performed to calculate the pooled estimated relative standard deviation after Skoog & Leary (Reference Skoog and Leary1996). To get an idea of the accuracy of a method, the relative systematic error (f) representing the variation from the certified value was determined (Skoog & Leary Reference Skoog and Leary1996). Statistical evaluation is summarized in Table S1 (supplementary data will be found on www.journals.cambridge.org/jid_ANS). Precision was better than 1% for major elements (Si, Ti, Al, Fe, Mn, Mg, Ca, K, P) and < 5% for minor elements (Cs, Rb, Sr, Th, U, Y, Zr, REE; Nb and Ba 5–6%) and bulk parameters (TS, TOC). In general, accuracy ranged from -0.98 to 1.6% (major elements) and -6.5 to 5.8% (minor elements and bulk parameter), except for U, SO42- and Cl- (|f| < 10%).
Results
Chronology
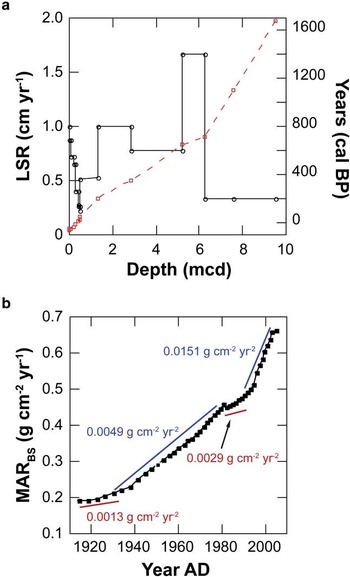
According to the age model described above, the core spans the late Holocene period (c. 1700 calendar (cal) yr bp to present) (Fig. 3a, Hass et al. Reference Hass, Kuhn, Monien, Brumsack and Forwick2010). Linear sedimentation rates calculated from this model range between 0.34 and 1.67 cm yr-1 (average = 0.55 cm yr-1) and were verified by data obtained by 210Pb excess activity of the surface sediments (0.2–1.0 cm yr-1, Fig. 3a). These data moreover reveal that during the last 100 years sediment mass accumulation rates have gradually increased from 0.2 g cm-2 yr-1 at the beginning of the 1910s to 0.66 g cm-2 yr-1 between ad 2005 and ad 2006 (Fig. 3b). The highest increases are observed between c. ad 1940 and ad 1980 (0.0049 g cm-2 yr-2) as well as during the last decade (0.0151 g cm-2 yr-2).
a. Age (red squares) and linear sedimentation rate (LSR) vs depth of core PS 69/335 according to radiocarbon and 210Pb measurements. b. Mass accumulation rates of bulk sediment (MARBS) vs year ad in Maxwell Bay calculated using the 210Pb dating model and including interpolated sediment depths.

Lithogenic background
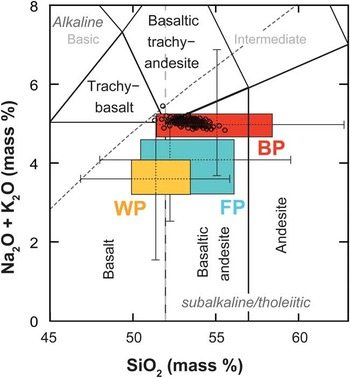
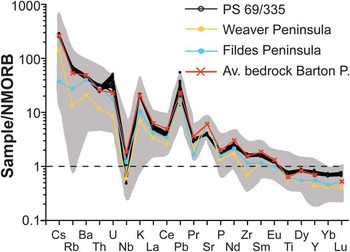
In Fig. 4 the (Na2O + K2O) vs SiO2 contents of core PS 69/335 samples are shown and compared to the composition of the local bedrock. To establish a better comparability of source and sink material the sediment composition was corrected for sea salt and for BSi to avoid artefacts (e.g. Na2O, K2O) and dilution effects. Because individual samples from the source rocks of the island are highly variable in composition, median and quartiles (25% and 75%) were calculated, which are more robust to outliers. Figure 4 shows that the sediments of core PS 69/335 plot in the field of tholeiitic basaltic andesites and in the red box representing the variability of Barton Peninsula bedrock. Generally, the NMORB-normalized distribution patterns of the sediments follow the trends of the source rocks found in the study area (Fig. 5, grey area). However, the highest correlation is given for an average Barton Peninsula bedrock (Fig. 5, red line), which is calculated based on the geochemical data compiled by Lee et al. (Reference Lee, Lim and Yoon2004). The calculation was done with respect to the spatial distribution of the different types of bedrock found on Barton Peninsula (51% basaltic andesite 2 (BA-2), 20% basaltic andesite 1 (BA-1), 10% granodiorite, 14% Sejong Formation, 5% lapilli tuff) using the geological map published in Lee et al. (Reference Lee, Lim and Yoon2004). All samples are relatively enriched in large ion lithophile elements, such as Cs, Rb, Ba, U, K, Pb, Sr, and light rare earth elements (La, Ce, Pr and Nd) and show a negative Nb trough in the spider diagram. In addition, it is evident that uranium shows even higher than expected values for KGI volcanic rocks.
(Na2O + K2O) vs SiO2 content of the BSi adjusted sedimentary deposits from Maxwell Bay (black circles) compared with the composition of bedrock from the Fildes (FP), Barton (BP) and Weaver Peninsula (WP). Source rock data were compiled using the data from Machado et al. (Reference Machado, Lima, Chemale, Morata, Oteiza, Almeida, Figueiredo, Alexandre and Urrutia2005), Yeo et al. (Reference Yeo, Lee, Hur and Choi2004), and Lee et al. (Reference Lee, Lim and Yoon2004) and are given as median, quartiles (box) and 95% confidence interval (whiskers). Fields for volcanic rock classification are from LeBas et al. (Reference LeBas, LeMaitre, Streckeisen and Zanettin1986).

Trace element abundances of core PS 69/335 and bedrock from Barton, Weaver and Fildes Peninsula normalized to N-MORB (Sun & McDonough Reference Sun and McDonough1989). Shaded area represents the total variability of western KGI bedrock types. Mean source rock data are from Lee et al. (Reference Lee, Lim and Yoon2004), Yeo et al. (Reference Yeo, Lee, Hur and Choi2004), and Machado et al. (Reference Machado, Lima, Chemale, Morata, Oteiza, Almeida, Figueiredo, Alexandre and Urrutia2005).

Vertical distributions of elements
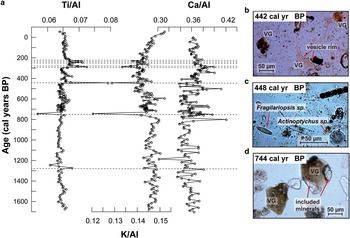
In general the geochemistry of Maxwell Bay sediments reveals minor variations with depth. However, significant deviations with regard to selected element/aluminium (El/Al) ratios are evident in discrete sediment layers (Fig. 6a). Slightly higher Ti/Al and Ca/Al, and lower K/Al values are typical for some intervals in the upper part of the core (226, 231, 246, 276, 281, 286, 378, and 442 calendar yr bp) and at 1274 cal yr bp, whereas the assumed tephra layer at 6.36 mcd (744 cal yr bp) is characterized by increased Ca/Al and decreased K/Al and Ti/Al ratios. Photomicrographs of selected samples moreover indicate that significant amounts of brownish and pristine volcanic glass shards are present in the pronounced layers (442 cal yr bp (30–50%) and 744 cal yr bp (c. 50%), Fig. 6b & d) but could not be found in the remaining samples where biological material (diatoms) prevails (e.g. 448 cal yr bp, Fig. 6c).
a. Vertical distribution of Ti/Al, K/Al, and Ca/Al of core PS 69/335 vs depth (mcd) and age (cal yr bp) as determined by quantitative WD-XRF accompanied by photomicrographs of selected sediments at b. 442, c. 448, and d. 744 cal yr bp. VG = volcanic glass.

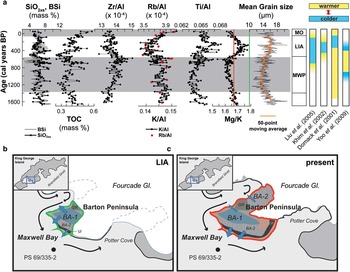
After these layers were removed from the dataset, some distinct distribution patterns are apparent in several element ratios (Fig. 7a). The Mg/K ratio in the lithogenic background ranges between 1.54 and 1.78. The highest values are found between c. 550 and 50 cal yr bp and before 1400 cal yr bp. It generally follows the distribution of the mean grain size (12–21 μm), which is largest in the intervals mentioned above (Hass et al. Reference Hass, Kuhn, Monien, Brumsack and Forwick2010). Similar characteristics are also observed in the tephra corrected Ti/Al record (0.063–0.068, average = 0.065). In contrast, rather opposing trends are recognized in the Rb/Al (r = -0.58) and Zr/Al (r = -0.39) profiles where slightly lower values (13 x 10-4 (Zr/Al) and 3.5 x 10⁻⁴ (Rb/Al)) are correlated with a higher mean grain size (16–21 μm). This is also true for K/Al, which shows a positive correlation to Rb/Al (r = 0.83). In particular for the Mg/K record, lower ratios between c. 550 and 1400 cal yr bp and a significant decrease during the last 50 years are apparent.
a. Comparison between selected bioproductivity proxies (SiO2xs, BSi, TOC), Zr/Al, K/Al, Rb/Al, Ti/Al, and Mg/K ratios vs age (cal yr bp) in Maxwell Bay sediments and recorded climatic events of several studies along the WAP. BSi values (grey solid line) are calculated from opal data taken from Hass et al. (Reference Hass, Kuhn, Monien, Brumsack and Forwick2010). The green and red vertical lines represent the average Mg/K ratio of outcrops on Barton Peninsula, b. during the LIA, and c. at present. BA-1 = basaltic andesite 1, BA-2 = basaltic andesite 2, SF = Sejong Formation, GR = granodiorite, MO = Modern optimum, LIA = Little Ice Age, MWP = Medieval Warm Period. Mean grain size data are from Hass et al. (Reference Hass, Kuhn, Monien, Brumsack and Forwick2010). Tephra layers were excluded from this plot for a better illustration of the trends.

Bioproductivity proxies
A higher downcore variability was observed for bioproductivity proxies, like TOC and SiO2xs (Fig. 7a). Figure 7a reveals that SiO2xs (4.1–9.4%, average = 6.4%) correlates quite well with BSi (2.6–9.6%, average = 6.2%), which was re-calculated from opal data taken from Hass et al. (Reference Hass, Kuhn, Monien, Brumsack and Forwick2010). However, compared to SiO2xs (1σ = 1.1) the BSi record (1σ = 1.4) shows a greater variability. It cannot be excluded that this is solely a result of the lower precision of the leaching method. Consequently, in this study SiO2xs has been used as it is probably more reliable than BSi as a proxy for siliceous bioproduction.
For the period from 1700 cal yr bp to present, continuous cyclic fluctuations in TOC (0.26–0.58%) and SiO2xs were determined. Maxima in TOC for example at c. 700, c. 825, c. 1120, and 1665 cal yr bp are paralleled by the SiO2xs record. Their uniform trends terminate at c. 350 cal yr bp where a gradual increase in TOC up to 0.58% occurs that is not reflected in SiO2xs and BSi.
Geochemistry of sulphur and redox sensitive elements
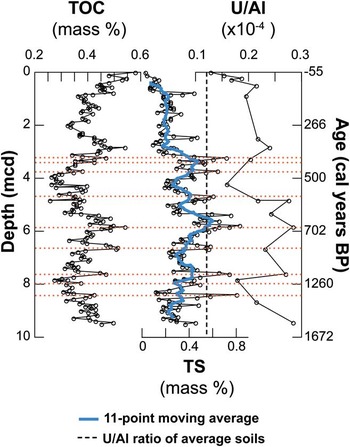
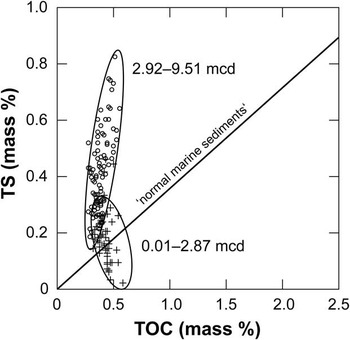
Figure 8 shows the vertical distribution of some redox sensitive parameters (TOC, TS, U/Al) in core PS 69/335. A significant increase with depth is visible in the vertical distribution of U/Al. At the top of the core U/Al values are within the range of average soils represented by the dashed vertical line (0.12 x 10⁻⁴, estimated after Lee et al. (Reference Lee, Lim and Yoon2004)), but follow the TOC profile in deeper sediments. Highest values are found between 5 and 8 mcd (610–1110 cal yr bp) and at 9.46 mcd (1650 cal yr bp, 0.28 x 10⁻⁴), making U the element with the highest enrichment factor (2.4) compared to local bedrock and soils. The element showing the highest downcore variability is sulphur. Whereas TS is quite low in the upper c. 3 mcd (present to 384 cal yr bp, average = 0.19%), sulphur contents of > 0.8% are present between 3 and 8 mcd (375–1200 cal yr bp) before varying on midlevel in the lowest 1.5 m (c. 1200–1670 cal yr bp, average = 0.29%). Particularly in the bottom part, maxima of TS coincide with TOC maxima (e.g. 3.21, 5.76, 6.56 & 7.61 mcd). A TS vs TOC cross plot moreover reveals that TOC/TS ratios in surface sediments (< c. 3 mcd, -56 to 384 cal yr bp) are predominantly in the range of ‘normal marine sediment’, but reach lower values in the basal part (Fig. 9). It should be noted that the TS concentrations only represent a minimum estimation since a possible sulphate reduction in deeper parts of the core would result in an overcorrection of the salt-corrected sedimentary sulphur. Assuming a complete depletion of sulphate in the pore water, TS contents in the basal part would on average be 20% higher, which would also lead to even lower TOC/TS ratios (-16%).
Vertical distribution of TS, TOC, and U/Al vs depth (mcd) and age (cal yr bp) of core PS 69/335. Dashed vertical line represents U/Al ratios of average soils on Barton Peninsula estimated after Lee et al. (Reference Lee, Lim and Yoon2004).

Cross plot of TOC and TS of Maxwell Bay sediments. Samples are represented by crosses (0.01 and 2.87 mcd) and open circles (2.92 and 9.51 mcd). The solid line represents the TOC/TS ratio of ‘normal marine sediments’ (c. 2.8) after Berner & Raiswell (Reference Berner and Raiswell1983).

Chemical weathering
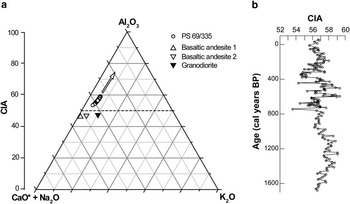
In Fig. 10a the CaO*+Na2O-K2O-Al2O3 diagram of the samples from Maxwell Bay and the average composition of the dominant bedrock types of the Barton Peninsula after Lee et al. (Reference Lee, Lim and Yoon2004) is shown. The CIA ranges between 53.6 and 59.5 (average = 56.9) and follows the weathering trend of basaltic andesite 2. Within the vertical distribution no clear trend is visible. Maximum values occur at 499, 589, and 1259 cal yr bp, while minima are detected during times most probably influenced by volcanic material (442 & 744 cal yr bp, Fig. 10b).
a. CaO*+Na2O-K2O-Al2O3 diagram of the samples from Maxwell Bay and the average composition of the dominant bedrock of the Barton Peninsula. The arrow indicates the weathering trend of basaltic andesite 2 rocks. b. Vertical distribution of the CIA vs age (cal yr bp) of core PS 69/335.

Discussion
Lithogenic background and tephrochronology
The results of this study suggest that the geochemical composition of the Maxwell Bay sediments is mostly determined by the lithogenic background of Barton Peninsula and adjacent areas. It is characterized by tholeiitic basaltic andesite rocks (Fig. 4) showing a Nb trough in their NMORB normalized element distribution (Fig. 5), which is typical for rocks evolved from subduction zone magmas (Machado et al. Reference Machado, Lima, Chemale, Morata, Oteiza, Almeida, Figueiredo, Alexandre and Urrutia2005). In addition, several tephra layers were identified by their geochemical characteristics using quantitative XRF, and were verified by photomicrography. Most of the minerals, found in at least two ash bearing deposits (442 & 744 cal yr bp), are characterized by sharp edged contours and inclusions of rapidly quenched volcanic glasses (Fig. 6). Thus, this material has not experienced significant mechanical reworking during transport. Although a dilution by local bedrock complicates the correlation between sink and source of these ashes to a certain extent, an aeolian transport from Deception Island seems to be the most probable origin for these tephras (Baker et al. Reference Baker, McReath, Harvey, Roobol and Davies1975, Matthies et al. Reference Matthies, Mäusbacher and Storzer1990). Two of the tephra layers found in core PS 69/335 (3.56 mcd, c. 442 cal yr bp; 6.36 mcd, 744 cal yr bp) may even be related to the tephra horizons AP2 (c. 450 14C cal yr bp) and AP3 (c. 750 14C cal yr bp), which were observed by Björck et al. (Reference Björck, Sandgren and Zale1991a) in four lakes along the Antarctic Peninsula region.
Alteration of potential proxies by early diagenesis
Diagenesis is one of the main factors complicating the reconstruction of the palaeoclimate via bioproductivity proxies like TOC and BSi/opal. Howe et al. (Reference Howe, Wilson, Shimmield, Diaz and Carpenter2007) showed that in surface sediments from the deep Bransfield Strait and Weddell Sea, organic matter degradation can lead to diagenetic alteration of the primary climatic signals. Effects of sub- to anoxic diagenesis should therefore be considered when investigating the sediments closer to the coast, since meltwater and nutrient discharge might induce an even higher primary productivity in these proximal settings, resulting in higher organic matter export to the sediments and even more intense early diagenesis. The downcore profile of a redox sensitive proxy like the U/Al ratio (Fig. 8) may give a first indication of the depositional conditions in this area (Klinkhammer & Palmer Reference Klinkhammer and Palmer1991). Changes in U/Al may be caused by a shift in source rock composition towards more uranium bearing granodiorites (U/Al = 0.32 x 10⁻⁴ (granodiorites), 0.07–0.13 x 10⁻⁴ (basaltic andesites), after Lee et al. (Reference Lee, Lim and Yoon2004)). However, this appears to be very unlikely considering the fact that these granodiorites are only found at a small area in the central north of Barton Peninsula. Consequently, the hypothesis of U enrichment under reducing conditions within the sediment has to be taken into account. Mobilized as U6+ in an oxic environment, uranium may be precipitated and fixed in sediments as U4+ under more reducing conditions, as a result of microbially induced processes below the sediment-water interface (Klinkhammer & Palmer Reference Klinkhammer and Palmer1991). Apart from the upper layers where U/Al is close to lithogenic background, the ratio follows the distribution of TOC, which is explained by the affinity of reduced U4+ towards organic particles under reducing conditions (Anderson et al. Reference Anderson, Lehuray, Fleisher and Murray1989). This supports the assumption that uranium comes from oxic seawater and precipitates at depth along a redox gradient, which is controlled by the oxygen penetration depth (Klinkhammer & Palmer Reference Klinkhammer and Palmer1991). Similar observations were also made by Santos et al. (Reference Santos, Favaro, Schaefer and Silva-Filho2007) in the nearby Admiralty Bay. In oxygen depleted environments early diagenetic formation of pyrite must also be considered as this is strongly linked to microbial sulphate reduction. Whereas sedimentological investigations confirm the occurrence of sulphidic spots within the sediments of core PS 69/335, the occurrence of slightly higher amounts of sulphur in deeper layers is an indication of the formation of iron sulphides. Further clues to the pathway of early diagenetic oxidation of TOC are given by the TOC vs TS cross plot shown in Fig. 9. The fact that the upper section of core PS 69/335 is generally characterized by TOC/TS values ≥ c. 2.8 suggests that oxidants such as oxygen, nitrate, or manganese oxides are primarily responsible for TOC metabolization. In contrast, significantly lower TOC/TS values found in the bottom section of the core PS 69/335 reveal the fingerprint of sulphate reduction, which is supported by sulphate measurements of the filtered washing solution of the sediments. We are aware that this method cannot compensate for the lack of pore water data, because during core storage calcium-sulphate phases may have precipitated which were not redissolved by our leaching procedure. However, assuming that precipitation is negligible or comparable in all samples, the results indicate that SO42-/Cl- ratios in these filtrates gradually decrease downcore from surface sediments and reach 50% of the seawater value in a depth of c. 3.50–3.75 mcd (c. 435–467 cal yr bp, data not shown). This certainly is a minimum estimate, since sulphide (pyrite) oxidation would lead to increases in SO42-/Cl- ratio as well. Whereas Khim & Yoon (Reference Khim and Yoon2003) assumed that additional sulphur within Maxwell Bay sediments was probably related to the detrital supply of pyrite from pyrite bearing rocks of hydrothermal origin, the close relationship between TOC and TS in this setting as it is shown in Fig. 8 rather suggests authigenic pyrite formation, which is mainly controlled by the quantity of metabolizable organic matter. During future investigations, pore water analyses may give further useful information about early diagenetic processes in WAP sediments. In any case, these first results emphasize that the alteration of potential proxies, such as TOC, may complicate the palaeoclimate reconstruction in this area.
Controlling factors of bioproductivity in the coastal WAP region: reduced sea ice coverage and reduced sunlight penetration
In several studies along the WAP, TOC and particularly BSi/opal have successfully been used as proxies for palaeoproductivity. In this context the sensitive character of this area, which has experienced alternating periods of more extensive sea ice coverage and relatively ice-free open water conditions since the LGM, has already been demonstrated by several sedimentary, geochemical and diatom records (e.g. Khim et al. Reference Khim, Yoon, Kang and Bahk2002, Yoon et al. Reference Yoon, Yoo, Bak, Lim, Kim and Lee2010). The palaeoproductivity proxy records of core PS 69/335 (TOC, SiO2xs) support the evidence for changing ice conditions through time by reflecting synchronous fluctuations that may provide the first evidence for short-term changes in marine primary production and climatic conditions during the past c. 1750 yr. According to Taylor et al. (Reference Taylor, Whitehead and Domack2001), high TOC and BSi contents in marine sediments of the WAP region are primarily associated with increased bioproductivity during warmer periods and minimal sea ice. Several factors influencing primary production have to be taken into consideration in nearshore areas where meltwater streams from retreating glaciers directly affect the chemistry and physics of the water column. In addition to water column stabilization by the drainage of freshwater, an increased import of nutrients, iron in particular, is predicted (e.g. Schloss et al. Reference Schloss, Ferreyra and Ruiz-Pino2002, Raiswell et al. Reference Raiswell, Tranter, Benning, Siegert, De'ath, Huybrechts and Payne2006). Both factors generally support plankton bloom development. However, particularly in enclosed fjords and coastal areas, a negative effect of increased meltwater discharge on bioproductivity because of higher turbidity and low light penetration is also possible (Schloss et al. Reference Schloss, Ferreyra and Ruiz-Pino2002). Hass et al. (Reference Hass, Kuhn, Monien, Brumsack and Forwick2010), for example, showed that lower TOC values in Maxwell Bay sediments are correlated to some extent with finer grained deposits, which characterize warmer periods and reflect reduced bioproductivity due to higher amounts of suspended particulate sediment material in the water column. However, whereas they could clearly identify the Medieval Warm Period (MWP, 1400–550 cal yr bp) and the Little Ice Age (LIA, 550–50 cal yr bp) as a main neoglacial event using granulometric data, these long-term climatic periods could not acceptably be reconstructed with the bioproductivity proxy records alone (Fig. 7a). Our data imply that the effect of light attenuation on primary production in Maxwell Bay caused by increased input of particulate matter during warmer periods and longer sea ice coverage during colder periods may have a similar influence.
Proxies for changes in provenance and glacier extents on Barton Peninsula
More reliable information about long-term changes in local climate may be provided by inorganic geochemical data of core PS 69/335 sediments that have been corrected for sea salt, tephra layers and biogenic material, like biogenic opal and TOC. Figure 7a reveals that particularly the downcore profile of Mg/K generally follows the grain size distribution. After Hass et al. (Reference Hass, Kuhn, Monien, Brumsack and Forwick2010) the granulometric data evidence colder conditions between 550 and 50 cal yr bp and a warmer phase between c. 1400 and 550 cal yr bp. The existence of a colder period within the late Holocene, for example, that is equivalent in timing with the LIA of the northern hemisphere has moreover been demonstrated by several studies at different locations along the WAP, although timing and duration varies regionally (Fig. 7a). Magnetic susceptibility records from Palmer Deep sediments suggest a LIA equivalent between c. 700 and 100 cal yr bp (Domack et al. Reference Domack, Leventer, Dunbar, Taylor, Brachfeld and Sjunneskog2001), which is widely consistent with glacial geological results from South Georgia and the sub-Antarctic islands (Clapperton & Sugden Reference Clapperton and Sugden1988). Changes in the penguin population on Ardley Island indicate a cold period from c. 450 to 200 cal yr bp (Liu et al. Reference Liu, Sun, Xie, Yin and Wang2005), whereas Khim et al. (Reference Khim, Yoon, Kang and Bahk2002) found evidence for a cooling starting at c. 400 cal yr bp in a sediment core from the eastern Bransfield basin, following a warmer phase between c. 900 and 400 cal yr bp.
The fact that Mg/K seems to reflect these climatic events could have several reasons. This parameter may, for example, be used as a measure of basaltic melts modified by fractional crystallization. As it has already been shown earlier the geochemical signature of core PS 69/335 strongly suggests that Barton Peninsula is the most probable origin of these sediments (Figs 4 & 5). This is additionally evidenced by median Mg/K ratios found in core PS 69/335 (1.7) and in rock samples from the different peninsulas (Barton Peninsula = 1.5, Weaver Peninsula = 10.7, Fildes Peninsula = 3.9; see Table S2). However, slight changes in several element/aluminium ratios between 550 and 50 cal yr bp (e.g. Ti/Al, Zr/Al, Rb/Al) supports the assumption that small-scale alternations in supply areas reflecting different stages of glacier extents on Barton Peninsula may be responsible for this (Fig. 7a). Geochemical data of particulate matter discharged from different meltwater streams are not available, which complicates provenance analyses. However, based on the bedrock data provided by Yeo et al. (Reference Yeo, Lee, Hur and Choi2004) retreated glaciers during warmer periods (e.g. MWP, 1400–550 cal yr bp) would lead to a higher influence of Mg-poor and K-rich primary source rocks (BA-2, average Mg/K = 1.8) and the volcanoclastic Sejong Formation (SF, average Mg/K = 1.1) (Fig. 7c). This in turn would cause a lower average Mg/K ratio of the outcrops of 1.67 (Fig. 7a, red line; Table S2). In contrast to that, as is shown in Fig. 7b, re-advanced glaciers between c. 550–50 cal yr bp would have resulted in a shift towards less fractionated basaltic andesites (BA-1, Mg/K = 6.6) and a higher average Mg/K ratio of the uncovered bedrock of 1.79 (Fig. 7a, green line; Table S2). This is also in line with the values found in PS 69/335 (see Fig. 7a, MWP average = 1.71, LIA average = 1.63). Furthermore, we would expect a trend towards lower Rb/Al and Zr/Al ratios during colder periods when the influence of basaltic andesite 1 rocks is higher (see Table S3), which is exactly what we see in our sediments (Fig. 7a). Whereas Seong et al. (Reference Seong, Owen, Lim, Yoon, Kim, Lee and Caffee2009) were not able to reconstruct a glacier advance at Barton Peninsula in this period, our result is consistent with the study from Hall (Reference Hall2007) who described a re-advance of the Collins Glacier (Fildes Peninsula) at c. 650 cal yr bp using radiocarbon dates of incorporated moss.
However, changes in sediment geochemistry can also indicate sorting effects, particularly in high-energy environments. In this case one would expect winnowing processes to favour the simultaneous accumulation of coarser grained material and heavy minerals, such as rutile and zircon (Rittenhouse Reference Rittenhouse1943). This does not seem to be true for Maxwell Bay sediments where Zr/Al rather shows an opposing trend (r = -0.39). Moreover, chemical weathering processes may play an important role. Thus, Mg/K ratios possibly reflect climatic processes in that Mg is residing in chemically more unstable minerals such as pyroxenes, and K is present in stable minerals such as potassium feldspars. During warmer periods increased chemical weathering would as a result lead to lower Mg/K ratios in coastal sediments. Considering the fact that K/Al shows a significant decrease during these periods (Fig. 7a) and that this temporal trend is not visible in the CIA record (Fig. 10b), such an explanation appears to be rather unlikely. In general, the geochemical data does not show any evidence for significant chemical weathering in this area, which is consistent with results from a couple of other studies along the WAP region (Lee et al. Reference Lee, Lim and Yoon2004, Santos et al. Reference Santos, Favaro, Schaefer and Silva-Filho2007) and favours changing provenance and glacier extents as an explanation for shifts in Mg/K.
Geochemical proxies for the recent rapid warming along the WAP
Yoo et al. (Reference Yoo, Yoon, Kim and Khim2009) argued that granulometric and sedimentological data from the continental shelf of the northern SSI document a return to warmer conditions since c. 50 cal yr bp. Within the same period decreasing Mg/K ratios in Maxwell Bay sediments were observed indicating a higher influence of BA-2 source rocks, possibly triggered by the rapid recent glacier retreat at the Barton Peninsula (Fig. 7c).
An additional indicator for rapid recent warming is derived from bulk sediment mass accumulation rates obtained from 210Pb determinations of surface sediments. A gradual retreat of glaciers north of 64°S has been observed since the 1940s (Cook et al. Reference Cook, Fox, Vaughan and Ferrigno2005), which is reflected by an enhanced input of sediment laden meltwater and a significant increase in MARBS in Maxwell Bay (Fig. 3b). Evidence for a faster retreat of the Fourcade Glacier (KGI) between 1956 and 1988 was found by Braun & Gossmann (Reference Braun and Gossmann2002). They also stated that in the following decade no significant glacier retreat and even slight advances were observed for the major glaciers at nearby Admiralty Bay, which would explain the relative constant MARBS calculated for the same period. Although no cooling was detected during this time period, anomalous slowing of glacier retreat was found in several areas along the WAP (Cook et al. Reference Cook, Fox, Vaughan and Ferrigno2005). However, recent studies came to the conclusion that the retreat of glaciers has accelerated during the last decade (e.g. Cook et al. Reference Cook, Fox, Vaughan and Ferrigno2005, Rignot et al. Reference Rignot, Bamber, van Den Broeke, Davis, Li, van De Berg and van Meijgaard2008) leading to higher particle fluxes in the water column and increasing MARBS. If air temperatures will continuously rise, as predicted in the latest IPCC report (Solomon et al. Reference Solomon, Qin, Manning, Chen, Marquis, Averyt, Tignor and Miller2007), the input of particulate matter via meltwater streams may increase even further. It is liable that this in turn will also have consequences for nearshore marine ecosystems. Moline et al. (Reference Moline, Claustre, Frazer, Schofield and Vernet2004), for example, could show that these meltwater induced changes in light regime, nutrient availability and salinity have already affected the planktonic community in recent decades.
Conclusions
In this study the first comprehensive geochemical characterization of sediments from the WAP is presented. Radiocarbon and 210Pb data reveal that a composite core from Maxwell Bay (KGI) comprises a sedimentary record of the last c. 1750 years with high sedimentation rates ranging from 0.2–1.7 cm yr-1. Ten tephra layers, most probably derived from Deception Island, were detected by quantitative XRF measurements and verified by microscopic methods. The layers at 442 and 744 cal yr bp may directly be linked to previous eruptions and/or reported tephra layers in nearby lacustrine records. The sediment composition is mainly controlled by the lithogenic background of the study area, consisting of tholeiitic basaltic andesites most probably derived from the nearby Barton Peninsula. The primary composition of the sediments is moreover affected by early diagenetic processes (e.g. U, TS) and by fluctuations in bioproductivity (TOC, BSi/SiO2xs) in the overlying water column. Palaeoclimatic interpretation of the sediment proxies let us infer that the study site has experienced short-term alternations in regional climate during the last c. 1750 years, which may be a result of the climatically sensitive character of this area. Despite the low downcore variability of most elements, there is evidence that the supply area has changed during periods of retreat and re-advance of glaciers on Barton Peninsula. Changes in selected element ratios allow identification of two main climatic events during the late Holocene that are equivalent in timing to the LIA (c. 550–50 cal yr bp) and the MWP (c. 1400–550 cal yr bp) of the northern hemisphere. Although the study site nowadays is characterized by a warmer climate, no significant increase in proxies indicating chemical weathering could be found.
Since the end of the 1930s, MARBS have almost tripled up to the present (0.66 g cm-2 yr-1), which documents a gradual glacier retreat and input of eroded particulate material because of the rapid regional warming trend observed in the last decades. With rising air temperatures predicted for the future the particle flux in the water column may further increase. However, the resulting severe consequences for nearshore marine ecosystems in this sensitive area are hard to predict.
Acknowledgements
The authors extend their gratitude to the shipboard scientists and crew of the RV Polarstern. We also thank the technical assistants Eleonore Gründken, Carola Lehners, Martina Schulz (Institute for Chemistry and Biology of the Marine Environment, Oldenburg), Rita Fröhlking and Ute Bock (Alfred Wegener Institute for Polar and Marine Research, Bremerhaven). Special thanks go to Willard S. Moore for help in 210Pb modelling and Andreas Klügel (Bremen University) for his assistance with petrological analyses. The authors are in particular indebted to Kathy Licht and Sandra Passchier for their enthusiastic and critical reviews.
Supplementary material
Three Supplementary tables will be found at www.journals.cambridge.org/jid_ANS.