INTRODUCTION
The principal aim of this paper is to synthesize the results of research on the irrigation needs and water productivity of tea conducted at the Ngwazi Tea Research Station (NTRS), formerly the Ngwazi Tea Research Unit, now the headquarters of the Tea Research Institute of Tanzania, in the context of related work conducted elsewhere in Africa. It is a complementary paper to one that focuses on the water relations of tea (Carr, Reference Carr2010). Part 1 reviews our understanding of the physiological mechanisms responsible for the responses observed in the field in order to ensure, as far as possible, that the results of experiments have wide application in the eastern Africa region. Part 2 (this one) considers the practical outcomes of the research in order to inform field management practices and to assist with the planning of new projects.
The NTRS is situated in the Southern Highlands of Tanzania (8°33′S, 35°10′E; alt. 1840 m), an area with a long dry season (May to November) alternating with a single rainy season. There is a cool ‘winter’ season (May to August) followed by a warm, dry period prior to the start of the rains in November/December (Nixon et al., Reference Nixon, Burgess, Sanga and Carr2001). Large-scale commercial tea in the area is irrigated, although water supplies are limited; smallholder tea is mainly rainfed (Carr and Stephens, Reference Carr, Stephens, Willson and Clifford1992; Carr et al., Reference Carr, Ndamugoba, Burgess, Myinga, Ekpere, Rees, Mbwile and Lyimo1992). The soil is classified as a Xanthic Ferrasol with a brown, medium to fine textured topsoil over a deep (>5 m), very light coloured, unmottled, free draining clay subsoil. The available water holding capacity averages about 100 mm m−1 (Baillie and Burton, Reference Baillie and Burton1993; Carr, Reference Carr1974).
Tea producers want answers to what appear to be simple questions. These include: What cultivar (or clone) should be planted under rainfed and irrigated conditions, and at what density? How much water (or rather how little) is needed? What are the yield responses to water? How is water best allocated between immature and mature plants, or between cultivars? How much fertilizer is needed, particularly nitrogen, for irrigated and rainfed crops? What is the optimum harvest interval? In addition, planners of new projects want to know the suitability of a site, and its yield potential. All this is within the context of ‘will it be profitable?’ or ‘will livelihoods improve?’ The experiments at NTRS were designed to provide such information as the basis for rational decisions.
It is within this context that this paper reviews the results of research on crop water use, yield responses to water, dry matter production and partitioning, drought mitigation, crop models and irrigation systems. It concludes with an overview of the practical implications of the research and the lessons for the future. The quality of the processed tea is not considered here.
CROP WATER USE
Early work
In many areas where tea is grown in Africa, evapotranspiration from a crop with complete ground cover (ETc) ranges between 3 and 6 mm d−1, equivalent to 90–180 mm month−1, depending on the season. A selection of diverse experimental techniques have been used to develop the crop factor (f) relating ETc to evaporation from an open water surface (Eo), which has traditionally been calculated for tea with the McCulloch (Reference McCulloch1965) version of the Penman equation. These include a long-term, large-scale catchment water balance study (Blackie, Reference Blackie1979) and a weighing lysimeter (Dagg, Reference Dagg1970), both in Kenya, together with changes in soil water content using gypsum blocks (Laycock and Wood, Reference Laycock and Wood1963) and gravimetrically (Willatt, Reference Willatt1973), both in Malawi, and with a neutron probe (Cooper, Reference Cooper1979) in Kenya. The usually accepted value for ‘f’ for mature well-watered tea is 0.85 (Laycock, Reference Laycock1964; Dagg, Reference Dagg1970).
At NTRS, unirrigated, mature seedling tea, rooting to depths of 4.3 m, extracted water from a depth of 3.6 m by the end of the six-month long dry season (based on observations made with gypsum blocks) (Carr, Reference Carr1974). This corresponded to an actual soil water deficit (SWD) of about 330 mm (equivalent to 80 % of the estimated total available water), and to a potential SWD of about 1000 mm (ETc = 0.85Eo). In Malawi, the actual SWD under unirrigated mature seedling tea reached 380 mm (gravimetric sampling) by the end of the dry season, with water extraction down to 3.0–3.5 m depth (Willatt, Reference Willatt1973).
Mature clonal tea
Subsequently, at NTRS, unirrigated, mature clonal tea (6/8), rooting to depths >5 m, extracted water from depths below 4 m. Based on a water balance model developed from neutron probe data, the estimated annual actual water use (ETa) ranged from 800 mm (unirrigated tea) to 1200 mm (fully irrigated). When the soil water deficit exceeded 60 mm, ETa declined linearly with increases in the SWD until, by the end of the dry season, the estimated actual SWD for unirrigated tea reached about 330–350 mm, representing 95% depletion of the extractable water (Stephens and Carr, Reference Stephens and Carr1991b). These results are similar to the earlier findings for seedling tea in Tanzania and Malawi.
At NTRS, Burgess (Reference Burgess1994a) compared several methods for estimating the water requirements of tea. Using 41 months' data, the Penman-Monteith equation, with appropriate crop and aerodynamic resistance values, was recommended for estimating daily crop water use (Ep-m) during the dry season, without the need to include a crop factor (Ep-m = 0.84 (±0.005) Eo; R 2 = 97 %; n = 41). Where weather data are not available, Burgess (Reference Burgess1994a) confirmed that a sunken, 1.83 m square, 0.6 m deep, screened ‘British’ evaporation pan could be used with confidence for scheduling the irrigation of tea (with suitable correction factors to allow for the colour of the pan and its siting). Previously, Stephens and Carr (Reference Stephens and Carr1991a) had shown that evaporation from a British pan matches closely ETc (β = 0.99; R 2 = 93%; n = 20), calculated using the McCulloch method for estimating Eo with a crop factor of 0.85.
Immature clonal tea
The water use of young tea with partial crop cover can be estimated with the equation developed by Dagg (Reference Dagg1970) using a large hydraulic lysimeter in Kericho, Kenya:

where ET is monthly evapotranspiration, Eo is the Penman estimate of open water evaporation, a is the fraction of the soil covered by crop at noon, and n is the fractional number of rain days per month.
Based on measurements with a neutron probe made under young tea at NTRS, Burgess (Reference Burgess1992a) developed a simple model for estimating the cumulative water loss. Given the degree of ground cover, soil available water capacity, maximum rooting depth and ETc, the model partitions crop water use into transpiration, soil evaporation and drainage. Using this approach, Burgess (Reference Burgess1993a) described a simple method for scheduling irrigation of immature tea. For each of three pan evaporation rates (3, 4 and 5 mm d−1) graphs were presented from which the potential SWD could be predicted for different degrees of ground cover, given the number of days since the soil profile was last at field capacity.
Summary: crop water use
1. The generally accepted crop factor (f) for tea with complete ground cover is 0.85 (ETc = 0.85Eo).
2. Mature tea can extract water from depths greater than 4 m; the depth of extractable water at NTRS was 330–350 mm.
3. Actual annual water use (ETa) was about 800 mm for rainfed tea, and 1200 mm for well-irrigated tea. ETa declined linearly with increase in the SWD after it exceeded 60 mm.
4. The Penman-Monteith equation gives a direct estimate of ETc.
5. A sunken and screened ‘British’ pan can also provide an estimate of ETc in the dry season.
6. For young tea, ETc can be estimated with a model that includes crop cover and the number of rain days as variables.
7. A simple method for scheduling irrigation of young tea on the basis of these measures has been devised.
YIELD RESPONSES TO IRRIGATION
There are several ways of expressing the yield responses to irrigation, or crop water productivity, and it is necessary to differentiate between them to minimize confusion. They include: yield (absolute totals or increments) as a function of actual water use (ETa), potential water use (ETc) (these can be numerically equivalent to actual or potential SWDs respectively), transpiration (T) and water applied (irrigation alone and/or rainfall). Similarly the time period represented can be annual totals or dry season values only. The results of experiments synthesized below include all these descriptors. Yields can also be expressed as ‘dry’ tea (no moisture) or as ‘processed’ (or ‘made’) tea, implying water contents of 2–4%. The results for mature (>7 years from field planting) and immature (<7 years) tea are considered separately.
Mature tea
Early work: One of the first tea irrigation experiments reported from Africa was undertaken at NTRS over the period 1967–1970 (Carr, Reference Carr1974). In this high altitude, seasonal location, there is an extended dry season alternating with one rainy season. Frequent irrigation doubled the annual yields (from about 1000 to 2000 kg ha−1 processed tea) obtained from mature (planted 1959), heterogeneous seedling tea and improved within-year crop distribution to some extent. These are low yields by today's expectations. Irrigation was applied at potential SWDs ranging from 25 to 150 mm with the soil profile wetted to field capacity at each irrigation. The limiting SWD for both annual and dry season yields for this deep rooting tea (4.3 m) was in the range 100–150 mm, equivalent to about 25–35% depletion of the available water. There was some evidence of ‘compensatory’ shoot growth following the relief of water stress in the less frequently irrigated plots, and especially in the ‘dry’ unirrigated plots after the start of the rains. This was the result, in part, of seasonal differences in shoot population densities following the synchronization of shoot growth and development during the period of water stress (Carr, Reference Carr2010). In each of the irrigated treatments, an average of about 700 mm of water was applied during the dry season. This corresponded to a yield response to irrigation totalled over the three-year period of about 1.4 kg (ha mm)−1. For the one treatment, in which only half the calculated quantity of water required was applied at each irrigation (75 mm at a potential SWD of 150 mm), the corresponding yield response was about 1.8 kg (ha mm)−1. Part of the benefit from irrigation was due to the control of the disease Phomopsis theae.
The principal objective of another irrigation experiment at that time was to determine whether it is possible to adjust the frequency of irrigation during the dry season, and particularly in the ‘winter’ months when shoot extension rates are slow (Carr, Reference Carr and Carr1971a; Nixon and Carr, Reference Nixon and Carr1995). The results clearly showed that there were no adverse effects of reduced irrigation frequency on total annual yields. However, crop distribution was dependent on the timing of irrigation. For clone BBT1 (which has a high base temperature for shoot extension, 14 °C, and consequently low winter yields (Carr, Reference Carr2010)) there were no adverse effects from irrigating less frequently in the cooler dry months (full replacement at a potential SWD = 150 mm) compared with more frequent irrigation (SWD = 50 mm). Indeed, when these treatment combinations were reversed in the warm dry season, yields were greater in the tea that had previously been irrigated at SWD = 150 mm treatment than in the control tea (irrigated at a SWD = 50 mm throughout the dry season). Similarly, compensatory growth during the rains made up for loss in yield during the warm dry season in the treatment irrigated less frequently at that time (SWD = 150 mm). The timing of nitrogen applications modified these responses. The large peaks in production that occurred after the relief of stress (low temperature or dry soil induced) were the result of synchronization of shoot growth, which is more extreme in this clone than most others. This is one of the contributory explanations for the lack of response of BBT1 to drought/irrigation, in terms of the total annual yield, reported below (Stephens and Carr, Reference Stephens and Carr1990). In addition, after the start of the rains, the extension rate of shoots of previously unirrigated BBT1 was 86 % greater than that of previously irrigated plants, the rate of increase in leaf area was 75 % greater, and the final area of an expanding leaf was 74 % larger. These exceptional rates of growth did not however last long (Carr, Reference Carr1969).
At about the same time, similar experiments were being undertaken independently in southern Malawi (16°05′S; alt. 650 m) where there is an equivalent seasonal climate to that found in southern Tanzania (Dale, Reference Dale and Carr1971). Although most conditions were similar at the two sites, there were marked differences in the dry season yield responses to irrigation. In particular, there was variability between years in Malawi despite similar quantities of water being applied. In some years, yields in the dry season were limited by the hot (air temperatures >30 °C for 30 consecutive days in October), dry air (saturation deficits >2.0 kPa) conditions experienced at that time in this relatively low altitude site. In such a year, yield responses to irrigation (plus rainfall) in the dry season were only 0.3 kg (ha mm)−1, about one third of those obtained in less hot years (Carr et al., Reference Carr, Dale and Stephens1987). Later, an analysis of commercial yields in Malawi suggested a dry season yield loss corresponding to about 1.2 kg (ha mm)−1 for increases in potential SWD over the range 100–650 mm. This compared to an equivalent value of 1.4 kg (ha mm)−1 for Kericho, Kenya (Carr and Stephens, Reference Carr, Stephens, Willson and Clifford1992).
Irrigation × fertilizer: More recently at NTRS, the yield responses of mature clonal tea (6/8) to irrigation and fertilizer were studied in a long-term (1986–2004) field experiment (labelled N9), based on the line source technique, as originally described by Hanks et al. (Reference Hanks, Keller, Ramussen and Wilson1976), using the method of data analysis proposed by Morgan and Carr (Reference Morgan and Carr1988). Stephens and Carr (Reference Stephens and Carr1991a) reported the results for the first three years of the experiment (phase 1) in terms of yield loss for each mm increase in the potential SWD. In all three years there were significant linear or slightly curvilinear reductions in yields during the dry season with increasing potential SWD (up to ca. 700 mm). At relatively high fertilizer levels (300 kg N ha−1), the rate of yield loss (dry tea) in the dry season was equivalent to 1.9–2.7 kg ha−1 (mm SWD)−1 and, for unfertilized tea, 0.9–1.4 kg ha−1 (mm SWD)−1. In the first two years the benefits from irrigation continued into the rains, but in the third year there was evidence of some yield compensation in the dry plots, with yields from the unirrigated tea exceeding those from irrigated tea during the early part of the rainy season. Annual yields from unirrigated tea in well-fertilized plots increased from 2000 to 3200 kg ha−1 over the three years and, for the equivalent irrigated tea, from 3400 to 4900 kg ha−1, reflecting in part cumulative benefits. Irrigation increased the proportion of the annual crop harvested in the dry season to up to 45%.
Following the approach used by Doorenbos and Kassam (Reference Doorenbos and Kassam1979), relative yield loss during the dry season was plotted against the corresponding relative reduction in actual water use for each of the first four years of the experiment (1986–89). The slopes of the response curves (Ky) were similar for each year (except in the year of prune), and independent of fertilizer level, with a pooled value of 1.3, meaning that the reductions in yield during the dry seasons were proportionally more than the reductions in crop water use (Stephens and Carr, Reference Stephens and Carr1991b).
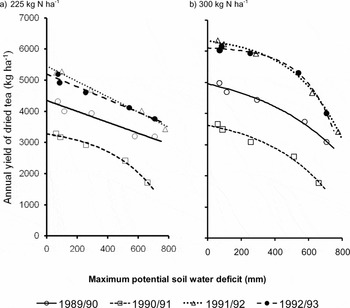
After pruning in November 1990 (phase 2), annual yields continued to increase in the following three years, reaching 6000 kg ha−1 in well-irrigated and fertilized plots by 1991/92 (Burgess, Reference Burgess1993b). Annual yield responses to increases in the maximum potential SWD were now consistently curvilinear at fertilizer inputs corresponding to 300 kg N ha−1 and above, but, apart from in the year of prune (1990/91), linear at nitrogen levels less than these (Figure 1). It is not clear what caused these differences in the shape of the response curves. For example, the yield loss for each mm increase in the potential SWD at 225 kg N ha−1 was between 1.7 and 2.5 kg ha−1. By contrast, at 300 kg N ha−1, the yield loss increased from 0.75–1.8 kg (ha mm)−1 at SWD = 200 mm to 2.3–3.0 kg (ha mm)−1 at a SWD = 400 mm, and 4.9–11.8 kg (ha mm)−1 at a SWD = 600 mm.
Relations between the yield of dry tea and the maximum potential soil water deficit for clone 6/8 receiving a) 225 and b) 300 kg N ha−1 (as NPK) for each of four years from June 1989. The tea was pruned in November 1990 (from Burgess, Reference Burgess1993b).

Afterwards, Stephens et al. (Reference Stephens, Burgess and Carr1994) analysed the annual and seasonal yields and ETa for the first eight years of the experiment (1986–1993). For plots receiving annual applications of 225 kg N ha−1 (the commercial level applied at that time), yields increased over this period from 1800 to 3700 kg ha−1 in the unirrigated tea and from 3200 to 5700 kg ha−1 in well-irrigated tea. ETa did not vary greatly between years and averaged 700 mm and 1200 mm respectively. There was therefore an upward trend in water productivity over time from 2.3 to 5.3 kg (ha mm)−1 and from 2.7 to 4.6 kg (ha mm)−1 for unirrigated and irrigated tea respectively. In each year, annual yields declined linearly with increases in the maximum estimated actual soil water deficit (SWDa) at rates of up to 6.3 kg ha−1 for each mm increase in SWDa. The slope and shape of the relationships between yields and water use were strongly dependent on fertilizer application levels (range 0–450 kg N ha−1).
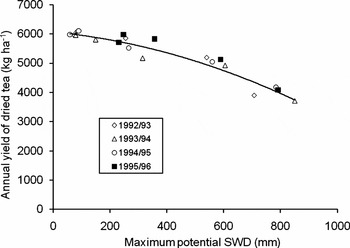
In the cropping year 1995/96, to see if water productivity could be increased, irrigation was withheld for seven weeks prior to the start of the rains to allow a 230 mm potential SWD to accumulate in the normally well-irrigated treatments. Although some crop may have been lost at this time, there was no obvious compensation in yield following the start of the rains. At the 300 kg N ha−1 input level, the average annual yield response to water (irrigation plus annual rainfall) received during the year (1700 mm) was 3.4 kg (ha mm)−1, close to the values obtained in the previous three years (3.1–3.4 kg (ha mm)−1). Similarly, the yield response to drought over these four years showed a consistent curvilinear relationship between the annual yield (range 6000–4000 kg ha−1) and the potential maximum SWD (range 50–800 mm). Yields declined at an increasing rate, from 1 to >6 kg ha−1 (mm SWD)−1, as the SWD increased (for comparison, the corresponding linear mean was 3.2 kg ha−1 (mm SWD)−1 (Figure 2) (Nixon, Reference Nixon1995; Reference Nixon1996a).
The relationship between the annual yield of dry tea from mature clone 6/8 (with 300 kg N ha−1) and the maximum potential soil water deficit (SWD) for four successive years. The curve is for the first three years only (open symbols). In 1995/96, water was withheld at the end of the dry season to allow a 230 mm SWD to develop in the ‘fully’ irrigated treatment (solid symbols) before the rains began (from Nixon, Reference Nixon1996a).

The weight of prunings recorded in June 1996 (all foliage more than 0.40 m above the ground removed) reflected the cumulative effect of treatments on dry matter production in the 5½ years since the previous prune (in November 1990). At the 300 kg N ha−1 level, dry weights increased from about 20 to 27 t ha−1 with increase in water applied, and from 7 to 30 t ha−1 with increase in fertilizer inputs (as NPK) from zero to 450 kg N ha−1 in the well-irrigated treatment (Mizambwa, Reference Mizambwa1997).
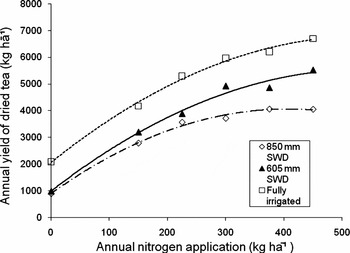
After pruning in June 1996 (phase 3), the experiment was severely damaged by frost. The tea was pruned at ground level to aid recovery, and at the same time plastic barriers installed to 1.0 m depth between the fertilizer treatments in order to restrict movement of nutrients between adjacent plots. The fertilizer treatments were also modified, with nitrogen alone becoming the principal variable, not NPK. For the next two years, the whole experiment was irrigated uniformly during the dry season until complete ground cover (>95%) was again achieved. Afterwards, for the five years from 1999/2000 to 2003/2004 differential irrigation treatments were reinstated. At the 300 kg N ha−1 level (which is close to the optimum for well-irrigated tea, Figure 3) annual yields increased linearly (R 2 = 64%; n = 25) with the depth of irrigation water applied (range 10–820 mm) during the dry season from about 4300 kg ha−1 (rainfed) to 6900 kg ha−1 (fully irrigated) at an average rate of about 3.1 (±0.49) kg (ha mm)−1 (Kimambo, Reference Kimambo2005a).
Annual yield (1993/94) response of clone 6/8 to nitrogen fertilizer (applied as NPK 20:10:10) at three potential maximum soil water deficits (SWD) (from Burgess, Reference Burgess1994b).

Summary: mature tea
1. For low yielding (<2000 kg ha−1) seedling tea, the annual yield benefit from effective irrigation equates to about 1.3 kg (ha mm)−1, increasing to 1.8 kg (ha mm)−1 with deficit irrigation. Where high temperatures or dry air occurs this may be reduced to 0.3–1.0 kg (ha mm)−1. Commercial yield losses during the dry season in Malawi are about 1.3 kg ha−1 (mm SWD)−1.
2. For reasonably high yielding (up to 6000 kg ha−1) clone 6/8, over the first three years of treatments, reductions in dry season yields for each mm increase in the potential SWD went from 0.9 to 1.4 kg (ha mm)−1 for unfertilized tea, and from 1.9 to 2.7 kg (ha mm)−1 at 300 kg N ha−1. Over the same period, the Ky factor for dry season yields averaged 1.3, independent of fertilizer level, implying drought sensitivity at this time.
3. After pruning, the annual yield losses equated to 1.7 to 2.5 kg (ha mm)−1 at 225 kg N ha−1, over three years, and from 0.8 to 12 kg (ha mm)−1 at 300 kg N ha−1, depending on the potential SWD.
4. Later, once full crop cover was achieved, over a four-year period, the corresponding annual values at 300 kg N ha−1 were between 1 and >6 kg (ha mm)−1, again increasing with the potential SWD, with a linear mean of 3.2 kg (ha mm)−1.
5. The annual yield responses to actual water use (ETa) for unirrigated clone 6/8 increased over an eight-year period from 2.3 to 5.3 kg (ha mm)−1 and for irrigated tea from 2.7 to 4.6 kg (ha mm)−1, as absolute yields increased (at 225 kg N ha−1).
6. Over the same period, annual yields declined with increase in the actual SWD at rates up to 6.3 kg (ha mm)−1, depending on the fertilizer level.
7. The annual yield response to irrigation plus total annual rainfall averaged 3.1 to 3.4 kg (ha mm)−1 at 300 kg N ha−1.
8. The critical potential SWD above which annual yields declined was in the range 200–300 mm.
9. During the dry season, the critical SWD for yield was in the range 50–100 mm.
Conclusion
For planning purposes, an annual yield response of 3–5 kg ha−1 for each mm of effective irrigation for well-managed clonal tea, after allowing for a residual potential SWD at the end of the dry season of 200 mm, is probably realistic, providing there are no other limiting factors. For low input/low yielding farming systems, the yield response is proportionally less.
Immature tea
Early work: Irrigation of young tea is intended to increase plant survival and to improve early growth leading to cumulative yield benefits over time (Dale, Reference Dale and Carr1971). In Malawi, Willatt (Reference Willatt1970) showed that irrigation increased survival of 18-month-old rooted cuttings, and improved rooting depth and lateral spread. Similarly, in Kericho, Kenya, Othieno (Reference Othieno1978a) compared the responses of five young contrasting clones to supplementary irrigation during the dry season. As a result of better survival and early growth, cumulative benefits were recorded over the first two years. There was, however, little improvement in yield distribution, with low yields from both irrigated and unirrigated plants during the dry season when other factors, such as dry air, or low night temperatures, were probably limiting shoot growth (Othieno, Reference Othieno1978b).
Clone × irrigation (1). At NTRS, Burgess and Carr (Reference Burgess and Carr1996a) described the yield responses to irrigation/drought of six contrasting clones, all commercially and/or scientifically important in eastern Africa (experiment N10), for the first four years (phase 1) after field planting (in 1988). Based on the line-source experimental design, differential drought treatments were imposed towards the end of the dry seasons for 16 weeks in 1990 and for 13 weeks in 1991. Although annual yields for all clones decreased curvilinearly as the maximum SWD (simulated using a water balance model) increased, single values for the drought sensitivity of each clone could be derived using stress time (summed above a derived value for the critical SWD) as an index of drought. The derived SWD values were 70 mm in 1990 and 90 mm in 1991. Using this approach, clones BBT207 (probably because of its sensitivity to a stem canker, P. theae) and S15/10 were identified over the two years as drought sensitive, and SFS150 and BBT1 as drought tolerant; clones BBK35 and 6/8 were intermediate in response.
A similar analysis was conducted for dry season yields. Using the mean yields for all six clones, the derived critical SWDs were 40 mm in 1990 and 50 mm in 1991, both less than the estimated values for annual yields. Clone S15/10 was again identified as drought sensitive in both years, but not BBT207. Overall, S15/10 was the highest yielding clone, reaching 5600 kg ha−1 in the fourth year (1991/92) after planting in the field when well irrigated.
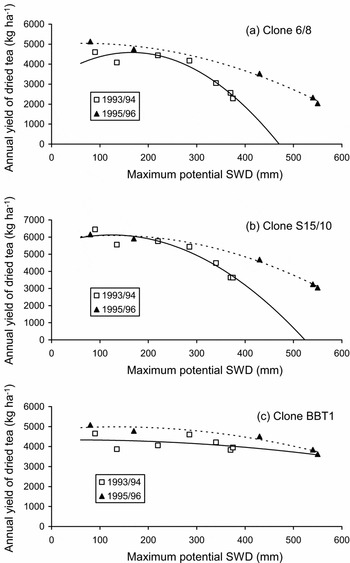
Later, reporting the same experiment (phase 2), Nixon (Reference Nixon1996b) demonstrated how responses to drought changed as the clones matured. Figure 4 shows how the shape of the annual yield responses curves to the maximum potential soil water deficit varied considerably between clones, with BBT1 again being particularly tolerant of drought, and 6/8 and S15/10 both relatively sensitive. Annual yields declined rapidly once the SWD exceeded about 250–300 mm in 1993/94, 5–6 years after planting (the year before pruning), but less rapidly in 1995/96, 7–8 years after planting (the year after pruning). There was no change in the shape of the response curve for BBT1 (an extreme China-type clone), which remained flat. Clones SFS150, BBK35 and BBT207 were similar in response to 6/8. The annual yields of dry tea under well-irrigated conditions in 1995/96 were all in the range 5300–6300 kg ha−1, with S15/10 yielding the most, and BBT1 the least. Thus, when the potential SWD exceeded about 300 mm, the annual yield loss (or yield gain from irrigation) ranged from 1 (BBT1) to 15 (BBT207) kg (ha mm)−1 in 1993/94 to 2 (BBT1) and 7 (BBT207) kg (ha mm) −1 in 1995/96 (Nixon, Reference Nixon1996b). Yield distribution during the year also varied between clones. For example, weekly yields declined most rapidly as the SWD increased for BBT207, whilst shoot growth continued for longer with SFS150.
The effects of the maximum potential soil water deficit (SWD) on the annual yields of dry tea for each of three clones over two years 1993/4 and 1995/96, five and seven years after the year of planting, the years before and after the year of pruning respectively (from Nixon Reference Nixon1996b).

By 2002/03, the year before the experiment ended (phase 3), there were further changes in the annual yield responses to drought (potential SWD). For clones 6/8 and BBT207, it appeared to be linear with an average yield loss for both clones of 6.6 kg (ha mm)−1; for S15/10, BBK35 and SFS150, it was two-step linear with yields declining by 4.4 kg (ha mm)−1 once the potential SWD exceeded about 370 mm; for BBT1 the relationship had not changed (Mizambwa, Reference Mizambwa2004a).
Ranking clones on the basis of cumulative yields over the first two pruning cycles (1990–1994 and 1994–1999) identified clone S15/10 as the highest yielding under well-irrigated conditions with 5000–8000 kg ha−1 (12–17%) more than each of the other five clones in the order SFS150 (next highest), BBT207, BBK35, 6/8 and BBT1 (TRIT, 2000). Under droughted conditions, BBT1 yielded 3000 kg ha−1 (11%) more than S15/10 and SFS150, followed by BBK35, 6/8 and BBT207. In terms of yield loss due to drought, BBT207 suffered most with a reduction in cumulative yield of 24 500 kg ha−1 (−58%), followed by 6/8 (22 000; −54 %), BBK35 (20 000; −48 %), S15/10 (20000; −41 %), SFS150 (15000; −34 %) and lastly BBT1 (9000; −24 %). Based on absolute yields under dry conditions, as well as by both relative and absolute yield loss, BBT1, S15/10 and SFS150 could be identified as the three most drought tolerant, with BBT207 and 6/8 the most drought susceptible.
Based on visual assessments of the severity of drought symptoms in 2001, the clones were ranked in the order 6/8 (worst), BBT207, S15/10 = BBK35 (but variable), SFS150 and BBT1 (best).
Clone × irrigation (2): A similar experiment (labelled N14) to the one reported above was established at NTRS in 1997, with six different clones, three from Malawi and three from Kenya. The results for the first pruning cycle were summarized by Mizambwa (Reference Mizambwa2004b). By 2002/03, yields from the best clones (12/28, PC81 and 31/8) had exceeded 7000 kg ha−1 when well irrigated. In that year, annual yields from these three clones declined linearly with increases in the potential SWD (up to 410 mm) at a rate of 5.5 kg (ha mm) −1 from an average yield of 7500 kg ha−1. From a lower maximum yield (5250 kg ha−1), yields from clones PC105 and TN14/3 also declined linearly (at a rate of 6.2 kg (ha mm)−1). By contrast, the response of clone PC105 (intermediate in yield) was curvilinear.
Cumulative yields under well-watered conditions were similar for clones PC81, 12/28 and 31/8, totalling 26 000 kg ha−1 over the five years 1998/99 to 2002/03. These were followed by PC113 (22 000), 14/3 (19 000) and PC105 (18 000). When only partially irrigated, the clones were ranked in a similar order, with yield losses ranging from 9000 kg ha−1 (−35%) for 12/28 to 7000 kg ha−1 for PC81 (−24%) and 14/3 (−37%). Based on relative yield loss, 12/28 (and also to a lesser extent TN14/3, PC113 and especially PC105) would be described as drought sensitive, but in absolute terms 12/28 was the third highest yielding under dry conditions and second highest under wet conditions. PC81 was the ‘best’ clone using any of the three criteria (yield when well-irrigated, when droughted and relative yield loss), and PC105 the ‘worst’.
Composite plants × irrigation: A similar experiment (labelled N13), again based on the line-source technique, was undertaken to evaluate the responses to drought/irrigation of selected composite plants at NTRS. There were two scion clones (BBK35 and S15/10) each grafted on to each of three rootstocks (6/8, SFS150 and PC81), as well as on to each other. In the sixth and final year of the experiment (2001/02) rootstocks 6/8 and SFS150, as in previous years, increased the annual yields of both scions by 9 and 7 % respectively in the two driest treatments (but this increase was not statistically significant). At the end of the dry season (potential SWD ≥ 700 mm), there were clear visual differences with S15/10 on 6/8 and BBK35 on SFS150 both surviving the drought better than the corresponding ungrafted scion control plants. Visually, scion BBK35 showed fewer drought symptoms than S15/10 on all rootstocks, an observation confirmed by measurements of the xylem water potential (Mizambwa, Reference Mizambwa2002; Reference Mizambwa2003). The annual yield responses to water for each scion (averaged across all treatment combinations) differed. For scion S15/10 there was a linear decline in yield over the whole potential SWD range (50–770 mm) with a slope of −6.0 kg (ha mm)−1 (R 2 = 0.96). For scion BBK35, the relationship was curvilinear, with annual yields declining rapidly (ca. 10 kg (ha mm)−1) once the potential SWD exceeded about 200–300 mm. Maximum yields for scion S15/10 were in excess of 7000 kg ha−1, and for BBK35 around 6500 kg ha−1.
Trials in Kericho, Kenya, have shown that yields of clones can be increased significantly by grafting onto suitable rootstocks, with the best combinations giving profitable returns compared with straight cuttings. Grafting increased the number of shoots harvested, and had little or no effect on the quality of the tea produced (Tuwei et al., Reference Tuwei, Kaptich, Langat, Chomboi and Corley2008a). One of the benefits of grafting was to improve the drought tolerance (defined by a drought tolerance index) of susceptible scions (Tuwei et al., Reference Tuwei, Kaptich, Langat, Smith and Corley2008b). Useful rootstocks included TN14/3, China 3, BBT1 and PC87. The most productive scion was 31/8. Yield increases averaged 400–500 kg ha−1 (ca. 10 %) for 31/8 on TN14/3. Unilever Tea Kenya Ltd. has planted this combination on a commercial scale (Tuwei et al., Reference Tuwei, Kaptich, Langat, Chomboi and Corley2008a). In Malawi, rootstocks are selected for, amongst other attributes, high degrees of drought tolerance and compatibility with a wide range of scions. TRFCA recommended rootstocks include MFS87, PC87, 7/7, 14/22, PC138 and PC141 (TRFCA, 2000).
Plant density × irrigation
In order to assess the effect of plant population on water productivity, the responses of two contrasting clones to plant density and drought were evaluated in a field experiment at NTRS (labelled N12) again based on the line-source irrigation method (Kigalu and Nixon, Reference Kigalu and Nixon1997). Kigalu (Reference Kigalu2007) has reported some of the results for the first six years from planting in January 1993 (phase 1). The two clones that were compared differed in their growth habit: BBK35 is upright in nature, whilst S15/10 is spreading. The six densities that were compared ranged from 8333 ha−1 (1.2 × 1.0 m), below the current commercial practice, to 83 333 ha−1 (0.6 × 0.2 m), which is considerably in excess of that density. In addition, there were seven irrigation/drought treatments: these were first imposed in the third year after planting (1995/96). Prior to this all the treatments were uniformly irrigated during the dry season. After planting the soil was mulched, and the young plants were brought into production by de-centreing and tipping. As expected, clone S15/10 covered the ground much quicker than BBK35, especially at the low densities. At the two highest densities, both clones had virtually complete ground cover within 24 months of planting.
Yields in the first cropping year (1993/94) increased linearly with plant density, but the slope of the relationship was three times greater for S15/10 than BBK35 (6.9 cf. 2.3 kg plant−1). In the following four years, yields from well-irrigated treatments increased asymptopically with plant density, but with the magnitude of the responses decreasing year on year, particularly with S15/10. By year six (1998/99), there were no longer any yield benefits from increases in plant population. Annual yields peaked at about 6700 kg ha−1 (S15/10) and 6000 kg ha−1 (BBK35).
The yield responses to drought at different densities have only been reported for one dry season (1995). Yields declined linearly in all cases as the potential SWD increased from 40 to about 270 mm. For S15/10, the lines depicting these declines were approximately parallel for each density treatment (−3.6 kg (ha mm)−1). For BBK35 there were differences between densities: at low densities the lines were virtually flat (−0.05 kg (ha mm)−1) with dry season yields remaining constant regardless of the level of drought stress. That is, for this clone, crops planted at low densities (8300 and 12 500 ha−1) withstood drought better than those at a higher density (21 000 ha−1). For S15/10, all densities were affected equally.
Inspection of the cumulative yields extracted from the TRIT annual reports and summed for the period from when regular harvesting began (1994/95) to the first prune five years later (1998/99) suggest that a plant density close to 40 000 ha−1 gives the maximum yield advantage for both clones, when fully irrigated as well as when droughted. When averaged across all six irrigation treatments, the cumulative yields for S15/10 were 33 % (7000 kg ha−1) more at this density (D5) than for the corresponding low (current commercial) density (D2, 12 500 ha−1), namely 28 500 kg ha−1 compared with 21 500 kg ha−1. The benefits from high density planting were similar for BBK35, with a 40% (6000 kg ha−1) increase (21 000 compared with 15 000 kg ha−1).
There were further yield benefits from high density planting in the year following the first prune whilst full crop cover was being re-established (1999/2000, phase 2). On a base yield of 1700 kg ha−1, this equated to about 500 kg ha−1 for BBK35 when averaged across watering treatments, and for S15/10 about 300 kg ha−1 (base yield only 1000 kg ha−1). Clone S15/10 is well known for its slow recovery from pruning. In succeeding years, there was virtually no response to density beyond D2 (12 500 ha−1).
These large cumulative yield benefits, which appear to be consistent between clones and between drought treatments, demand a detailed analysis to identify the economic conditions that justify high density planting (20–40 000 ha−1), including savings in the cost of weeding.
Over the first four years of differential irrigation, a total of 1540 mm more water was applied to the fully irrigated crop (I6) compared to the most droughted treatment (I0). This equates to a cumulative yield response to irrigation ranging from a consistent 3.0–3.3 kg (ha mm)−1 (for low density S15/10 and BBK35, and also high density, D5, S15/10) up to 6.0 kg (ha mm)−1 for high density BBK35. In the five years after pruning, yield responses to irrigation water applied again averaged about 3–4 kg (ha mm)−1 for S15/10, once full crop cover was achieved. For BBK35 the shape of the response curve continued to be curvilinear, with maximum responses reaching 7–9 kg (ha mm)−1, regardless of plant density. Visual observations indicated that BBK35 suffered more in dry conditions, especially at high densities, than S15/10. Perversely, this was the opposite ranking to that observed for BBK35 as a scion, in the neighbouring composite experiment (N13).
Mature versus immature comparisons
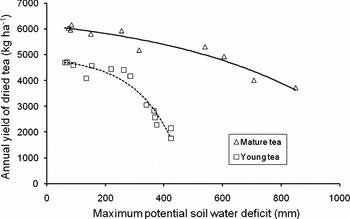
In an attempt to understand better the processes leading to reduced drought sensitivity with age, Nixon et al. (Reference Nixon, Burgess, Sanga and Carr2001) compared the responses of mature and young clone 6/8 plants in two experiments reported above (N9 and N10, which at the time were about 22 and 5 years respectively after field planting). For the mature crop, annual yields (1993/94) did not decline until the maximum potential SWD exceeded about 300–400 mm, and for the young tea, 200–250 mm (Figure 5). At deficits greater than these, yields declined relatively slowly in mature tea (up to 6.5 kg (ha mm)−1) but rapidly in young tea (up to 22 kg (ha mm)−1). The apparent insensitivity of the mature crop to drought was principally due to compensation during the rains for yield lost during the dry season. Differences in dry matter distribution and shoot:root ratios also contributed to these contrasting responses. Thus the total above-ground dry mass of well-irrigated, mature plants was about twice that for the corresponding young plants, but the dry mass of structural roots was four times greater and for fine roots eight times greater (Carr, Reference Carr2010). In addition, each unit area of leaf in the canopy had six times (by weight) more fine roots to extract and supply water than did young plants.
A comparison between the annual (1993/94) yield response to drought of young (four years after the year of planting) and mature (21 years) clone 6/8 (from Nixon et al., Reference Nixon, Burgess, Sanga and Carr2001).

Summary: immature tea
1. The line-source irrigation system provided a successful way for evaluating a selection of contrasting clones to drought/irrigation and for assessing water productivity. It also served as an excellent visual demonstration of treatment effects for visitors.
2. With strictly controlled harvesting, the annual yield potential of some clones (e.g. S15/10, PC81, 12/28 and 31/8) exceeded 7000 kg ha−1 (dry weight) within six years of planting in this part of southern Tanzania.
3. Water productivity increases as yields rise.
General
4. The shape of the annual yield/water-use or irrigation response functions changed with time from planting, and varied between the clones tested.
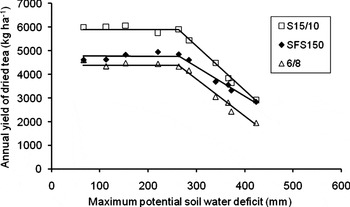
5. For some clones the response function was sometimes linear (e.g. S15/10), for others it was curvilinear (e.g. K35), and for these clones and others it could sometimes be two-step linear (Figure 6). But it was not always consistent for individual clones between years.
Response curves
Examples of two-step linear relationships between the annual yields of dry tea (for 1992/93 and 1993/94, years four and five following the year of planting) and the maximum potential soil water deficit for each of three immature tea clones. The relative yield decline was greatest for clone S15/10 and least for SFS150 (from Nixon, Reference Nixon1995).

6. Critical potential SWD for annual yields varied between ca. 50 mm and 200–300 mm, depending mainly on plant age. During the dry season, it was <50 mm for immature tea.
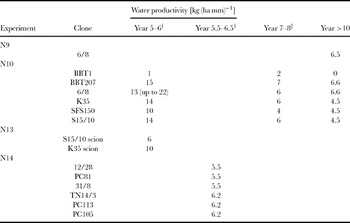
7. For 5–7 year old plants (the year before the first prune), annual yield losses due to drought/gains from irrigation varied between 5–6 (N14) and 10–15 kg (ha mm)−1 (N10) once the critical SWD was exceeded (Table 1).
8. Clone BBT1 behaved differently; its (lack of) annual yield response to irrigation/drought was totally different from any other clone. This was mainly the result of yield compensation, more than in other clones, when drought stress was relieved by rain or irrigation.
9. In general, the sensitivity to drought declined after six or seven years from planting (the year after the first prune) when it tended to stabilize at around 3–6 kg (ha mm)−1 (N9, N10, N12, N13, N14).
10. Clones 6/8 and BBT207 were both drought sensitive when young, but clone 6/8 in particular became more drought tolerant with age. Care has to be taken when defining what is meant by drought tolerance (N9, N10, N14).
11. Increases in drought tolerance as plants mature were associated with reductions in the shoot:root ratios with time from planting (N9, N10).
12. Based on cumulative yields under dry conditions, clones BBT1, SFS150 and S15/10 could be considered to be drought tolerant. SFS150 also had a low base temperature for shoot growth, whilst S15/10 recovered slowly from pruning (N10). PC81, 12/28 and 31/8 also performed relatively well (N14).
Yield responses
Average annual yield losses to drought/gains from irrigation water applied for a selection of well-fertilized clones at different times from planting when potential soil water deficits exceeded ca. 200–300 mm.

†Year before first prune.
‡Year after first prune.
13. There is some evidence for worthwhile (ca. 10 %) yield benefits from selected scion:rootstock combinations (e.g. 31/8 on TN14/3), including improved drought tolerance.
Composite plants
14. Large cumulative yield benefits (up to about 7000 kg ha−1) were achieved from high density planting (20 000–40 000 ha−1) in the first six years after planting, and also in the year following the first prune (N12). A full cost/benefit analysis is needed.
Plant density
Conclusion
These complex findings, only partly summarized here, have implications in terms of clone selection for improved water productivity under rainfed or irrigated conditions, changes in the economics of irrigation as crops mature, and prioritizing the allocation of water between clones and plants of different ages.
DRY MATTER PRODUCTION AND PARTITIONING
The proportion of the total dry mass that is allocated to the economically useful structural component, the so-called harvest index, governs the yield potential of a crop. For tea the useful structure is the immature shoot. The partitioning of dry matter between these harvested shoots, the remainder of the leaf canopy, the woody structural stems and the roots of the tea plant is influenced by all the main environmental and cultural factors, and also varies with genotype as illustrated by the following examples.
Clone 6/8: At a high altitude site (2178 m), close to the equator, in Kenya, Magambo and Cannell (Reference Magambo and Cannell1981) found that over a year only about 8% of the total dry matter (including roots) was allocated to the harvested shoots (two leaves and a bud; clone 6/8; 6–7 years after planting) or 11% when root weight was excluded. Harvested tea bushes produced 36% less dry mass in a year (17 t ha−1) than those left to grow freely (26 t ha−1), and 64 % less wood.
At NTRS, the total above-ground dry matter production and the corresponding harvest index, were determined for selected fertilizer × irrigation treatments (experiment N9; mature clone 6/8) over the first complete pruning cycle (1986–1990, 5½ years) following the imposition of treatments (Burgess, Reference Burgess1992b). The mean annual dry matter production in the well-irrigated, relatively well-fertilized treatment was 16.9 t ha−1, of which the harvested shoots comprised 3.3 t ha−1 (20%) On the realistic assumption (then) that 25% of the total dry weight was allocated to roots the net annual increment in the total dry weight (including roots) was estimated to be 22.5 t ha−1, giving a harvest index of 15%.
Over the following four-year period (1990–1994), Burgess and Sanga (Reference Burgess and Sanga1994a) estimated the net annual dry matter production (including roots) of similar well-irrigated plants in the same experiment (N9) to be 21.5 t ha−1, of which 5.1 t ha−1 (24%) were harvested as shoots. For young plants (2–6 years from planting; experiment N10), the corresponding values were 22.5 t ha−1 and 4.1 t ha−1 (18%) (Burgess and Sanga, Reference Burgess and Sanga1994b). Both these harvest indices are substantially more than the corresponding value (8%) for the same clone derived by Magambo and Cannell (Reference Magambo and Cannell1981).
Cultivar comparisons
Clone × irrigation (experiment N10): At NTRS, plant dry weights including roots of four contrasting clones (BBT1, 6/8, SFS150 and S15/10) were measured eight months after field planting, and subsequently at intervals of three to four months, corresponding to the different seasons, during the following two years, 1989–1990. Fully irrigated plants of one clone (S15/10) were also harvested after four years in the field (1992). Clones differed in their rates of canopy development, and hence in their capacity to intercept solar radiation. Radiation use efficiencies were similar for all four well-irrigated clones and ranged from 0.40 to 0.66 g MJ−1, reducing to 0.09 g MJ−1 when a 16-week drought was imposed (Burgess and Carr, Reference Burgess and Carr1996b). Clone S15/10, a large yielding cultivar from Kenya, partitioned a greater proportion of dry matter to leaves and harvested shoots than the other three clones, and correspondingly less to structural roots, resulting in a maximum harvest index of 24% (including roots). There were also seasonal differences in partitioning with more dry matter being diverted to roots and less to shoots during the cool season (Tmean = 14–15 °C). Although drought had no significant effect on root growth, the amount of dry matter diverted to leaves, stems and harvested shoots declined by 80–95 %.
Clone × irrigation (experiment N14): The dry weight of the foliage removed at pruning (above 0.35 m, 7½ years after planting) was greatest for clone TN14/3 in both the well-irrigated (34 t ha−1) and the droughted treatments (22 t ha−1). By comparison, the lowest values were for clones PC81 (27 t ha−1, well-irrigated) and PC105 (18 t ha−1, droughted). The largest differential between wet and dry plots was for PC105 (13 t ha−1) and the least for PC81 (6 t ha−1). This matches the ranking based on the cumulative yields over the first pruning cycle (see above). Clone TN14/3 is notoriously difficult to harvest by hand, which is reflected in the height of the canopy at pruning (1.08 m) compared with the average for all six clones (0.94 m) (Kimambo, Reference Kimambo2005b).
Clone density (experiment N12): Based on the slope of the linear relationships between the cumulative yield of harvested shoots (dry mass), over a three-year period following planting, and the corresponding cumulative total dry matter production (based on seven harvests, including roots) the harvest index (or partition factor, Squire, Reference Squire1990) for clone S15/10 was estimated to average 17% (independent of plant density) and 14% for clone K35 (Kigalu, Reference Kigalu1997).
In Kericho, Kenya, dry matter production and yields of four contrasting clones were compared at four sites differing in altitude by 400 m (range 1800–2200 m, corresponding to a difference in mean air temperature of about 3.5 °C) over a 34-month period, from planting in 1991 to the final harvest in 1994 (Ng'etich and Stephens, Reference Ng'etich and Stephens2001a). Total dry matter production over this time (assumed to include roots), averaged across clones, ranged from 18 to 23 t ha−1 from high to low altitude. Clone TN14/3 produced the largest mass of dry matter (31 t ha−1) at the low altitude site, whilst S15/10 produced the least (15 t ha−1) at high altitude. There were significant clone × site interactions: clones S15/10, BBK35 and 6/8 demonstrated below-average adaptability to the different environments. Clone TN14/3, by contrast, had wide adaptation responding well, in terms of dry matter, to the higher temperatures at the low altitude site. For the harvested yield (third year after planting), the position was reversed: TN14/3 was below average in adaptability and S15/10 was above average. This reflected large differences in the harvest indices, with as little as 10 % of the total dry matter being partitioned to yield for TN14/3, and up to 19 % for S15/10. Partitioning of dry matter to coarse roots was least for S15/10 at all four sites (ca. 10 %) and greatest for 6/8 (up to 20 %). Radiation use efficiencies varied between 0.3 and 0.45 g MJ−1 (Ng'etich and Stephens, Reference Ng'etich and Stephens2001b), whilst annual yields (third year after planting) increased with temperature at an average rate of 326 kg ha−1 °C−1 (range 275 °C−1 (6/8) to 441 kg ha−1 °C−1 (S15/10)) on mean site yields ranging from 1900 to 3000 kg ha−1 (Ng'etich et al., Reference Ng'etich, Stephens and Othieno2001).
In a complementary study by Balasuriya (Reference Balasuriya2000) in Sri Lanka, partitioning of dry matter to roots increased linearly with altitude from 30 to 1860 m (corresponding to mean air temperatures, over the seven-month study period, ranging from 26 to 15 °C respectively). Clone TRI 2023 was particularly responsive to temperature, whilst TRI 2025 was relatively stable across the four environments that were compared.
Summary: dry matter production and partitioning
1. The harvest index varied with plant age, clone and site. For mature clone 6/8 (including roots) it ranged from 8 % (Kericho) to 24 % (NTRS). For immature plants it reached 18 % (6/8), and up to 24 % (S15/10) (NTRS).
2. Total annual net dry matter production (including roots) for immature tea (6/8) reached 22.5 t ha−1 (NTRS).
3. Clones differed in the amount of dry matter partitioned to roots. Of those tested, S15/10 allocated least and 6/8 the most (Kericho, NTRS).
4. Partitioning of dry matter to roots increased with increase in altitude, and during the ‘winter’ months (Kericho, NTRS, Sri Lanka).
5. Harvested tea bushes (6/8) produced less total dry matter than those left unplucked (Kericho).
6. The ranking of clones for drought tolerance based on differential dry matter production (wet and dry) matched the ranking based on cumulative yields, with PC81 performing best and PC105 least well (NTRS; N14).
7. There was evidence of a genotype times environment (G × E) interaction in relation to altitude (temperature) in terms of total dry matter production, with TN14/3 showing adaptability across environments, but not for yield (harvest index = 10% only) (Kericho).
DROUGHT MITIGATION
Run-off
Measurements taken in young tea on a uniform 10% slope in Kenya showed that once crop cover exceeds 60%, run-off (and erosion) is negligible (Othieno, Reference Othieno1975; Othieno and Laycock, Reference Othieno and Laycock1977). Prior to this stage being reached, cover crops, micro-catchments and (in particular) grass mulches will reduce run-off. Grass mulches will also reduce evaporation from the soil surface and can conserve water to depths of 0.90 m (Othieno, Reference Othieno1980). The practical aim must therefore be to encourage the crop canopy to cover the ground as quickly as possible through such practices as choosing a naturally spreading clone and/or planting at a high density. This could include planting a high-density row (plants 0.2 m apart) across the slope at specified intervals down the slope as a live crop barrier, thereby avoiding the problem of competition between tea and a cover crop, as well as gaining extra crop (Sanga and Kigalu, Reference Sanga and Kigalu2005).
Bringing into bearing
Based on measurements of plant water status made on three-year old plants in Kenya, there is no convincing evidence that tea plants brought into bearing by pegging are necessarily more susceptible to water stress than similar pruned plants. This was despite large visual differences in the size and form of shoot and root systems of the young clones (6/8 and 12/12), and older seedlings. Differences in responses to dry conditions by individual clones appeared to be of greater significance (Carr, Reference Carr1976).
Pruning
In mature tea, the time of pruning can play a major role in conserving water and minimizing drought stress. The removal of most of the foliage stops transpiration immediately, and the crop residue or prunings (as long as they remain in the field) act as a mulch. If pruning is carried out at the start of the dry season, refoliation occurs using water stored in the soil (Laycock and Wood, Reference Laycock and Wood1963; Laycock, Reference Laycock1964). In areas south of the equator, where the dry season is initially cool this is common practice. If pruning is delayed, there are yield advantages from bringing the soil profile back to field capacity (by irrigation) immediately after pruning but, depending on how fast the crop canopy regenerates, there is usually no need to irrigate pruned tea again (Carr, Reference Carr1969). In areas close to the equator, a compromise has to be reached since there is a crop peak following the rise in temperature prior to the start of the dry season. Pruning then begins once this crop has been harvested, but before the plants come under severe water stress (Othieno, Reference Othieno1983).
Shelter from wind
Contrary to expectations in the late 1960s, shelter from wind by Hakea saligna hedges does not conserve water in the dry season. Rather, research in the Mufindi District of southern Tanzania showed clearly that (young, 3–6 years) sheltered clonal tea experienced greater water stress than wind-exposed tea plants during the long dry season. Measurements of xylem water potential, stomatal opening and soil water content supported visual symptoms of drought stress and yield records (Carr, Reference Carr1971b; Reference Carr and Grace1985). Theory shows that this unexpected result is possibly an effect of wind on relative changes in the ratio of the canopy resistance to the diffusion of water vapour, and the aerodynamic resistance. In other words, if the cooling effect of wind on the leaf surface, and the resultant reduction in the vapour pressure gradient between the canopy and the surrounding air, is greater than the increase in the rate of transfer of water vapour away from the crop surface, increases in wind speed will reduce transpiration. This adverse effect of shelter on crop water use is rarely observed in the field, but the seasonal climate in Mufindi facilitates its manifestation in the tea crop.
Providing the adverse effects of drought in the dry season were not excessive, wind-sheltered tea outyielded wind-exposed tea during the main growing season, and during the cool weather. These responses could be explained by the influence of a 1–2°C increase in day-time air temperatures in wind-sheltered areas on rates of shoot extension at this high altitude (1900 m) site. The results indicate the complexity of interpreting what at first appeared to be a relatively simple study, and the problem of making blanket recommendations on the value or otherwise of shelter belts in tea (Carr and Stephens, Reference Carr, Stephens, Willson and Clifford1992).
MODELLING
Perhaps the first attempt to relate the yield of tea to weather conditions was by Laycock (Reference Laycock1964) in Malawi. Although its limitations were recognized, a linear relationship was established between an empirical weather factor (Etw, a simplified water balance) and annual yields. Subsequently, also in Malawi, a more fundamental approach to modelling yield processes in tea was developed (Fordham, Reference Fordham1970; Fordham and Palmer-Jones, Reference Fordham and Palmer-Jones1977). Following a period of axillary bud growth inhibition when evaporation rates were high in the latter part of the dry season, the model predicted the subsequent synchronous development of shoots, and the timing of the resultant yield peaks and troughs, which followed the removal of apical dominance when shoots were harvested (the so-called Fordham effect). But, it could not explain the size and conformation of the first peak or the decline in yields at the end of the rains (Matthews and Stephens, Reference Matthews and Stephens1998a).
In southern Tanzania, where shoot growth is synchronized by a period of cold weather, a simple Stress Time Index (STI) for predicting yield loss due to drought was described by Stephens and Carr (Reference Stephens and Carr1989). It was based on the daily summation of the difference between the potential SWD and a specified limiting value. Validation of the technique (for clone 6/8) suggested that there was a linear relationship between STI and relative yield loss during the warm dry season. As a result of changes in the composition of the shoot population at each harvest (the proportion of relatively fast growing shoots, sensitive to waters stress, to slow growing ones, less sensitive), the apparent critical deficit at which shoot growth was restricted increased from below 20 mm to 300 mm as the dry season progressed. The rate of yield loss with increasing STI also varied through the dry season for the same reason.
Following a detailed review of other attempts to model the growth of tea, including those by Tanton (Reference Tanton1981) and Cannell et al. (Reference Cannell, Harvey, Smith and Deans1990), Matthews and Stephens (Reference Matthews and Stephens1998a) described a model (known as CUPPA-Tea) that simulates the behaviour of a population of shoots, which develop and extend independently at different rates in response to variations in natural conditions, temperature, humidity and daylength. The model, which was developed with data from experiment N9 (clone 6/8), can be used to estimate the potential yield and seasonal distribution of yields under non-limiting conditions. Additional sub-models were included describing dry matter production and partitioning, and water uptake and use (Matthews and Stephens, Reference Matthews and Stephens1998b). Predicted yields matched observed yields well across a range of irrigation treatments, and for different years, at sites in Tanzania and Zimbabwe. To explain the occurrence of large yield peaks in September/October followed by progressively smaller peaks in well-fertilized, irrigated tea, Matthews and Stephens (Reference Matthews and Stephens1998c) found it necessary to include photoperiod as a variable (from 12.15 h, no bud dormancy, to 11.25 h, 100 % bud dormancy) through its effect on shoot activity, despite the lack of experimental evidence (Herd and Squire, Reference Herd and Squire1976) or limited evidence (Tanton, Reference Tanton1982).
The model has been used to evaluate different irrigation options at NTRS. It showed for example that annual yields (mature clone 6/8) only start to decline once the actual SWD exceeds about 140 mm. It also confirmed that irrigation water applied during the cool dry season could be as effective as water applied later during the warm dry season. With limited water storage facilities this is the most productive way of using water (Mathews and Stephens, Reference Mathews and Stephens1997). Similarly, the model has been used to predict potential yields (with and without water stress) at a range of contrasting sites (rainfall and altitude) in Tanzania, and to simulate the likely benefits (5–15%) to be achieved from mist irrigation in eastern Zimbabwe where dry air can be a constraint to yield (Martin et al., Reference Martin, Stephens, Wiedenfeld, Bittenbender, Beasley, Neibling, Gallian and Moore2007).
The model has also been validated at two sites in North East India (26°N; alt. 80–160 m), and used to simulate the effects of drought on yields of mature seedling tea and responses to irrigation (Panda et al., Reference Panda, Stephens and Matthews2003). At one site (clay loam soil) the mean yield loss due to drought was 1.5 kg ha−1 for each mm reduction in ETc, and at the second site (loamy sand) the corresponding figure was 2.2 kg (ha mm)−1. These were on observed annual yields of up to 4000 kg ha−1. The corresponding limiting SWDs were 240 and 85 mm respectively. The model was also used to predict the frequency distribution of annual yield increases from irrigation and the corresponding irrigation water use efficiencies (up to 2.7 kg (ha mm)−1).
Support for users together with further development of the model are needed to ensure that it is widely and successfully accessed and used.
IRRIGATION SYSTEMS
In those areas of Africa where tea is irrigated, semi-portable sprinkler irrigation systems are generally used. Poor design, excessively wide sprinkler spacings and the adverse effects of wind can lead to uneven water distribution and water wastage (Flowers, Reference Flowers1996). This has led to a commercial interest in drip irrigation as an alternative way of applying water to the crop. Möller and Weatherhead (Reference Möller and Weatherhead2007) evaluated in detail the technical and financial performance of the first commercial drip irrigation scheme (55 ha) in Njombe, southern Tanzania (Kibena Tea Ltd.; 9°12′S; alt. 1860 m; deep clay loam soil, Xanthic Ferrasol). They found that the uniformity of irrigation water distribution and efficiency (related to water losses) were all considerably better than those previously reported for adjacent sprinkler irrigated areas. Scheduling irrigation (on three/four day intervals) using tensiometers offered potential water savings of 26 % compared with the water balance approach conventionally used. Root systems became adapted to the spacing of the dripper lines (1.2 m, single row or 2.4 m apart, alternate rows). Gross margins were sensitive to the price and yield of processed tea, the amount and cost of fertilizer applied (fertigation was practised) and electricity costs. There were considerable savings in labour compared to sprinklers. Damage by rodents to the lateral pipes and to the emitters was a problem. Overall, drip irrigation was considered to be a technical success, although there were management problems, and maintenance was expensive.
In a supporting large-scale (9 ha) drip irrigation field experiment at the same site, Kigalu et al. (Reference Kigalu, Kimambo, Msite and Gembe2008) compared different levels of water application (0.25. 0.50, 0.75 and 1.00 times the cumulative SWD, one dripper line per row; together with 0.25 and 1.00 SWD, dripper line in alternate rows). Water was applied at three/four day intervals, over four successive dry seasons (2003/04 to 2006/07). Unfortunately, shortages of water in three of these years meant that irrigation was curtailed before the end of the dry weather. Annual yields for each of four clones were reported, and related to the depths of irrigation water applied. As presented, these results are not easy to explain or interpret, some of the curves suggesting that annual yields declined as the amount of water applied increased. The well-fertilized clones differed in their responses, with PC81 out-yielding BBT207, S15/10 and BBK35 in that order. On average, irrigating alternate rows resulted in yield reductions of about 10 %, on base yields of about 5000 kg ha−1, compared with irrigating every row. Until confirmed by further work, these results need to be treated with caution.
LIMITING FACTORS
Altitude, through its influence on temperature, can be an important controlling factor for the yield of tea. This is illustrated by the results of an analysis of a long-term (16 years) experiment, under constant management, at the headquarters of the TRFK, close to the equator, in Kericho (0° 22′S; alt. 2180 m) (Othieno et al., (Reference Othieno, Stephens and Carr1992). Yields were constrained by low mean air (15.5–18°C) and soil (17–19°C) temperatures, which can restrict shoot extension rates and extend the duration of the shoot replacement cycle (Carr and Stephens, Reference Carr, Stephens, Willson and Clifford1992; Squire et al., Reference Squire, Obaga and Othieno1993). As a result, the yield potential for seedling plants at this site was only about 2.0 t ha−1. The within-year yield distribution was sometimes limited by large potential SWDs (>120 and up to 400 mm), which restricted annual yields of made tea by about 1.3 kg (ha mm)−1, and by the incidence of damaging hail storms, which caused yield losses of 10 % of the annual yield. An analysis of commercial yields from 21 neighbouring estates over a 400 m altitude range (assuming an adiabatic lapse rate of 6 °C km−1) suggested a yield decline, below a base yield of about 4000 kg ha−1, of 200–300 kg ha−1 for every 100 m increase in altitude above about 1700 m, with yields declining more rapidly above about 2200 m (Carr and Stephens, Reference Carr, Stephens, Willson and Clifford1992). All these factors are important when attempting to extrapolate the results of experiments from one (unrepresentative) site to commercial practice. To aid this process, the climate at the TRFK has been characterized in terms of year-to-year variability, and probabilities of exceedance, in the key weather variables: temperature, solar radiation, humidity, wind, rainfall and evapotranspiration. Indices of water stress based on potential SWDs and the saturation deficit of the air have also been derived, as well as the duration of the shoot replacement cycle based on thermal time (Stephens et al., Reference Stephens, Othieno and Carr1992). Similar analyses are needed for all the major tea producing areas if the results of research and field experience are to be applied with confidence to different situations.
A relatively simple, hypothetical approach illustrates how actual yields from, say, a resource-poor farm can fall below potential yields. For example in southern Tanzania at an altitude of 1800 m, the yield potential (mature clone 6/8) is about 6000 kg ha−1. Drought reduces this by up to 1500 kg ha−1 (3 kg (ha mm)−1 × 500 mm (the effective SWD)); nitrogen deficiency reduces the net total (4500 kg ha−1) by a further 3000 kg ha−1 (10 kg ha−1 (kg N)−1 × 300 kg N ha−1); incomplete ground cover may reduce the new net total (1500 kg ha−1) by a further 20 % = 1200 kg ha−1, whilst poor harvesting may halve this total to 600 kg ha−1, a typical yield from a smallholding (Carr et al. Reference Carr, Ndamugoba, Burgess, Myinga, Ekpere, Rees, Mbwile and Lyimo1992).
GENERAL CONCLUSIONS
The research at NTRS described here on water productivity has contributed to the sustainability and profitability of the tea industry in eastern Africa in the following ways:
1. New target yields have been set for well-managed tea, currently in excess of 7000 kg ha−1 (location/temperature dependent).
2. Some of the more important cultivars have been evaluated in terms of their responses to drought and irrigation, and possible selection criteria identified.
3. Circumstances in which it may be justified to increase the plant population above the current recommended levels have been identified.
4. Yield responses to irrigation/drought have been quantified for immature and mature tea, and an explanation for the differences in response proposed.
5. Water productivity values can now be used to help to allocate water rationally and efficiently between tea cultivars, and between plants of different ages.
6. Opportunities to save water through deficit irrigation without a corresponding reduction in the annual yield have been identified.
7. Yield response curves to nitrogen fertilizer for rainfed and irrigated tea have been developed.
8. Practical ways of estimating the water use of tea, and for scheduling irrigation, have been developed and promoted.
9. Ways of scheduling harvest intervals to maximize crop productivity, using the concepts of thermal time and phyllochrons, have been developed.
10. ‘New’ ways of irrigating tea have been evaluated.
11. Progress has been made in integrating our knowledge of how tea responds to its environment through the development of simulation models for use in planning new projects, and for evaluating alternative strategies (both of value in the context of climate change and competition for declining water resources).
Progressive, well-resourced tea producers will continue to make use of this knowledge and refine it for their own individual business circumstances. Resource-poor tea farmers will need support to access and interpret the information now available that is relevant to their needs. This is currently the focus of the Tea Research Institute of Tanzania's Technology Transfer Programme. Tea scientists must though continue to plan ahead and anticipate the questions that tea producers will be asking in 20 years time. They are unlikely to be very different from those being asked 40 years ago, but the context will not be the same, and the answers will certainly be different. These are the continuing challenges for tea research.
Acknowledgements
Many people contributed to the research at the Ngwazi Tea Research Unit/Station summarized in this paper, at all levels. Most of them are cited in the references listed. Their commitment and support is gratefully recognized. I name three, all sadly no longer with us: the late Galus Myinga, Julio Lugusi and Badan Sanga. I thank Dr Paul Burgess and Dr David Nixon for providing the figures, and the two referees for their constructive comments. The tea industry in Tanzania and the UK Department for International Development funded the work at NTRU.