1. Introduction
What is the relationship between having an employer-sponsored pension plan (EPP) and the financial performance of non-workplace investments? Economic theory provides ambiguous predictions for this relationship. For example, belonging to an EPP can help workers overcome problems of procrastination or inertia, and prompt them to start thinking about their saving and financial prosperity earlier in life (Madrian and Shea, Reference Madrian and Shea2001; O'Neill, Reference O'Neill2007). This could, in turn, lead to greater efforts to improve financial literacy. Carroll et al. (Reference Carroll, Choi, Laibson, Madrian and Mertick2009) show that compelling individuals to make active decisions about saving increases wealth accumulation, especially when individuals are sufficiently financially literate to make informed decisions on their own. To the extent that EPP members are confident in their overall retirement prosperity, coverage may boost financial performance by permitting them to be more risk-taking, which could lead to greater relative returns on investments (RROIs) compared with non-members. However, investment portfolio choices, implicit suggestions or advice, and default options that are often associated with employer-sponsorship can reduce the costs and challenges of saving adequately and serve as a substitute for financial knowledge.
The goal of this paper is to assess the relationship between EPP coverage and investment performance to provide new empirical insight into these important issues. In particular, the paper makes two key contributions. First, using longitudinal administrative data on more than 345,000 tax filers from Canada, an approach for calculating RROIs across individuals is developed using data on the flows of funds into and out of a tax-preferred saving vehicle and the values of assets held in those accounts. Specifically, the analysis centers on the use of the tax-free savings account (TFSA), a plan that was introduced in the 2008 Canadian federal budget and that came into effect on January 1, 2009. Contributions to TFSAs are made on an after-tax basis but investment income accrues tax-free and withdrawals are not subject to tax. These plans are comparable with, for example, the Roth individual retirement account (IRA) in the United States except that TFSA account holders may withdraw at any time – not only in retirement – without penalty.
A unique administrative feature of these plans is that the Canada Revenue Agency (CRA) collects information not only on individuals’ annual contributions and withdrawals, but also on their asset balances as reported directly by the issuing financial institutions. Hence, information on flows of funds and wealth are jointly observed for TFSAs in the tax data. This breadth of information is not available in Canadian administrative data for any other taxable or tax-preferred saving vehicle. The results of this analysis indicate that individuals with equivalent saving histories have heterogeneous asset balances, and that such differences correlate with other covariates in a way that suggests the differences are not strictly random. For example, savers with higher RROIs tend to be older, to be female, and to have positive income from investments and capital gains.
The second contribution of this paper is to estimate the effect of EPP coverage on the RROI in a quasi-experimental design. Specifically, the analysis exploits variation in EPP participation rates across cohorts by sex and industry of employment – these variables being directly observed in the tax data since 2000 – as instrumental variables (IVs) for EPP coverage to credibly identify the effect of interest. This approach subsumes that participation rates vary exogenously from workers’ perspective due to changes over time in the supply of EPPs across industries and workforce compositions. The results of this analysis show that EPP coverage has a statistically significant, but economically modest, positive effect on investment performance, raising the average rate of return in other tax-preferred saving plans by approximately 0.50–1.25% over 5 years since the TFSA was introduced.Footnote 1
This paper relates to several interconnected literatures, the first of which is on the determinants of financial investment performance and its effect on saving. For example, several other studies that have looked at heterogeneity in the returns to wealth, such as use of sophisticated products for saving, include Curcuru et al. (Reference Curcuru, Heaton, Lucas, Moore, Ait-Sahalia and Hansen2005) and Campbell (Reference Campbell2006). More generally, there is a large literature in economics on the returns to wealth, largely motivated by the disproportionate growth of wealth at the top of the distribution in the United States over the past few decades. Earlier studies considered the roles of labor income and human capital in explaining the evolution of wealth distributions (Aiyagari, Reference Aiyagari1994; Huggett, Reference Huggett1996; Castaneda et al., Reference Castaneda, Díaz-Giménez and Ríos-Rull1998, Reference Castaneda, Díaz-Giménez and Ríos-Rull2003). More recent studies have focused on the effects of heterogeneous returns to financial and physical capital (Benhabib et al., Reference Benhabib, Bisin and Zhu2011; Benhabib and Bisin, Reference Benhabib and Bisin2016; Gabaix et al., Reference Gabaix, Lasry, Lions and Moll2016). While these models potentially explain the rapid changes in wealth inequality similar to those observed in the data, they require such assumptions as returns being persistent over time or correlated with wealth (Fagereng et al., Reference Fagereng, Guiso, Malacrino and Pistaferri2016). This raises the question of to what extent returns to wealth are systematic in practice. For example, using data from the Health and Retirement Survey in the United States, Venti and Wise (Reference Venti and Wise1998) show that there is substantial variation in wealth even after controlling for lifetime earned income and personal circumstances, and highlight that choice (i.e., different tastes for saving) and chance both impact wealth accumulation. However, directly addressing this issue is often confounded by such problems as measurement error and low response rates in survey data (Fagereng et al., Reference Fagereng, Guiso, Malacrino and Pistaferri2016). This paper provides novel new insight into this issue using administrative income tax data from Canada.
Second, this paper relates to the literature in public finance on the effects of EPPs on private saving outcomes. This research predominantly estimates the extent to which employer pension contributions crowd out saving in other taxable and tax-preferred accounts (Engen et al., Reference Engen, Gale and Scholz1994, Reference Engen, Gale and Scholz1996; Poterba et al., Reference Poterba, Venti, Wise and Wise1994, Reference Poterba, Venti and Wise1995; Alessie et al., Reference Alessie, Kapteyn and Klijn1997; Engen and Gale, Reference Engen and Gale2000; Euwals, Reference Euwals2000; Benjamin, Reference Benjamin2003; Engelhardt and Kumar, Reference Engelhardt and Kumar2011; Beshears et al., Reference Beshears, Choi, Laibson and Madrian2014; Chetty et al., Reference Chetty, Friedman, Leth-Petersen, Nielsen and Olsen2014; Messacar, Reference Messacar2015, Reference Messacar2017a). As Bernheim (Reference Bernheim, Auerbach and Feldstein2002) explains, the findings from this work are controversial and mixed for several reasons, including lack of reliable data and credible estimation strategies. This is the first known study to consider the effect of EPPs on saving returns, rather than savings rates.
This paper is organized as follows. The next section summarizes key features of the institutional setting to provide context for the analysis. Then, the dataset and sample selection are described. Section 4 reviews the methodology for calculating the RROI from flow-of-funds and asset data from TFSAs. Section 5 presents the empirical results of the effect of EPPs on financial competence. Lastly, the paper concludes.
2. Institutional setting
There are three common vehicles with tax advantage available to Canadian tax filers. First, the registered pension plan (RPP) is an employer-sponsored plan, which can be a defined benefit, defined contribution, or hybrid arrangement. The employee's share of contributions to these plans is tax-deductible and the employer's share is non-taxable. In the T1 administrative data, total RPP saving is observed indirectly through a variable called the Pension Adjustment (PA). For defined contribution plans, the PA is simply the sum of employer and employee contributions made in the reference year. For defined benefit plans, the PA converts the pension benefit accrued over the past year of service into a present value amount using standard actuarial assumptions. Since the PA is reported directly to employees each year, it provides them with a transparent and easy-to-understand method of knowing roughly how much they saved in an EPP over the past year.Footnote 2
Second, the registered retirement savings plan (RRSP) is a defined contribution plan, which individuals set up and maintain through financial institutions. These plans offer front-loaded incentives to save, as contributions are tax-deductible and income is taxed at the time of withdrawing. While an RRSP encourages saving for retirement in the form of a tax deduction, there is no penalty on withdrawing funds from an RRSP at any time. This differs from comparable plans in other countries, such as the IRA, which imposes a direct penalty of 10% on withdrawals made by account holders under the age of 59.5. As Mawani and Paquette (Reference Mawani and Paquette2011) show, the RRSP is often used for precautionary saving income-smoothing purposes.
Third, the TFSA was introduced in the 2008 Canadian federal budget and came into effect January 1, 2009. Similar to the Roth IRA in the United States, the TFSA offers a back-loaded incentive to save, as contributions are made with after-tax income but the investment income accrues tax-free and income withdrawn is not subject to tax. As such, this income does not crowd out eligibility or benefit amounts for public pensions, such as the Old Age Security. Messacar (Reference Messacar2017b) shows that both the RRSP and TFSA are widely used saving vehicles by Canadian tax filers, but that short-term – non-retirement – saving is likely more prevalent within the TFSA as evidenced by the higher propensity to withdraw funds after only a few years. As discussed earlier, a unique feature of the TFSA is that financial institutions directly report the value of contributions, withdrawals, and asset balances annually to the CRA, the latter of which is based on an assessment of fair market value (FMV). This provides a unique opportunity to observe both flow-of-funds and wealth information, which is not possible for any other saving plan without relying on household surveys.
3. Data and sample selection
This study is based on an analysis of Statistics Canada's Longitudinal Administrative Databank (LAD), spanning the years 2000 to 2013. The LAD is a panel file comprising a 20% sample of personal income tax records submitted annually to the CRA. The data provide a wide array of variables related to demographics, income, taxes and transfers, and saving in tax-preferred (registered) accounts. In addition, the dataset is augmented annually to ensure accurate cross-sectional representation.
Of particular importance to this study is the fact that the LAD contains detailed information about TFSA use – annual contributions, withdrawals, and FMV of total assets held in the accounts as of December 31st of the reference year. The FMV is defined as ‘the dollar amount that may reasonably be expected to be exchanged between a willing buyer and a willing seller for a property’ (Statistics Canada, 2015: p. 149). This value is reported directly to CRA by financial institutions, which means it is independent of tax filers’ personal assessments of their financial situations, investment performance, and well-being.
The following sample restrictions are imposed. First, the time period is limited to the tax years 2000–2013 inclusive. This spans the earliest year for which data on the worker's industry of employment – of particular importance for the empirical analysis – is available, up to the last year of data availability at the time this research began. Second, because the RROI is inferred from TFSA contribution and withdrawal histories and asset balances, the sample only includes tax filers who are observed using this saving vehicle at least once. Third, tax filers must have been at least 25 years old in 2000 and <55 years old in 2013 so that the analysis centers on tax filers who were old enough to be employed but (typically) under the age of early retirement. Fourth, tax filers must be observed in every year, and observed to be employed in every year from 2000 to 2008; the focus on employed tax filers permits the assessment of how EPP coverage affects the RROI, and restricting to a balanced panel ensures that inter-temporal comparisons of results are not affected by attrition. These issues are discussed in more detail later in the paper. Approximately 90% of observations satisfy this requirement, hence the final sample is quite representative of all TFSA users.
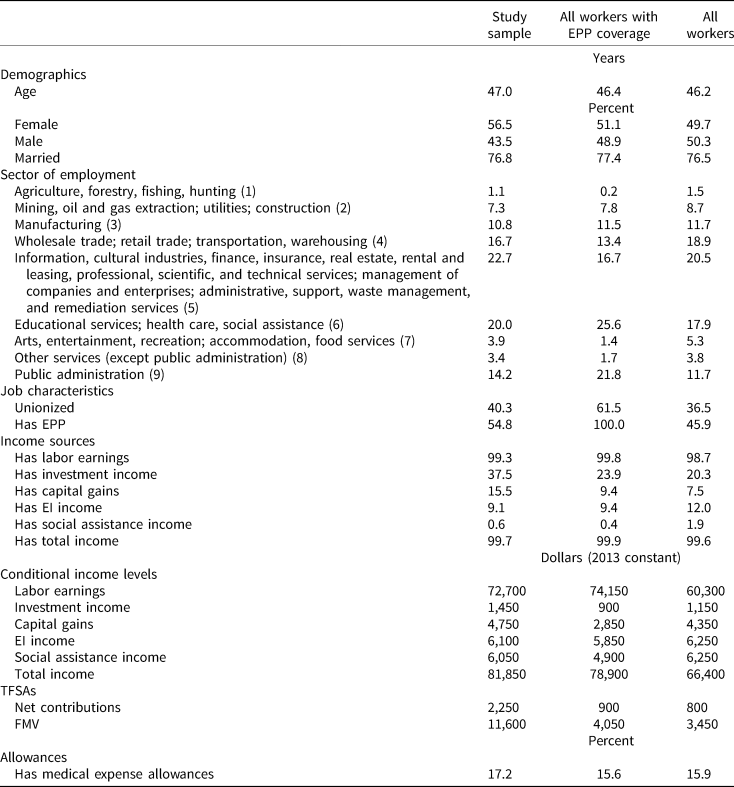
Taken together, this study analyzes saving outcomes for more than 345,000 tax filers. Table 1 presents descriptive statistics for the sample. Tax filers are around 47 years old, on average, of whom 56% are female and 44% are male, 77% are married or in common-law relationships, 40% are unionized, and 55% belong to an EPP.
Descriptive statistics

Notes: EPP = ‘employer-sponsored pension plan’. The demographic for ‘married’ includes those who are both legally married and in common-law relationships. The numbers in brackets for each industry of employment are the corresponding one-digit North American Industrial Classification System (NAICS) codes. Having an EPP is defined as having a positive PA in the reference year. The ‘conditional’ income statistics are conditional on these values being positive. Total income refers to the CRA definition of income before taxes, defined in Statistics Canada (2015). The income values are rounded to the nearest $50.
Source: Statistics Canada, Longitudinal Administrative Databank.
Because the sample is restricted to individuals who used a TFSA at least once, income levels are fairly high. For example, the average value of labor earnings in 2013 was $72,700. Further, approximately 38% and 16% of individuals in this sample have investment income and capital gains, respectively, whereas less than 1% receive social assistance income. Thus, the sample restrictions tend to center the analysis on tax filers who are relatively affluent. For example, the table also shows that average total income among this study's sample is $81,850 in 2013, compared with an average of only $66,400 in the population. Despite the income differences, however, the sample is well-balanced across demographic characteristics such as age, marital status, industry of employment, union status, and (to a slightly lesser extent) EPP coverage. Due to the selection criteria imposed, this study's sample has comparatively high net contributions to, and asset balances in, TFSAs compared with the full population. Given that the empirical analysis exploits variation in EPP coverage rates, the table also performs a balancing test between this study's sample and all EPP members. In this case, demographic and income characteristics are fairly similar except that this study's sample has relatively high investment income and capital gains; the most notable difference in this case is the unionization rate, which is simply the result of EPP members being more likely to be unionized. The extent to which the results of this study generalize to a wider population is left to future research; nevertheless, this study is among the first to consider the relationship between EPPs, returns on investments, and retirement saving, as well as to propose a novel empirical approach to that end.
4. Calculating the RROI
The RROI in non-workplace saving is based on an analysis of the administrative data for TFSA flows of funds and asset values. Specifically, the 2013 TFSA FMV of each tax filer is compared with the average FMV of all tax filers who had identical contribution and withdrawal histories from the inception of this saving vehicle. Denote by A it, C it, and W it the total FMV of assets, the total value of contributions, and the total value of withdrawals from individual i in year t, aggregated over all TFSA accounts held. The statistical model estimated is:
 $$A_{i,2013} = \alpha + \mathop \sum \limits_{t = 2009}^{2013} \lcub {\beta^tC_{it}-\delta^tW_{it}} \rcub + \theta _{i,2013}$$
The estimates  $\hat{\beta} ^t$ and
 $\hat{\delta} ^t$ (the caret denotes an estimated value) in equation (1) reflect the average effects of each $1 contributed to and withdrawn from a TFSA in year t, respectively, on the FMV of assets in the terminal year within the sample. Two features of this approach are important to note. First, the effect of each $1 saved is permitted to vary by year, which is especially relevant because the TFSA was introduced around the time of the global economic recession of 2008–2009. Second, the method does not impose any assumptions about the average population-wide rate of return, instead using a flexible parametric approach.
To obtain a measure of relative financial performance, the (standard normalized) residual from equation (1) is calculated, as follows:
 $$\Theta _{i,2013}\equiv \displaystyle{{{\hat{\hskip-3pt \theta}} _{i,2013}-E\lsqb {\hskip3pt{\hat{\hskip-3pt \theta}}_{i,2013}} \rsqb } \over {\sqrt {{\rm Var}\lsqb {\hskip3pt {\hat{\hskip-3pt \theta}}_{i,2013}} \rsqb }}} $$
Hence, Θi,2013 is an individual-specific relative performance measure that – by construction – is not explained by contribution and withdrawal histories. Note that  $\hskip3pt \hat{\hskip-3pt \theta} _{i,2013}$ is truncated at the 0.1 and 99.9 percentiles to control for outlier observations from the prediction regression, although the choice of truncation thresholds has no bearing on the results of this study. There are four main factors that likely explain differences in the RROI across individuals: (1) differences in the assessment of FMV across institutions; (2) idiosyncratic variation in the returns to wealth; (3) differences in investors’ financial competence; and (4) differences in investors’ risk-taking behavior. Formally, this can be modeled as Θit ≡ f(X it, Z it, ε it), where X it, Z it, and ε it are observed, unobserved, and idiosyncratic variables, respectively. The issue of variation in financial institutions’ assessments is safely ignored in this scenario given that the Canadian financial sector is mostly comprised of a small number of large institutions – which are in good positions to assess the values of assets – compared with other countries.
Financial competence refers to the extent to which individuals’ financial choices align with those they would make if they properly understood their opportunity sets (Ambuehl et al., Reference Ambuehl, Bernheim and Lusardi2014: p. 1). This can include knowledge of optimal strategies (e.g., diversification) and sophisticated products for saving. The TFSA permits savers to hold a wide range of investments in these accounts, including cash, guaranteed investment certificates, bonds, stocks, and mutual funds. Use of financial advice and planners can also affect the relative performance of investments, although the extent to which advice is a substitute for financial knowledge and literacy is not always clear. Several studies find that the two are complements (United States Government Accountability Office [GAO] 2011; Collins, Reference Collins2012), perhaps because advice without knowledge can lead to over-investments in products managed by the advisers. Risk preferences directly affect relative performance to the extent that the average rate of return on investments increases with the level of risk.
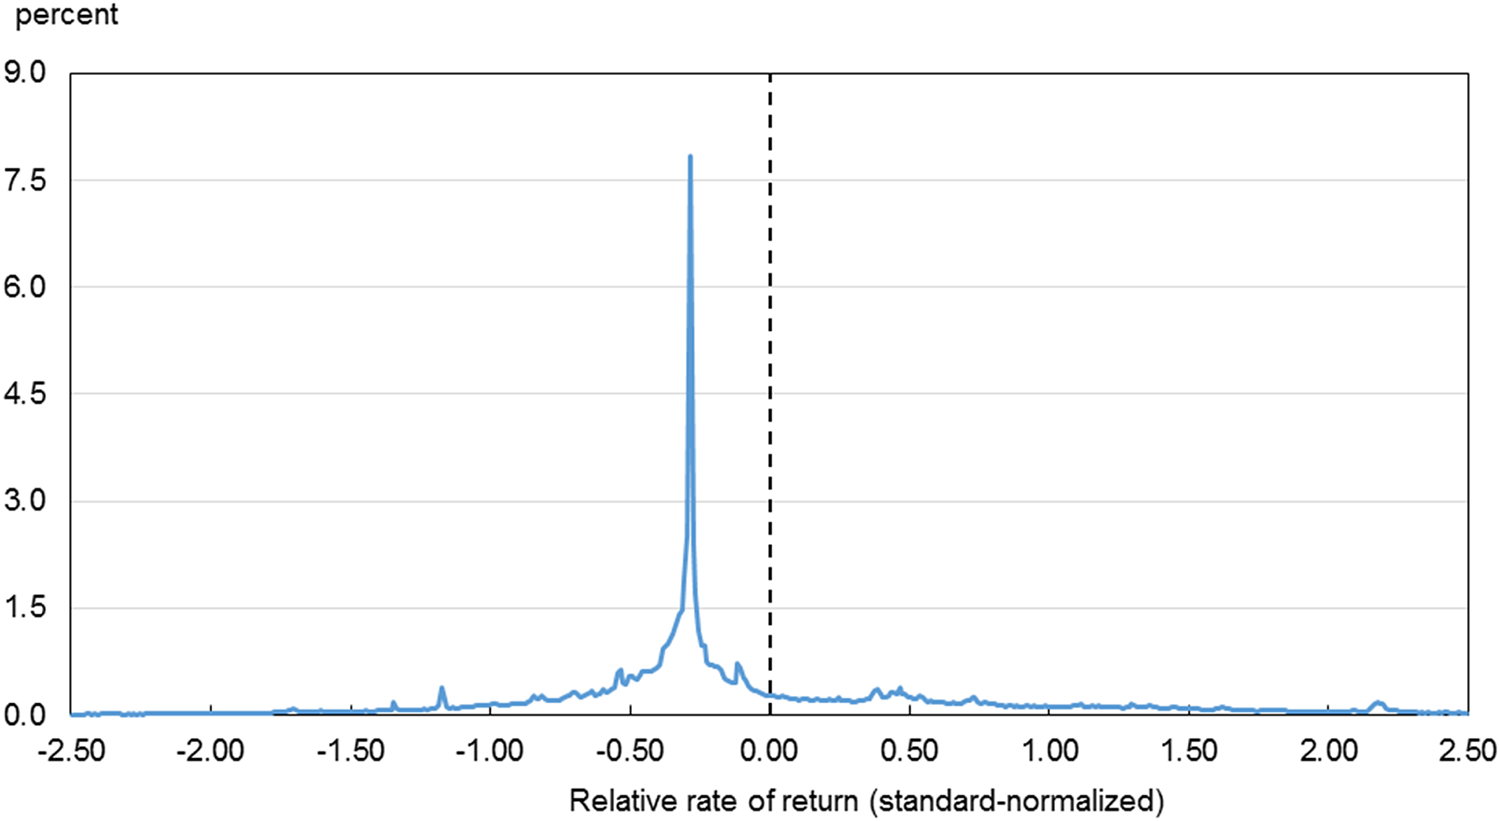
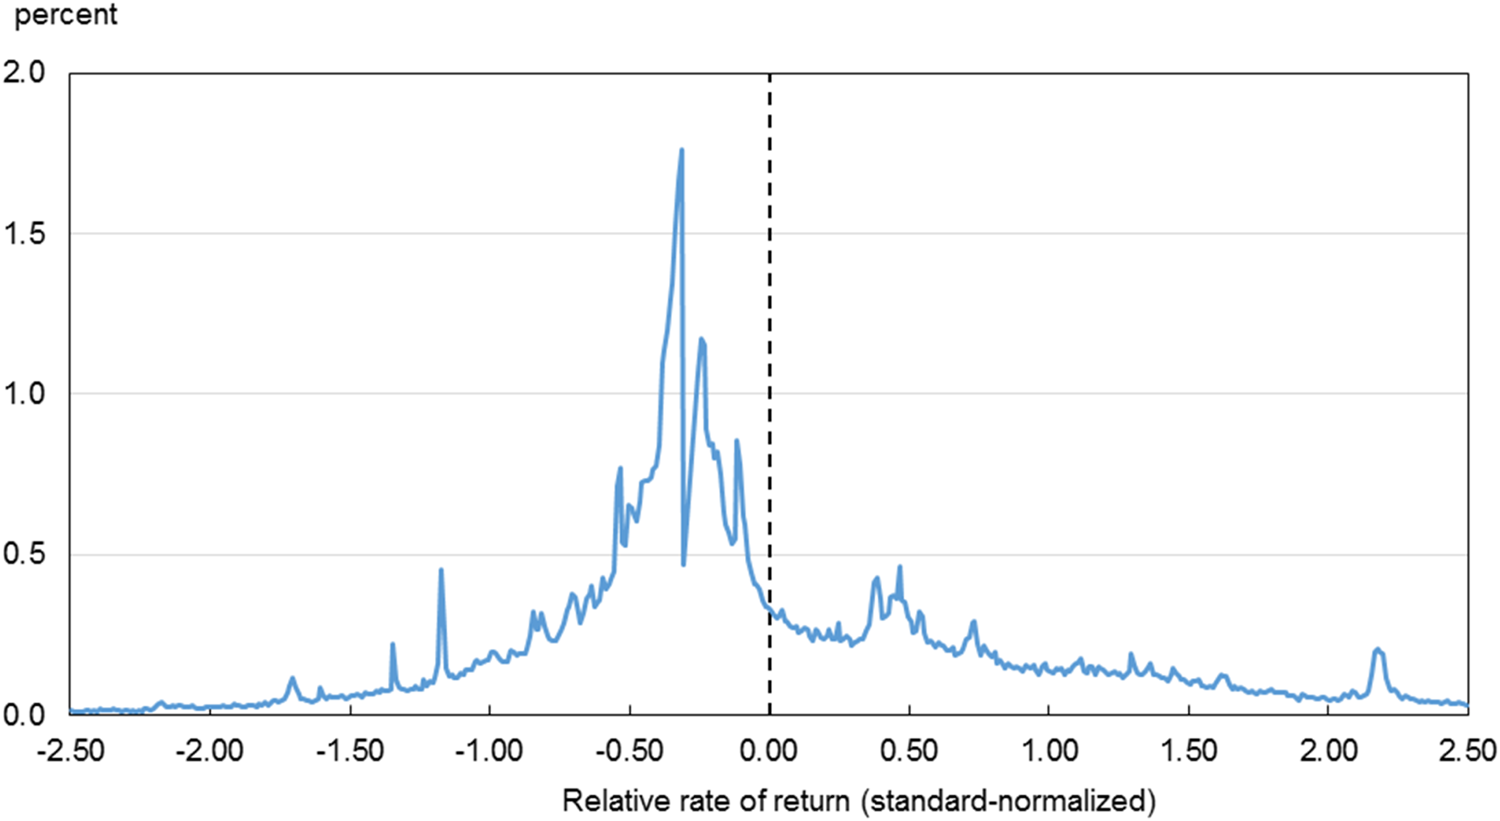
Chart 1 plots the distribution of Θi,2013 over a domain of five standard deviations. This analysis has two distinguishing features. First, there is a spike in the distribution where a small fraction of the sample – approximately 8% – has asset values that are about equal to the sum of contributions minus withdrawals. For robustness, the analysis will consider how the main results of this study vary with the exclusion of those savers. Second, there is significant heterogeneity for the remainder of savers.
Distribution of the relative rate of return.

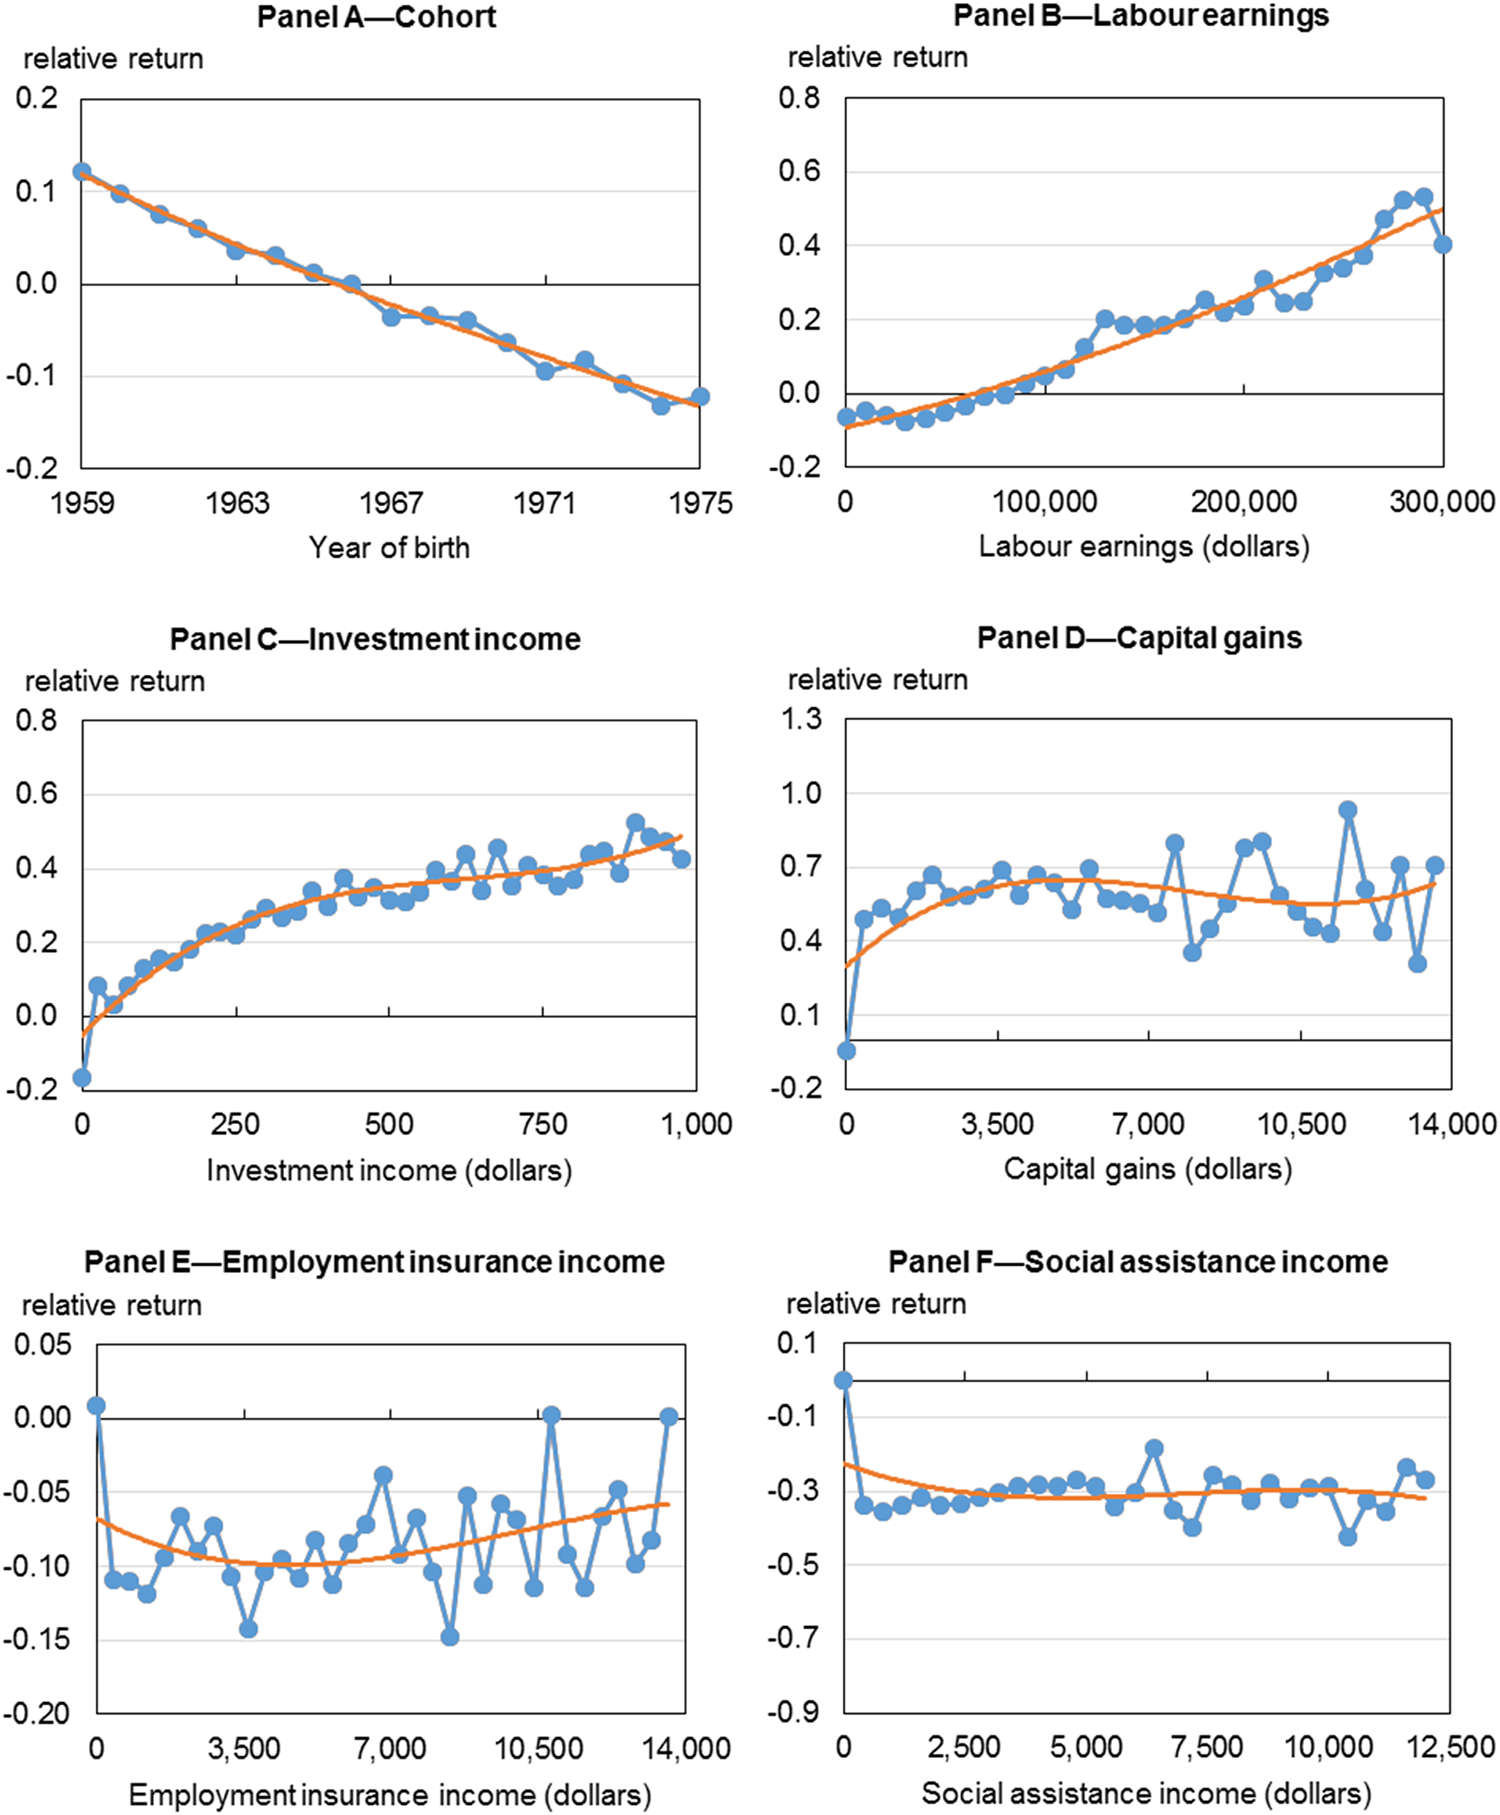
To explore how other factors affect Θi,2013, Chart 2 plots the average value of the RROI across age group (by year of birth) and various measures of income. This analysis indicates that the RROI increases with age, labor earnings and investment income, and is higher for those with capital gains than for those without capital gains. In contrast, the RROI is lower for those with Employment Insurance (EI) and social assistance incomes than for those without these sources of income, hence individuals in financial need appear to under-succeed in their investments.
Effects of age and income on the relative rate of return.

A limitation of this analysis is that it is not possible to separately identify the importance of various determinants of the RROI. In particular, financial competence and risk-preferences jointly affect the RROI but cannot be separately discerned. While the tax data provide detailed information on tax filers’ total contributions to, withdrawals from, and assets held in TFSAs each year given that this information is reported to the central tax authority, specific details about the tax filers’ stock market participation, investment choices or portfolio shares are unobserved. The empirical analysis will control directly for tax filers’ levels of investment income and capital gains in order to absorb differences across individuals in portfolio characteristics outside of TFSAs and overall stock market participation. However, a direct inspection of the effects of EPPs on risk-taking behavior versus financial competence is outside the scope of this study and represents a promising topic for future research.
5. Effects of EPPs on the RROI
This section presents results of the investigation into how the RROI depends on EPP coverage. As stated earlier, the theory provides an ambiguous prediction of how this relationship should look. For example, employer-sponsorship may be a substitute for financial competence to the extent that suggestions, advice, defaults, and other ‘nudge’ mechanisms implicit in many EPPs result in workers using other financial services less and not investing in their own financial knowledge adequately. However, EPPs may to some extent complement financial knowledge to the extent that these programs prompt workers to start thinking about their retirement saving earlier in life, recognize the benefits of saving, and otherwise plan for the future. Workers who know they have reliable EPPs might be more inclined to take on riskier investments, in turn affecting their relative investment performance.
The statistical model estimates how – for different values of t – pension coverage, EPPit, for individual i in year t affects the RROI, Θi,2013. The regression equation is:
 $$\Theta _{i,2013} = \omega + \pi {\rm EP}{\rm P}_{it} + X_{i,2013}^{\prime} \gamma + \mu _{i,2013}$$
where EPPit is an indicator of pension coverage (which takes the value of ‘1’ if yes, and ‘0’ otherwise), X i,2013 is a vector of observed covariates and μ i,2013 is the error term. Since Θi,2013 is computed based on the value of assets in 2013, the covariates are based on those observed in the same year. This vector comprises: cohort fixed effects, sex, marital status, province of residence, earnings, union status, industry of employment (based on the North American Industrial Classification System [NAICS] at the two-digit level), investment income, capital gains, EI income, social assistance, total income, and medical expense allowances. The parameter of interest, π, is the effect of EPP coverage on the RROI; the model will give  $\hat{\pi} \lt 0$ if the two are substitutes and
 $\hat{\pi} \gt 0$ if they are complements.
5.1 Identification strategies
Estimating equation (3) by Ordinary least square (OLS) is confounded by the possibility that workers sort into firms with EPP coverage based on their underlying preferences for saving (Ippolito, Reference Ippolito1997). For example, workers who desire not investing in financial knowledge – and, as a result, are more likely to yield low returns on their investments – but who value their future retirement prosperity will be more inclined to obtain an EPP, resulting in downward bias of the OLS estimator  $(\hat{\pi} \lt \pi )$. Two methods are employed to overcome this issue: (1) exploit the balanced panel nature of the data; and (2) use an IV for EPP coverage.
The longitudinal feature of the data is exploited using an indicator of whether each worker had EPP coverage at a specific time in the past. This approach addresses the issue of endogeneity by analyzing the model in a dynamic context and inferring causality from the order of operation. Given that the TFSA was introduced in 2009, the indicator of pension coverage used is from 2008 or earlier. Specifically, equation (3) is estimated several times, each using a separate indicator of pension coverage from several years from 2000 to 2008, i.e., t ∈ {2000, 2004, 2008}. The earliest year is set to 2000 because this corresponds to the first year in which data on the industry of employment – based on the NAICS code – is available. Repeating the analysis for the other years between 2000 and 2008 yields comparable results, and is not shown for compactness.
A limitation of this approach is that it does not resolve individual-specific effects that may bias the estimator but that are time-invariant. The analysis employs an IV approach to resolve this issue, exploiting differences in the availability of EPPs across cohorts by sex and industry of employment. As Morissette and Drolet (Reference Morissette and Drolet2001) show, the share of workers covered by EPPs in Canada has changed over the last several decades, and these trends are starkly different for men and women. Individuals from different cohorts, sexes and industries did not all face similar likelihoods of belonging to an EPP in the workplace – through no control of their own – because, to some extent, coverage of these provisions is set by employers. Many firms in Canada and other countries have moved away from supplying these benefits to reduce operating costs not only in response to changing demographics, but also pressures from international competition in the wake of globalization, which vary by industry. The first-stage regression for this cohort-level analysis exploits such variation in a first-stage regression, as follows:
 $${\rm EP}{\rm P}_{it} = \upsilon + \lcub {{\rm SEX} \times {\rm INDUSTRY} \times {\rm COHORT}} \rcub _{it}^{\prime} \lambda + X_{i,2013}^{\prime} \phi + \xi _{it}$$
where {SEX × INDUSTRY × COHORT}it is a vector of variables, which represent a cohort running variable (which is continuous by year of birth), but interacted with a set of variables indicating each sex-by-industry group.Footnote 3 The vector of covariates, X i,2013, are the same as those defined above, such that the fixed effects for sex, cohort and industry of employment in 2013 continue to be included directly in both the first-stage and second-stage regressions. In contrast, the industry variable used to construct the excluded instruments are from the year t ∈ {2000, 2004, 2008} on the basis that the incidence of being covered by an EPP in a given year is a function of the industry of employment in that same year.
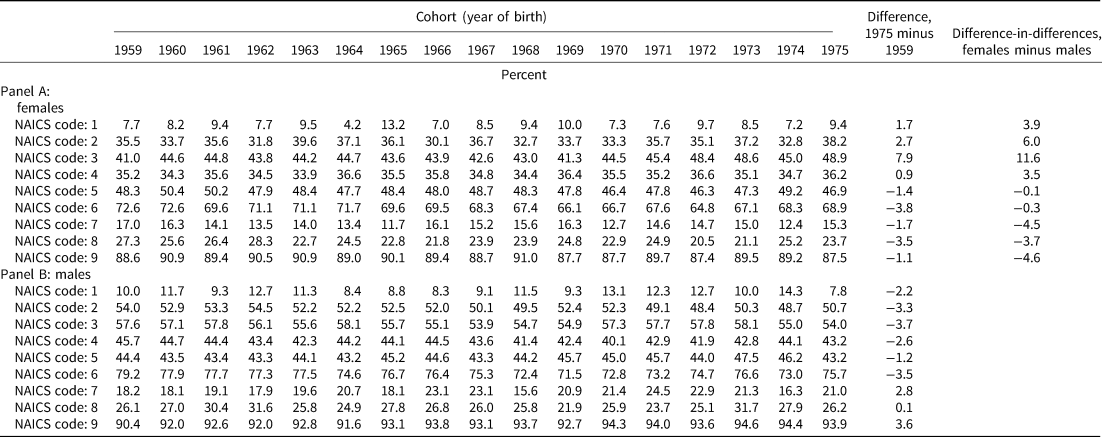
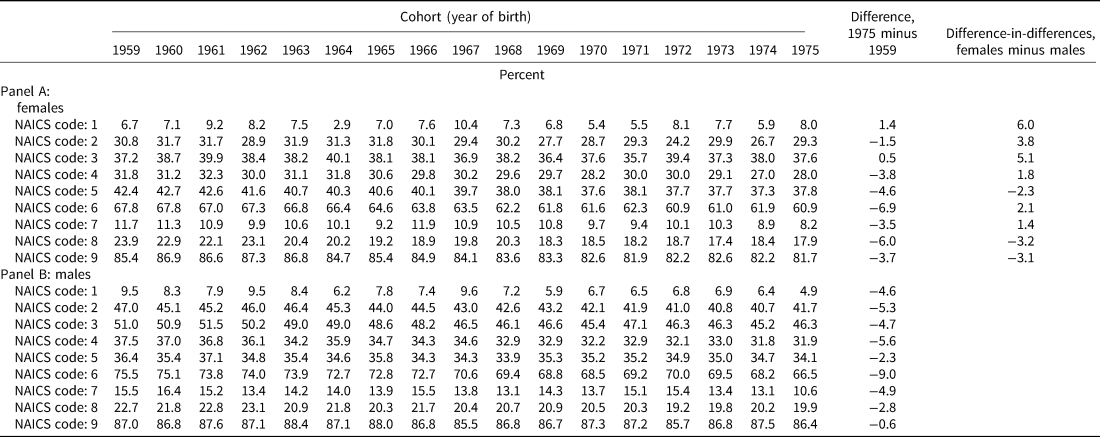
The parameter vector λ is well-identified in part from this lagged industry variable. Note that the results of this analysis are robust to using cohort fixed effects instead of a cohort running variable; the latter approach was ultimately chosen because permitting the cohort variable to be continuous lends itself to an inspection of the instruments’ validity. To this end, Table A1 in Appendix A shows the share of the workforce covered by an EPP across cohorts, by (lagged) industry and sex. For both men and women, there is substantial heterogeneity in the likelihood of having a pension across industries and time. As expected, some industries – such as public administration, education services, health care, and social assistance – tend to have high coverage rates, which likely arises from these industries also being highly unionized. In contrast, agriculture has the lowest incidence of EPP coverage for both sexes. The table also shows the change in EPP coverage over time, as well as the difference between men and women in this change over time (i.e., the ‘difference-in-differences’ in EPP coverage). In industries that initially had the largest gaps in coverage (e.g., mining, quarrying, oil and gas extraction, utilities, construction, and manufacturing), women experienced the largest increases in coverage relative to men. On balance, the disparity in EPP coverage between men and women appears to be diminishing across cohorts. To the extent that these trends are driven by factors independent of each individual worker's preference for having pension coverage, and is instead a function of supply side factors, then equation (4) is a valid first-stage regression for estimating the effect of EPPs on the RROI. (Since this analysis is restricted to TFSA users, the trends for these workers may differ from population-wide trends. As shown in Table A2, this does not appear to be the case.)
It is important to note that the identification strategy proposed may be confounded by such factors as men and women moving into industries that are more likely to offer pensions at different rates. To address this possibility, the analysis was also repeated using a variant of equation (4) that identifies solely off of variation in the incidence of workplace pension coverage across cohorts and lagged industries of employment. The results using this approach were very similar to the ones presented, below. This suggests the identification strategy is exploiting the exogenous, supply side driven variation in lagged workplace pension coverage, as intended, and is not significantly confounded by changes in workers’ underlying preferences for workplace pension coverage.
5.2 Results
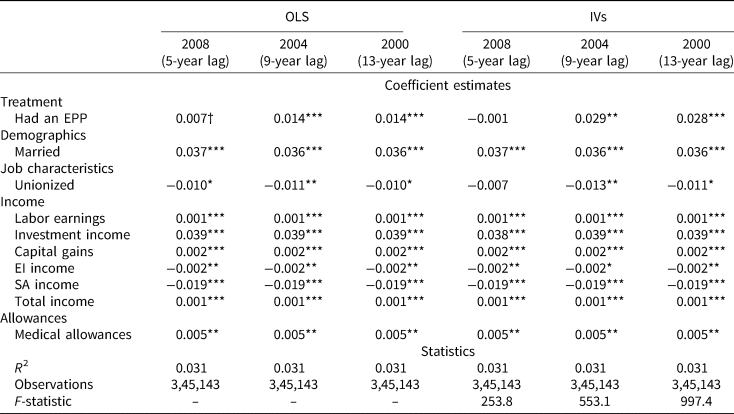
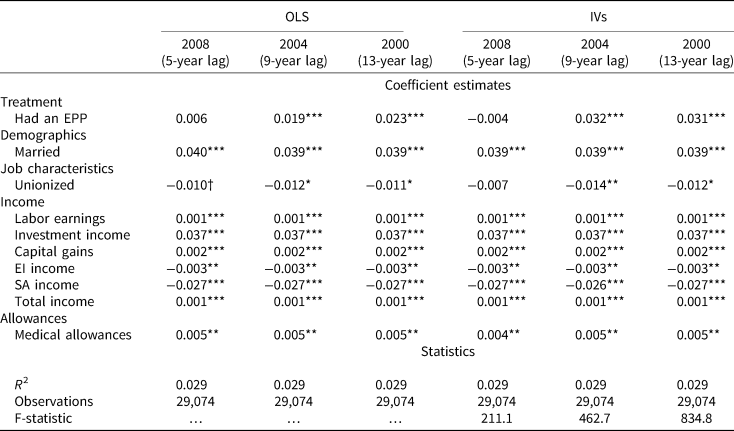
The results of the OLS estimates of equation (3) are shown in Table 2. The analysis is repeated several times using indicators of EPP coverage from 2008 – corresponding to a 5 year lag relative to the year in which the RROI was constructed, in 2013 – and dating back to 2000 – a 13 year lag. The predicted ‘treatment effect’ in the first row of data is the effect of interest,  $\hat{\hskip-3pt \pi} $. Standard errors are clustered by individual to control for heteroskedasticity in the errors. Statistical inferences are nearly identical to clustering by sex, cohort, and lagged industry – this being the level of variation used in the identification. The individual-specific clustering ‘nests’ the sex-cohort-lagged industry level clustering, hence results are reported using the former approach.
Estimated effects of EPP coverage

***Significantly different from reference category (p < 0.001).
**Significantly different from reference category (p < 0.01).
*Significantly different from reference category (p < 0.05).
†Significantly different from reference category (p < 0.10).
Notes: EPP = ‘employer-sponsored pension plan’; EI = ‘employment insurance’; SA = ‘social assistance’. Total income refers to the CRA definition of income before taxes, defined in Statistics Canada (2015). The effect of EPP coverage on the relative rate of return is based on results from both the OLS and IV estimators, along with the coefficient estimates for selected covariates (the others listed in the text are included in the model, but not reported for compactness). The treatment effect is identified in the IV regressions by exploiting the differential trends in EPP eligibility across cohorts, by sex and industry of employment. Standard errors are clustered by individual. The F-statistic of the excluded instrument is reported for the IV regressions.
Source: Statistics Canada, Longitudinal Administrative Databank.
These findings indicate, first, that having EPP coverage leads to a higher RROI, indicated by the sign and significance of the treatment effect. On balance, EPP coverage leads to a 0.012 standard deviation increase in the RROI based on an average of the estimates across all columns. The magnitude of this effect, however, is modest. Note that the standard deviation of the (unstandardized) RROI is approximately $4,950, hence EPP coverage results in a monetary gain of approximately $60. The average FMV in is nearly $11,600, which means that EPP coverage boosts the rate of return by around 0.51% over five years since the TFSA was introduced.
The second finding is that the estimated treatment increases with the lag. That is, having EPP coverage earlier raises the RROI to a greater extent. For those who had a pension 8 or 13 years prior, the implied increase in the rate of return is 0.60%, while having coverage 5 years prior is associated with only a 0.30% implied rate of return. Third, the effects of the reported covariates are consistent with expectations, which provide additional support to the validity of the return on investment measure. In particular, the RROI increases with labor earnings, investment income, capital gains, and total income, but tends to decrease with EI and social assistance income. This is consistent with the inspection of these relationships shown in Chart 2, discussed earlier.
To address concerns that the dynamic OLS estimator does not resolve issues of endogeneity resulting from time-invariant unobserved factors, Table 2 also reports the results of the IV analysis from equation (3). The analysis exploits differences in EPP eligibility across cohorts by sex and industry. Despite augmenting the analysis in this manner, the results are qualitatively similar to the findings obtained from the OLS estimator notwithstanding the fact that the treatment effect is insignificantly different from zero for the first few lags. The average of the effect of EPPs across all columns is 0.019 in this case, which corresponds to an implied gain in the RROI of approximately 0.81%, and the maximum premium is 1.24%. Moreover, the predicted effects of the covariates are nearly identical in the OLS and IV regressions. The F-statistics from the tests of excluded instruments suggest that the cohort-level analysis performs well in explaining variation in EPP coverage across groups.Footnote 4
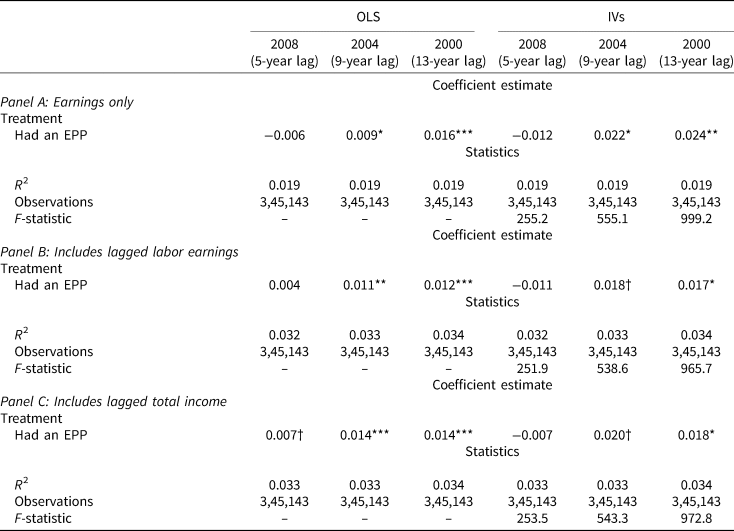
Taken together, EPP coverage appears to boost the RROI, by as much as approximately 0.50–1.25%, over the long-term, i.e., spanning 5 years since the TFSA was introduced. To assess the robustness of these results, Table 3 presents estimation results from three variants of the baseline OLS and IV analyses. In particular, panel A implements the model excluding all sources of income except for labor earnings given that investment income and capital gains are likely correlated with TFSA use. Panels B and C estimate the model including a sequence of lagged variables for labor earnings and total income, respectively, where the number of lags in these variables is equal to the lag used in the identification in each case. In doing so, the effect of EPP coverage on the RROI is obtained conditional on histories of labor earnings or total income received by workers over the relevant time period. The results from these robustness checks are all consistent with the baseline findings. While controlling for histories of labor earnings or total income tends to dampen the effect slightly, the fact that EPP coverage increases the RROI by a statistically significant but economically modest amount remains unchanged. Table A3 of Appendix A shows that the baseline results are very similar excluding the mass of individuals with RROIs close to the mode; the distribution of the RROI in this case is presented in Chart A1.
Robustness checks of the estimated effects of EPP coverage

***Significantly different from reference category (p < 0.001).
**Significantly different from reference category (p < 0.01).
*Significantly different from reference category (p < 0.05).
†Significantly different from reference category (p < 0.10).
Notes: EPP = ‘employer-sponsored pension plan’; EI = ‘employment insurance’; SA = ‘social assistance’. Panel A implements the model excluding the variables for investment income, capital gains, EI income, SA income, and total income. Total income refers to the CRA definition of income before taxes, defined in Statistics Canada (2015). Panels B and C implement the model controlling for lagged labor earnings and total income, respectively, where the number of variable lags is equal to the number of lags used in the identification. The effect of EPP coverage on the relative rate of return is based on results from both the OLS and IV estimators, along with the coefficient estimates for selected covariates (the others listed in the text are included in the model, but not reported for compactness). The treatment effect is identified in the IV regressions by exploiting the differential trends in EPP eligibility across cohorts, by sex and industry of employment. Standard errors are clustered by individual.
Source: Statistics Canada, Longitudinal Administrative Databank.
6. Conclusion
This paper provides new insight into the relationship between EPP coverage and investment performance in a non-workplace tax-preferred saving account. In particular, using administrative data on more than 345,000 tax filers from Canada, the paper makes two key contributions. First, a method was proposed for inferring the RROI based on an analysis of returns to wealth data across individuals with identical saving histories. The results of this analysis show that there is substantial heterogeneity in investment performance across individuals. Second, having an EPP at some time in the past was found to raise performance in non-workplace saving by approximately 0.50–1.25% over 5 years since the TFSA was introduced, which could arise because: (1) EPPs serve as a complement to financial knowledge by prompting individuals to start thinking about saving earlier in life, or (2) having EPPs allows individuals to invest in riskier assets, which might have higher expected returns. The findings are robust to augmenting the analysis using an IV approach that exploits variation in the availability of EPPs across cohorts by sex and industry of employment in the identification. It is important to note, however, that this result is based on an analysis of returns on investments within TFSAs, which may be a ‘marginal’ saving vehicle for some workers. Given that the TFSA was recently introduced, in 2009, and that contribution limits to these plans were only around $5,000 per year over the relevant period of analysis, it could be that TFSAs are used for last dollars of saving and that RROIs differ systematically than for the first dollars saved. For example, TFSAs may attract higher-risk investments. To some extent, this issue is mitigated by conditioning the analysis only on TFSA users and expressing returns on investments as a relative measure, but it may also be the case that the RROI estimated herein is an upper bound on the RROI on all saving. The extent to which the results of this study generalize to returns on a broad portfolio of investments remains an important topic for future research.
Taken together, the findings suggest that the gradual decline in EPP coverage in some industries over the past several decades could have led to a corresponding decline in non-workplace risk-taking or investment performance and, as a result, may have even contributed to the aggregate decline in private savings rates. The extent to which new policies and programs that ‘nudge’ individuals in the direction of saving more (Madrian and Shea, Reference Madrian and Shea2001; Choi et al., Reference Choi, Laibson, Madrian and Mertick2003; Bernheim et al., Reference Bernheim, Fradkin and Popov2015) may subsequently spill over to improve financial knowledge remains to be determined, given that such interventions often permit individuals to remain passive rather than requiring active choice and attention (Chetty et al., Reference Chetty, Friedman, Leth-Petersen, Nielsen and Olsen2014). While evidence on the effectiveness of financial literacy training to improve saving outcomes is mixed (Lusardi and Mitchell, Reference Lusardi and Mitchell2014), the results of this study are consistent with the notion that programs aimed at directly improving saving outcomes – for example, simplifying the process of making complex financial decisions (Beshears et al., Reference Beshears, Choi, Laibson and Madrian2013) – are desirable.
Appendix A
Tables A1–A3 and Chart A1.
Distribution of the relative rate of return, excluding mass near the mode.

EPP coverage in 2013 by cohort, sex and industry of employment

EPP coverage in 2013 by cohort, sex and industry of employment from the full-sample LAD data

Estimated effects of EPP coverage, excluding mass near the mode

Appendix B
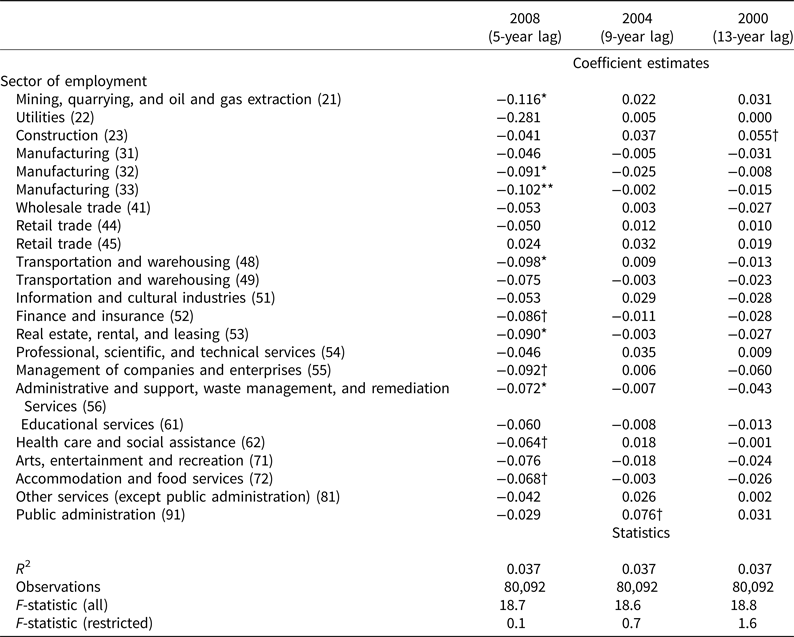
A potential concern with the IV approach is that industry of employment in the past – the lagged industry indicator used as an excluded instrument for identification – may be determined endogenously with the RROI for unobserved reasons, and does not satisfy the exclusion restriction. To address this concern, the following ‘placebo’ test is performed. The set of lagged industry indicators, using the two-digit NAICS code, is regressed directly on the RROI:
 $$\Theta _{i,2013} = \iota + {\rm INDUSTRY}_{it}^{\prime} \zeta + X_{i,2013}^{\prime} \psi + \tau _{i,2013}$$
This model is re-estimated separately for each t ∈ {2000, 2004, 2008}, as before. The analysis is also restricted to individuals who were not covered by an EPP at all from 2000 to 2013, which helps to ensure that any effect of the lagged industry of employment on the RROI is direct, and not arising indirectly through the effect on past EPP coverage.
The results of this analysis are shown in Table B1. Consistent with expectations, the past industry of employment indicators has insignificant direct effects on the RROI, especially for the larger lags. The restricted F-test statistics estimate the extent to which the industry indicators jointly explain the RROI, and in no case are these variables relevant. Hence, any effect of the lagged industry of employment indicators on financial knowledge likely operates indirectly through the effect on EPP coverage.
Placebo test of the effects of the lagged industry of employment indicators on the relative rate of return