NOMENCLATURE
- ATM
Air Traffic Management
- cg
position of the aircraft's centre of gravity, <%MAC>
- CGREFDIST
position of the cg reference point, <meters>
- Crossover altitude
altitude at which the TAS values corresponding to a Speed schedule's IAS and mach are equal
- d alt
flight path segment's total altitude difference, <feet>
- ETE
Expected Time En-Route
- ETS
École de Technologie Supérieure
- EOD
End Of Descent
- FMS
Flight Management System
- FPA
Flight Path Angle, <degrees>
- FPA still-air
Air-Referenced Aircraft Flight Path Angle, <degrees>
- FPA wind
Ground-Referenced Aircraft Flight Path Angle, <degrees>
- fuel
fuel weight, <kilograms>
- fuelburn
quantity of fuel burned on a flight path segment, <kilograms>
- GARDN
Green Aviation Research & Development Network
- GND dist
flight path segment's length relative to ground, <nautical miles>
- GND speed
aircraft speed relative to the ground, <Kn>
- GND wind-dist
wind-adjusted flight path segment's length relative to ground, <nautical miles>
- graph node
a graph point corresponding to the intersection of two or more graph edges
- graph edge
a graph transition corresponding to a vertical flight path segment stored in the look-up structure
- gw
aircraft total gross weight, <kilograms>
- H dist
air-referenced horizontal distance, <nautical miles>
- H speed
horizontal component of the aircraft's true air speed, <Kn>
- H still-air-dist-cruise
still-air, cruise level-flight path segment length, <nautical miles>
- IAS
Indicated Air Speed, <Kn>
- ISADev
temperature deviation relative to standard atmosphere, <Celsius degrees>
- LARCASE
the research laboratory in active controls, avionics and aeroservoelasticity
- LEMAC
Leading-Edge Mean Aerodynamic Chord Position, <meters>
- Look-up structure
structure storing the set of pre-computed climb, cruise and descent vertical flight path segments
- Ma
aircraft moment, <kilogram meter>
- MAC
mean aerodynamic chord length, <meters>
- Mach
mach number, non-dimensional
- Mf
fuel moment, <kilogram meter>
- NextGen
next generation air transportation system
- speed
cruise speed, defined as an IAS or mach value
- Speed schedule
consigned speed, defined using an IAS and mach value
- Step-climb
constant speed climb segment used for increasing the cruise altitude
- Step-descent
constant speed climb segment used for decreasing the cruise altitude
- TAS
True Air Speed, <Kn>
- TAS avg
flight path segment's average true air speed, <Kn>
- TAS cruise
aircraft, cruise level-off flight path segment's true air speed, <Kn>
- t clb
flight path segment climb time, <hours>
- t crz-segm-still-air
still-air, cruise level-flight segment flight time, <hours>
- t crz-segm-wind
wind-adjusted, cruise level-flight segment flight time, <hours>
- T/O
Take-Off
- TOC
Top Of Climb
- TOD
Top Of Descent
- UAV
Unmanned Aerial Vehicle
- V speed
vertical component of the aircraft's true air speed, <Kn>
- zfgw
zero-fuel gross weight, <kilograms>
- zfwcg
zero-fuel centre of gravity position, <%MAC>
1.0 INTRODUCTION
An aircraft's flight plan defines its flight path as a sequence of points in space that the aircraft is mandated to follow from its current position to its destination, where each point is characterised by a geographic location and altitude. Generally, the flight plan is decomposed into three phases: climb, cruise and descent. For each phase, the corresponding flight path is described by a lateral flight plan concentrated on the geographic routing, and a vertical flight plan defining the flying altitudes along the lateral flight plan(Reference Liden1,Reference Liden2) . The vertical flight plans are constructed as a function of the aircraft's performance, and its configuration. The set of flight plan parameters computed by a Flight Management System (FMS) usually contains the geographic locations, altitudes, gross weights, fuel burns, ground and true-air speeds (TAS), segment lengths, bearings and flight times, etc.(Reference Liden1,Reference Liden2) . Once computed, these parameters are employed by the FMS for aircraft navigation and guidance. The FMS flight-plan computation algorithms may also be used to perform flight path optimisations, with objectives such as total flight-time, fuel-burn or total cost minimisation(Reference Liden1,Reference Liden2) . Other research shows that there was a distinct interest in expanding the set of functionalities and capabilities of the flight path prediction algorithms, including areas such as the augmentation of a crew's situational awareness as described by Benavides et al(Reference Benavides, Kaneshige, Sharma, Martin, Panda and Steglinski3).
The flight plan data can also be computed by ground-based algorithms, such as the algorithms used by the Air Traffic Management (ATM) for traffic prediction, planning, and supervision. These algorithms have expanded the series of functions used for aircraft flight path computation(Reference Rivas, Valenzuela and de Augusto4-Reference Lee, Weygandt, Schwartz and Murphy10) by facilitating specific tasks such as conflicts detection and resolution(Reference Granger, Durand and Alliot11,Reference Tomlin, Pappas and Sastry12) , circumventing areas affected by adverse weather(Reference Lee, Weygandt, Schwartz and Murphy10,Reference Brunilde, Lapasset, Delahaye, Rabut and Brenier13-Reference Krozel, Mitchell, Prete, Smith and Andre16) , route selection(Reference Brunilde, Lapasset, Delahaye, Rabut and Brenier13-Reference Suzuki, Tsuchiya and Andreeva17), and developing of routing strategies for traffic flow augmentation(Reference Granger, Durand and Alliot11-Reference Cano, Dorado and Sánchez-Escalonilla22).
Flight path prediction and flight path optimisation algorithms are not exclusively reserved for conventional aircraft or traffic management applications. The advancements in the development of Unmanned Aerial Vehicles (UAV) have led to an exponential increase of the type and range of missions on which they are employed. Consequently, UAV flight path optimisation algorithms, such as those developed by Wilburn et al by using a clothoid planner(Reference Wilburn, Perhinschi and Wilburn23), or the concept of Dubins’ particle(Reference Wilburn, Perhinschi and Wilburn24), can be further used to construct flight paths that ensure the desired mission performance.
Studies conducted at MIT have shown the opportunities and potential of savings in flight path optimisation, as many aircraft do not fly at their optimal speed and/or altitude(Reference Jensen, Hansman, Venuti and Reynolds25,Reference Jensen, Hansman, Venuti and Reynolds26) . Those studies were based on the comparisons between the speeds and altitudes of over 200,000 flights within the continental United States, using Enhanced Traffic Management System data, and optimal speeds and optimal altitudes from models developed with information obtained using Lissys Piano-X (http://www.piano.aero/). A different study, conducted by Bonnefoy et al(Reference Bonnefoy and Hansman27), analysed the data provided by the Bureau of Transport Statistics (BTS) and investigated the influence of cruise-speed reduction in terms of fuel-burn benefits and airline scheduling consequences, and proposed how to mitigate these consequences.
The computing power of on-board platforms is very limited. Moreover, all on-board algorithms – including the FMS algorithms – must be predictable. The aircraft performance and flight path calculations using the classic model based on the aircraft's equations of motion are too complex and too computing-intensive to be employed on these platforms. Therefore, on-board algorithms generally use a simplified aircraft performance model constructed based on a set of linear interpolation tables(Reference Liden1,Reference Liden2) . Taking advantage of the use of advanced computation systems, the ground-based algorithms, such as ATM path prediction and optimisation algorithms, employ an accurate performance model that relies on the aircraft's equations of motion(Reference Rivas, Valenzuela and de Augusto4,Reference Swierstra and Green5,Reference Nuic, Poinsot, Iagaru, Gallo, Navarro and Querejeta28) .
An on-board algorithm re-calculates the flight plan at regular time intervals, which ensures that the flight plan and its corresponding flight path parameters are always in synchronisation with the aircraft's configuration, and the predicted speeds, altitudes, and atmospheric conditions. The flight path computations are performed successively, one segment at a time, from the aircraft's location to its destination. For each segment, the lateral and vertical flight plan components are calculated simultaneously in order to account for waypoint positions (geographical location), altitude restrictions or imposed procedural navigation segments. In addition, the performance model used by the on-board algorithms restricts the maximum length of a cruise segment on which the calculations can be performed(Reference Liden1,Reference Liden2) . Segments longer than a predefined value (usually 50 to 100 Nm) are parsed into a sequence of subsegments whose lengths are limited to a predefined value. This means that for these algorithms, any flight plan update requires a full (lateral and vertical) flight path computation, including the cases in which the vertical flight plan profile does not change. This inefficiency ultimately translates into longer flight plan calculation times, which has even more impact on flight optimisation algorithms that may entail the computation of a larger set of potential optimal flight paths.
The investigations and the development of flight path optimisation algorithms at the ETS’ Research Laboratory in Active Controls, Avionics and Aeroservoelasticity (LARCASE)(Reference Dancila, Botez and Labour29-Reference Félix Patron, Kessaci and Botez43) provided a good understanding of the trade-offs and limitations imposed on the optimisation algorithms with respect to run times and the size of the set of potential paths, and thus, to the general performance of the optimisation algorithm. This research inspired the quest to find faster, less computing-intensive flight path computation algorithms.
The method presented in this paper aims to decrease the number of computations associated with the generation of a flight plan by disconnecting the vertical path computations from the lateral computations, thereby allowing the reuse of the already-computed vertical flight path data. The method employs a fuel burn prediction algorithm developed at the LARCASE(Reference Dancila, Botez and Labour29), and is used in conjunction with free-flight navigation scenarios, along the lines of the impending Next Generation Air Transportation System (NextGen)(Reference Warren9,Reference Cano, Dorado and Sánchez-Escalonilla22,Reference Prevot44-Reference Haraldsdottir, Berge, Kang, Schoemig, Alcabin, Repetto and Carter47) .
The method presented in this paper was developed for scenarios where the aircraft speed is defined by a constant speed schedule in each flight phase (climb, cruise or descent). Also, in each flight phase, the temperature profile of the air function of altitude is characterised by a constant value (ISADev), in degrees Celsius, representing the difference relative to the corresponding standard atmosphere temperature. The ‘climb’ and ‘descent’ paths also take into account the speed and altitude restrictions specific to each phase (such as ‘thrust-reduction’, ‘acceleration’ or ‘speed restriction’ altitudes) as well as the position of the crossover altitude. The aim was to investigate the generation and use of precomputed vertical flight path data in a simpler context (comparative to a more complex scenario considering multiple temperatures and speed schedules). The results of an initial and limited evaluation of the present method performed for a single test case (different than the cases considered in this paper) were presented in Ref. (Reference Dancila and Botez48).
The assembly and use of precomputed vertical flight path data in a more complex scenario that considers multiple speed schedules and air temperature deviation values may be the subject of future research.
2.0 EXISTING ALGORITHMS’ VERTICAL AND LATERAL FLIGHT PATH SEGMENT PARAMETERS’ COMPUTATION
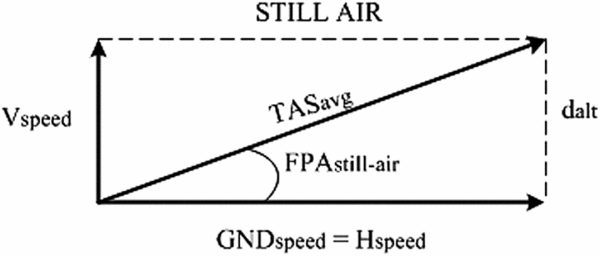
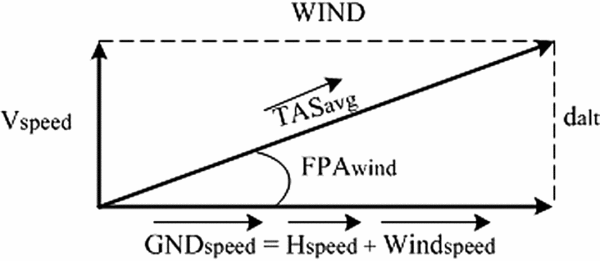
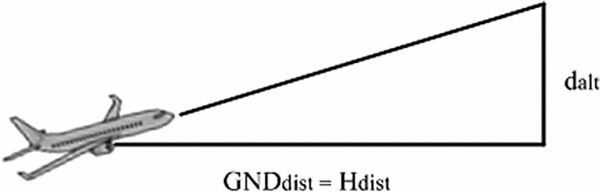
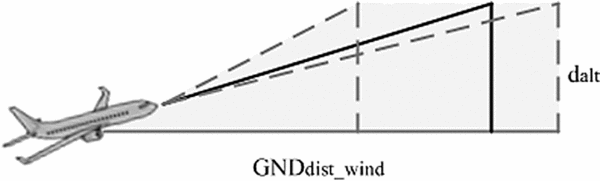
As previously mentioned, existing flight plan computation algorithms perform a simultaneous determination of a flight path's lateral and vertical parameters, sequentially – one segment at a time, from the aircraft's position to the destination airport. These algorithms assume that winds have no vertical component; therefore, the winds have no direct influence on the set of aircraft performance parameters corresponding to the vertical profile. This means that for unconstrained climb, descent, acceleration, or deceleration segments (no waypoint-imposed segment length limitations), the wind will only affect the segment's horizontal distance. For constant-speed level-flight segments, given their maximum segment length limitation of up to 50-100 Nm, and the given performance modelling (hourly fuel burn rate), the wind only affects the segment flight time. The examples below illustrate the wind effects for climb (Figs. 1-4) and for constant-speed level-flight segments (Figs. 5-6).
The relationship between the pre-computed still-air and wind-adjusted climb flight path parameters: still-air speed diagram.

The relationship between the pre-computed still-air and wind-adjusted climb flight path parameters: wind-adjusted speed diagram.

The relationship between the pre-computed still-air and wind-adjusted climb flight path parameters: still-air climb segment geometry.

The relationship between the pre-computed still-air and wind-adjusted climb flight path parameters: wind-adjusted climb segment geometry.

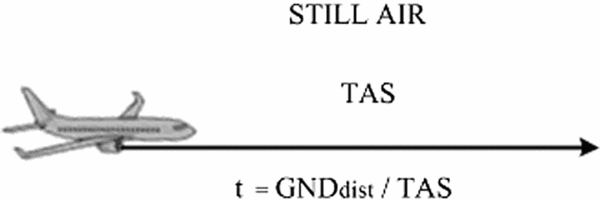
The relationship between the pre-computed still-air and wind-adjusted cruse, level-flight path parameters: still-air speed diagram.

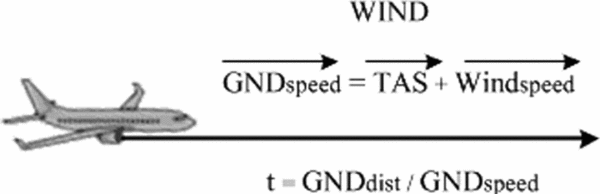
The relationship between the pre-computed still-air and wind-adjusted cruse, level-flight path parameters: wind-adjusted speed diagram.

The climb or descent performance data provides the values for a segment's fuel burn and still-air horizontal distance (H dist) as a function of a given aircraft configuration (i.e. weight and centre-of-gravity position) at the beginning of the segment, the segment's airspeed (IAS or Mach), the air temperature (ISADev), the initial altitude, and the final altitude. The horizontal component of the aircraft’ speed (H speed) and the distance H dist value are calculated relative to the mass of air in which the flight is performed; for still-air conditions, they are equal to the segment's ground speed (GND speed) and the ground distance (GND dist).
Consequently, the set of equations characterising a still-air climb/descent segment are:
 $$\begin{equation}
GN{D_{{\rm{dist}}}} &=& {H_{{\rm{dist}}}},
\end{equation}$$
 $$\begin{equation}
{d_{{\rm{alt}}}} &=& {\hbox{\rm final}}_{\rm{altitude}} - {\rm{initia}}{{\rm{l}}_{{\rm{altitude}}}},
\end{equation}$$
Considering the diagram presented in Fig. 3, the still-air Flight Path Angle (FPA) for a climb segment is computed using the equation:
 $$\begin{equation}
{\hbox{\it FPA}}{_{{\rm{still}} - {\rm{air}}}} = \arctan \left( {\frac{{{d_{{\rm{alt}}}}}}{{{H_{{\rm{dist}}}}}}} \right)
\end{equation}$$
Subsequently, the aircraft's average vertical (V speed) and horizontal speed (GND speed) components (presented in Fig. 1) are computed using the equations:
 $$\begin{equation}
{V_{{\rm{speed}}}} &=& {\hbox{\it TAS}}{_{avg}}*\sin ({\hbox{\it FPA}}{_{{\rm{still}} - {\rm{air}}}}),
\end{equation}$$
 $$\begin{equation}
{\hbox{\it GND}}{_{{\rm{speed}}}} &=& {H_{{\rm{speed}}}} = {\hbox{\it TAS}}{_{avg}}*cos({\hbox{\it FPA}}{_{{\rm{still}} - {\rm{air}}}}),
\end{equation}$$
The segment climb time is computed using the equation:
 $$\begin{equation}
{t_{clb}} = \frac{{{d_{{\rm{alt}}}}}}{{{V_{{\rm{speed}}}}}}
\end{equation}$$
During the lateral flight path segment computations, the wind influences the value of the ground speed, computed as a vector summation of the H speed and the wind speed using the ‘wind triangle algorithm’(Reference Hopper49). The V speed and t clb values remain unchanged. Consequently, the segment ground distance computed as a function of the wind conditions (GND dist-wind) is found by:
 $$\begin{equation}
{\hbox{\it GND}}{_{{\rm{dist}} - {\rm{wind}}}} = {\hbox{\it GND}}{_{{\rm{speed}}}}*{t_{clb}} = \frac{{{\hbox{\it GND}}{_{{\rm{speed}}}}}}{{{V_{{\rm{speed}}}}}}*{d_{{\rm{alt}}}}
\end{equation}$$
Given the fact that the segment's flight time is identical for still-air and wind conditions, the relationship between the ground distances corresponding to still-air and wind conditions is described by the following equation:
 $$\begin{equation}
\frac{{{\hbox{\it GND}}{_{{\rm{dist}} - {\rm{wind}}}}}}{{{H_{{\rm{dist}}}}}} = \frac{{{\hbox{\it GND}}{_{{\rm{speed}}}}}}{{{H_{{\rm{speed}}}}}}
\end{equation}$$
As shown in Equation (8), the wind determines a segment ground distance that is a scaled value of the still-air horizontal distance (H dist) by a factor equal to the ratio between the average ground and still-air speed values. Consequently, in the presence of winds, the ground-referenced segment flight path angle (FPA wind) is:
 $$\begin{equation}
{\hbox{\it FPA}}{_{{\rm{wind}}}} = \arctan \left( {\frac{{{d_{{\rm{alt}}}}}}{{{\hbox{\it GND}}{_{{\rm{dist}} - {\rm{wind}}}}}}} \right) = \arctan \left( {\frac{{{H_{{\rm{speed}}}}}}{{{\hbox{\it GND}}{_{{\rm{speed}}}}}}\frac{{{d_{{\rm{alt}}}}}}{{{H_{{\rm{dist}}}}}}} \right)
\end{equation}$$
For descent, the relationship between a flight path segment's parameters in still-air and under wind conditions is identical to that of climb; therefore, Equations (3)-(9) are also valid for determining a descent segment's wind performance parameters.
For cruise level-flight segments flown in still-air conditions (Fig. 5), the ground speed is identical to the TAS value computed as a function of the set of IAS/Mach, altitude and air temperature values.
Consequently, for a segment of a given length (GND dist), the corresponding flight time is computed as:
 $$\begin{equation}
{t_{{\rm{crz}} - {\rm{segm}} - {\rm{still}} - {\rm{air}}}} = \frac{{{\hbox{\it GND}}{_{{\rm{dist}}}}}}{{{\hbox{\it TAS}}}}
\end{equation}$$
The aircraft's level-flight ground speed as a function of the wind conditions is computed similarly to a climb segment, by adding the TAS and the wind vectors (Fig. 6). Therefore, the flight time can be computed as:
 $$\begin{equation}
{t_{{\rm{crz}} - {\rm{segm}} - {\rm{wind}}}} = \frac{{{\hbox{\it GND}}{_{{\rm{dist}}}}}}{{{\hbox{\it GND}}{_{{\rm{speed}}}}}}
\end{equation}$$
For a flight path segment defined with respect to a given flight time (t crz − segm − still − air = t crz − segm − wind), the relationship between the segment's still-air parameters and ground speeds and distances is described by the equation:
 $$\begin{equation}
\frac{{{\hbox{\it GND}}{_{{\rm{dist}} - {\rm{wind}}}}}}{{{\hbox{\it GND}}{_{{\rm{dist}}}}}} = \frac{{{\hbox{\it GND}}{_{{\rm{speed}}}}}}{{{\hbox{\it TAS}}}}
\end{equation}$$
which is similar to the equation corresponding to climb and descent segments.
The existing algorithms therefore compute the cruise level-flight path segment's fuel burn by multiplying the corresponding segment's flight time and fuel burn rate. The cruise constant-speed level-flight segment fuel burn computation algorithm developed at LARCASE(Reference Dancila, Botez and Labour29) determines a segment's fuel burn as a function of the aircraft's initial gross weight at the start of the segment and the segment's flight time. It also eliminates the limitations relative to the maximum length of the segment.
3.0 DESCRIPTION OF THE PROPOSED METHOD
The proposed method addresses the computation and assembly of a set of vertical flight path segments that may be utilised for the construction of an aircraft's lateral and vertical paths composing the flight plan as a function of the aircraft's performance model, and the aircraft and flight plan configuration parameters (departure and destination airports’ altitudes, End of Descent (EOD) position, take-off weight and balance configuration, selected range of cruise altitudes, standard air temperature deviation, climb, cruise and descent speeds, and the set of expected landing or EOD gross weights). Furthermore, the proposed method employs a graph (a vertical flight path graph) to characterise the relationship between the set of segments assembled in the vertical flight path look-up structure. The method takes into consideration cruising altitudes situated at multiples of 1,000 ft.
This set of flight path segments, assembled in a vertical flight path look-up structure, describes all the phases of a flight (climb, cruise, and descent), and covers the limits of the aircraft's flight envelope. The climb, cruise, acceleration and deceleration vertical flight paths are computed according to the implementation of the aircraft's performance model, described by a set of performance and limitation parameters, and a set of linear interpolation tables. The cruise, constant-speed level-flight vertical flight paths are computed using the fuel burn computing method developed at LARCASE(Reference Dancila, Botez and Labour29). The pre-computed vertical flight path segments’ parameters (such as horizontal distance, fuel burn or fuel burn rate, flight path angle, or flight time) correspond to still-air flight conditions.
Similar to the classic computation of a flight plan, the present method considers that the atmospheric winds do not have vertical components; therefore, the winds have no influence on the aircraft's vertical speed. Instead, they influence the ground-referenced segment flight path angle (FPA wind) and the flight path parameters associated with lateral plan, such as the ground speed, the flight time and the ground distance, as illustrated in the examples presented in Figs 1-6, and in Equations (1)-(12). Consequently, for the climb, descent, acceleration or deceleration segments, the corresponding still-air average speeds, flight path angles, and flight times determined using Equations (1)-(6) are stored along with the matching vertical flight path segments’ performance data and used during the lateral flight plan profile computations, generating a full lateral and vertical flight plan.
A cruise, constant-speed level-flight segment connects two consecutive non-constant-speed level-flight segments (climb, descent or deceleration segments). It is characterised by the cruising altitude and the gross weight values described in the two delimiting segments’ vertical path performance data for that particular cruising altitude. The corresponding still-air cruise distance is computed by multiplying the cruise segment's TAS by the segment's flight-time computed as a function of the cruising altitude and the initial and final aircraft gross weight (thus, the fuel burn) using the algorithm developed at LARCASE(Reference Dancila, Botez and Labour29):
 $$\begin{equation}
{t_{{\rm{crz}} - {\rm{segm}} - {\rm{still}} - {\rm{air}}}} &=& f\left( {al{t_{{\rm{crz}}}},g{w_{{\rm{initial}}}},g{w_{\scriptsize{\hbox{\rm final}}}}} \right),
\end{equation}$$
 $$\begin{equation}
{H_{{\rm{still}} - {\rm{air}} - {\rm{dist}} - {\rm{cruise}}}} &=& {\hbox{\it TAS}}{_{{\rm{cruise}}}}*{t_{{\rm{crz}} - {\rm{segm}} - {\rm{still}} - {\rm{air}}}}
\end{equation}$$
For each set of aircraft and flight configuration parameter values, the vertical flight paths are computed once, and subsequently employed in all flight plan computations. This, in turn, provides an important reduction of the volume of computations associated with the recurrent flight plan calculation, update or optimisation.
Each flight path data set describes, among others, the aircraft's gross weight variation with altitude (for climb/descent segments), and the range and variation of its gross weight values for a given cruise altitude (for constant-speed level-flight segments). Consequently, for each altitude value in the range of altitudes characterised by the look-up structure, there are only a limited set or range of gross weight values which correspond to the pre-computed flight paths. A valid ‘gross weight – altitude binomial’ represents a pair of values comprised of an aircraft gross weight and a flying altitude belonging to at least one pre-computed flight path segment.
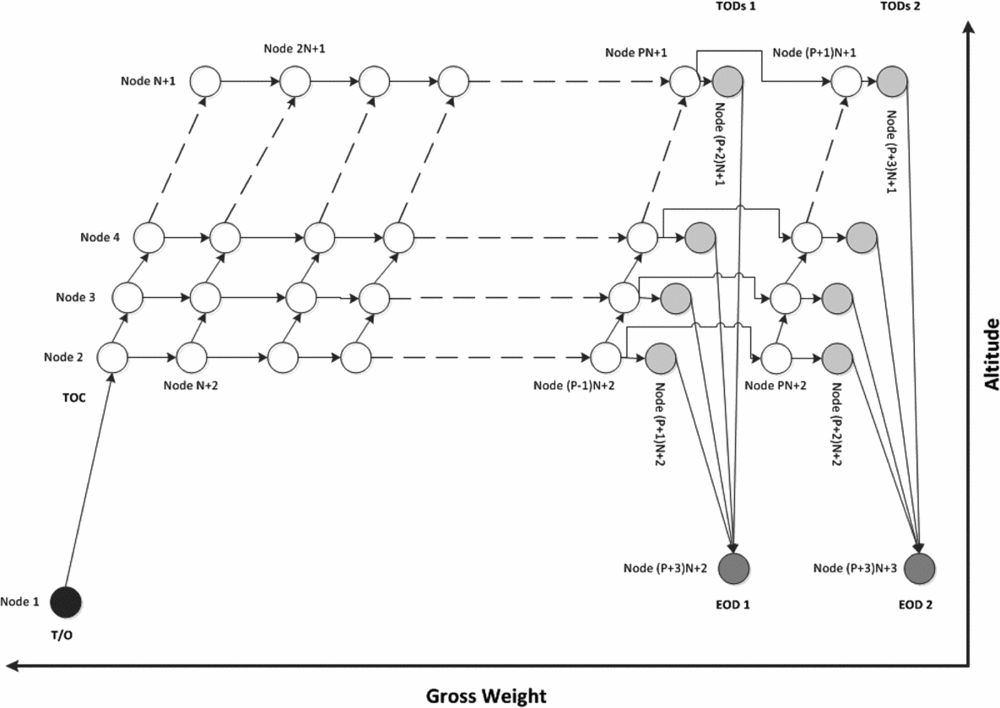
The ‘vertical flight path graph’, illustrated in Fig. 7, is built using the flight path segments’ data assembled in the vertical flight path look-up structure (their construction is described in detail in Section 3.7).
The vertical flight path graph corresponding to a look-up structure describing a climb path, a cruise phase composed of N cruising altitudes, P step-climb flight paths, and two sets of descent flight paths corresponding to two expected landing gross weights.
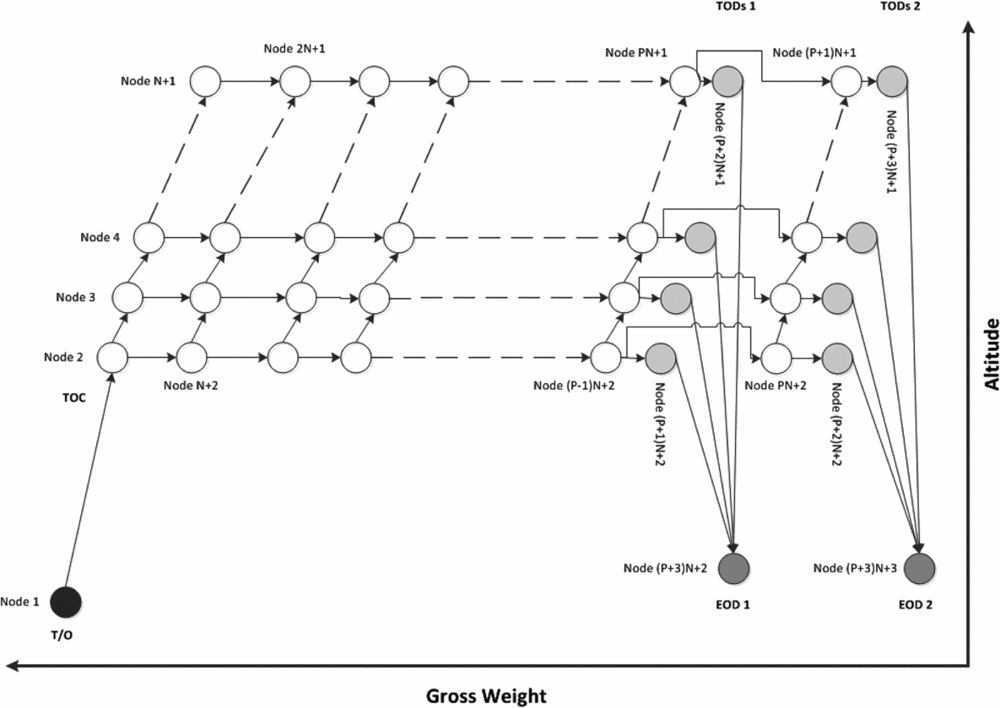
A ‘graph node’ represents a gross weight – altitude binomial belonging to at least two pre-computed vertical flight path segments. It represents the intersection of two or more pre-computed look-up table flight paths. A ‘graph edge’ represents a vertical flight path segment stored in the look-up structure, which starts at the initial altitude and gross weight values (the ‘initial node’) and ends at the final altitude and gross weight values (the ‘final node’).
During the construction of a flight plan, the vertical flight path graph can be used for identifying the available segments options, and for extracting the corresponding vertical flight path segment's performance data from the look-up structure.
At each stage of a flight plan construction, the position of the start point on the vertical flight path graph (the corresponding graph edge/node, altitude, gross weight, etc.) is known as it represents the end of the last computed segment. If the start point is situated on an edge the only option available is to continue on the same edge. If the start point corresponds to a node, the construction of the vertical flight plan can continue using any of the available edges staring at the respective node. The information regarding the selected edge, starting altitude and gross weight are used to extract the vertical flight plan segment performance data from the vertical flight path look-up structure.
The vertical flight path look-up structure and vertical flight path graph were described and organised with respect to the aircraft's altitude and gross weight values, an arrangement which is analogous to the aircraft performance model.
3.1 Input configuration data
Each part of ‘configuration data’ employed by the present method corresponds to one of the following categories:
• Aircraft performance – aircraft-specific linear interpolation tables and data.
• Aircraft configuration – the zero-fuel gross weight (zfgw), fuel weight (fuel), zero-weight centre-of-gravity position (zfwcg), and one or more values of the expected landing or End of Descent (EOD) gross weight.
• Atmosphere – the air temperature, defined by the corresponding standard temperature deviation (ISADev).
• Navigation – the departure and destination airports’ and EOD altitudes; minimum and maximum cruise altitude limitations; climb, cruise and descent speed schedules, EOD speed (a ‘speed schedule’ denotes a pair of Indicated Air Speed (IAS) and Mach index values).
An aircraft's performance model(Reference Liden1,Reference Liden2) supplies all the data necessary for the calculation of aircraft and flight path parameters, such as the maximum flight altitudes, fuel burn, altitudes, and still-air flight distances and flight path angles. Each calculation employs one or more linear interpolation tables specific to the particular performance parameter and flight phase, and the calculation may depend on one or a combination of parameters such as aircraft weight and balance configuration, altitude, speed, air temperature, etc. The present method considers that for each flight phase, the air temperature (defined using the standard temperature deviation) is constant; thus, it does not change with the geographical position and time.
The advantage of considering the set of expected landing/EOD gross weight values as an input to the method is that it allows the advanced computation of the set of expected vertical descent paths to be stored in the vertical flight path look-up structure and in the vertical flight path graph. The selection of these values may be performed following an analysis of historical flight data corresponding to the aircraft's type, departure and destination airports, etc. Moreover, it is known that the ‘descent’ flight paths’ performance parameters are less sensitive with respect to gross weight variation (and thus, the estimated landing/EOD gross weight variation) than those corresponding to ‘cruise’ and especially ‘climb’ flight path performance parameters(Reference Gerretsen and Swierstra50). Therefore, a judiciously chosen set of landing gross weights may also allow the use of pre-computed descent paths for performance computations corresponding to other landing gross weight values, by employing interpolation algorithms, which will result in path predictions within an acceptable error margin.
3.2 Gross weight and centre-of-gravity position
For some aircraft models, the performance interpolation tables may impose calculations as a function of the centre-of-gravity position. Consequently, the expression linking the fuel weight, the total weight, and the centre-of-gravity position must be established prior to the construction of the vertical flight path look-up structure. This expression is a function of the aircraft's take-off weights and balance configuration and relies on a set of aircraft performance tables. It does not change for the entire extent of the flight, thus for any flight phase, segment type, flight speed, altitude or atmospheric conditions.
As illustrated in the literature(Reference Dancila, Botez and Labour29,51) , the aircraft's total gross weight gw and the position of its centre of gravity cg specified as a percentage of the mean aerodynamic chord length (% MAC) are dependent on the aircraft's zero fuel gross weight zfgw, zero fuel weight centre-of-gravity position zfwcg, and fuel weight fuel, as described in Equations (15) and (16):
 $$\begin{equation}
gw &=& {f_1}\left( {{\hbox{\it zfgw}}{\rm{,}}\;{\rm{fuel}}} \right),
\end{equation}$$
 $$\begin{equation}
cg &=& {f_2}\left( {{M_a}\left( {{\hbox{\it zfgw}}, {\hbox{\it zfwcg}}} \right),{M_f}\left( {{\rm{fuel}}} \right), {\hbox{\it CGREFDIST}}, {\hbox{\it LEMAC}}, {\hbox{\it MAC}}} \right),
\end{equation}$$
3.3 Maximum flying altitude as function of the gross weight
The vertical flight paths assembled in the vertical flight path look-up structure must conform to a minimum set of two conditions: account for the aircraft's performance and their limitations and cover the maximum set of altitude and gross weight configurations (the flight envelope). Both conditions require a proper characterisation of the maximum flying altitude, which depends on the aircraft's performance, and which could also be a function of one or more parameters related to the particular aircraft's configuration (gw, cg), and flying conditions (speed, air temperature, etc.).
The proposed method addresses these requirements first by determining the relationship between the maximum altitude and the aircraft's gross weight, and for the flying conditions for each phase (climb, cruise, and descent) using the appropriate set of aircraft performance data. Secondly, for each flight phase, a table is constructed that provides the maximal set of altitudes and the corresponding maximum allowed aircraft gross weight.
For the cruise phase, the table provides the necessary information regarding the maximum altitude envelope for the particular aircraft configuration and flying conditions, as well as the maximum gw value (earliest point) at which a flight is possible, as function of the cruise altitude. This information in turn allows the computation of the earliest climb start points (gw values), and the earliest possible climb flight paths that lead to each cruise altitude, thereby maximising the range of flight paths available for the flight plan computation phase.
3.4 The climb flight path and the Top of Climb
The climb phase extends from the take-off altitude or from the aircraft's initial altitude to the Top of Climb (TOC), reached at the point where the climb flight path arrives at the minimum cruise altitude. The proposed method considers that the climb path is an unconstrained, continuous climb, meaning that there are no waypoint-imposed altitude and speed restrictions, nor mandatory level-off segments.
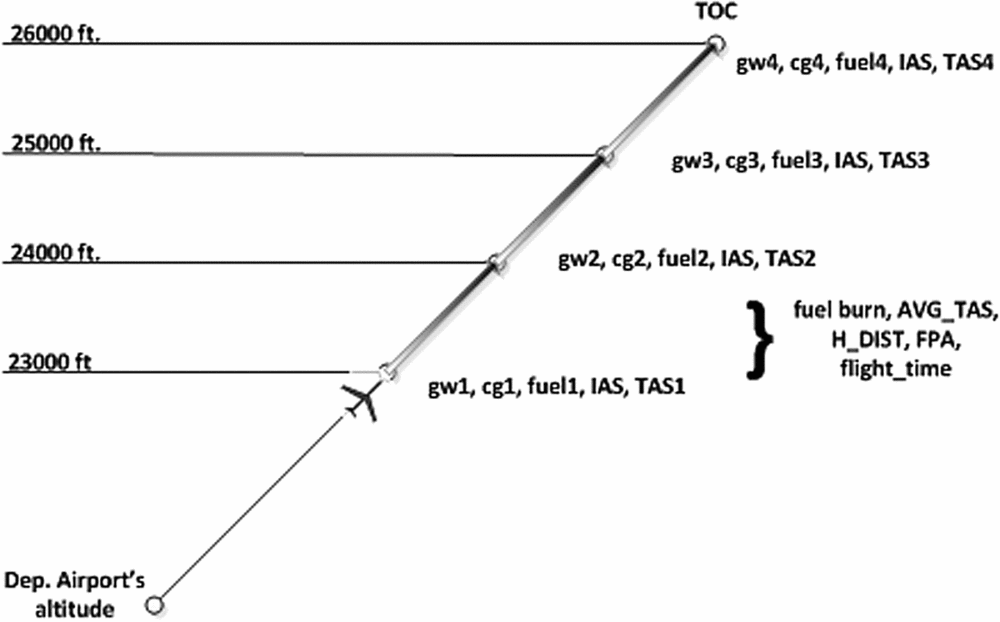
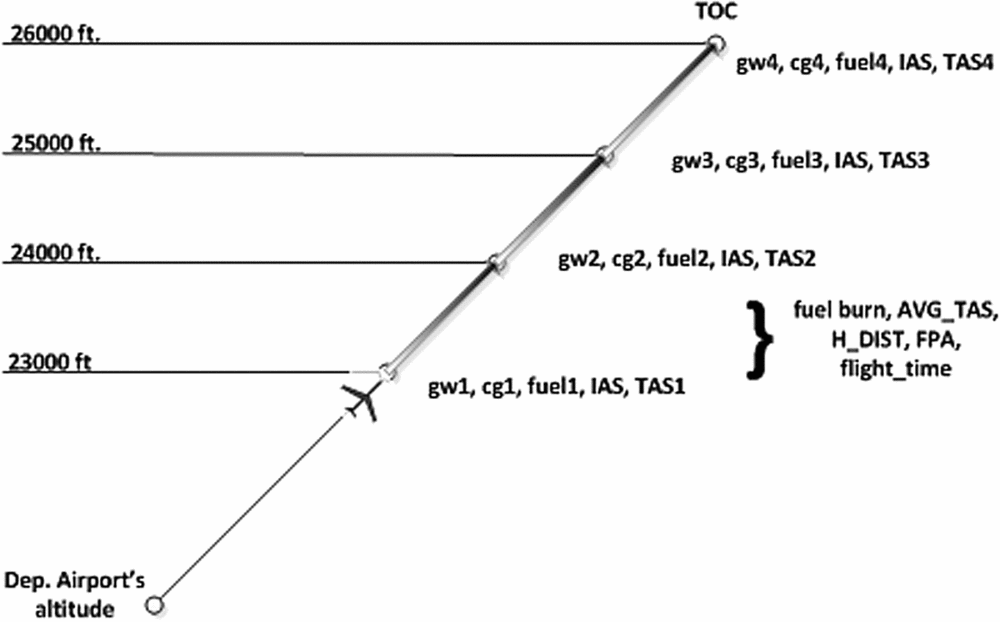
The climb path is decomposed in sub-segments, and its parameters are computed for these sub-segments corresponding to altitude differences of a maximum of 1,000 ft. Therefore, each such sub-segment usually starts and/or ends at an altitude multiple of 1,000 ft. and is characterised by a set of parameters which may include:
• The aircraft's initial and final flying altitudes;
• The aircraft's initial and final gw, cg, and fuel weight;
• The aircraft's initial and final IAS/Mach and TAS values;
• The sub-segment's still-air horizontal distance and flight path angle (FPA); and
• The sub-segment's flight time, fuel-burn, and average TAS.
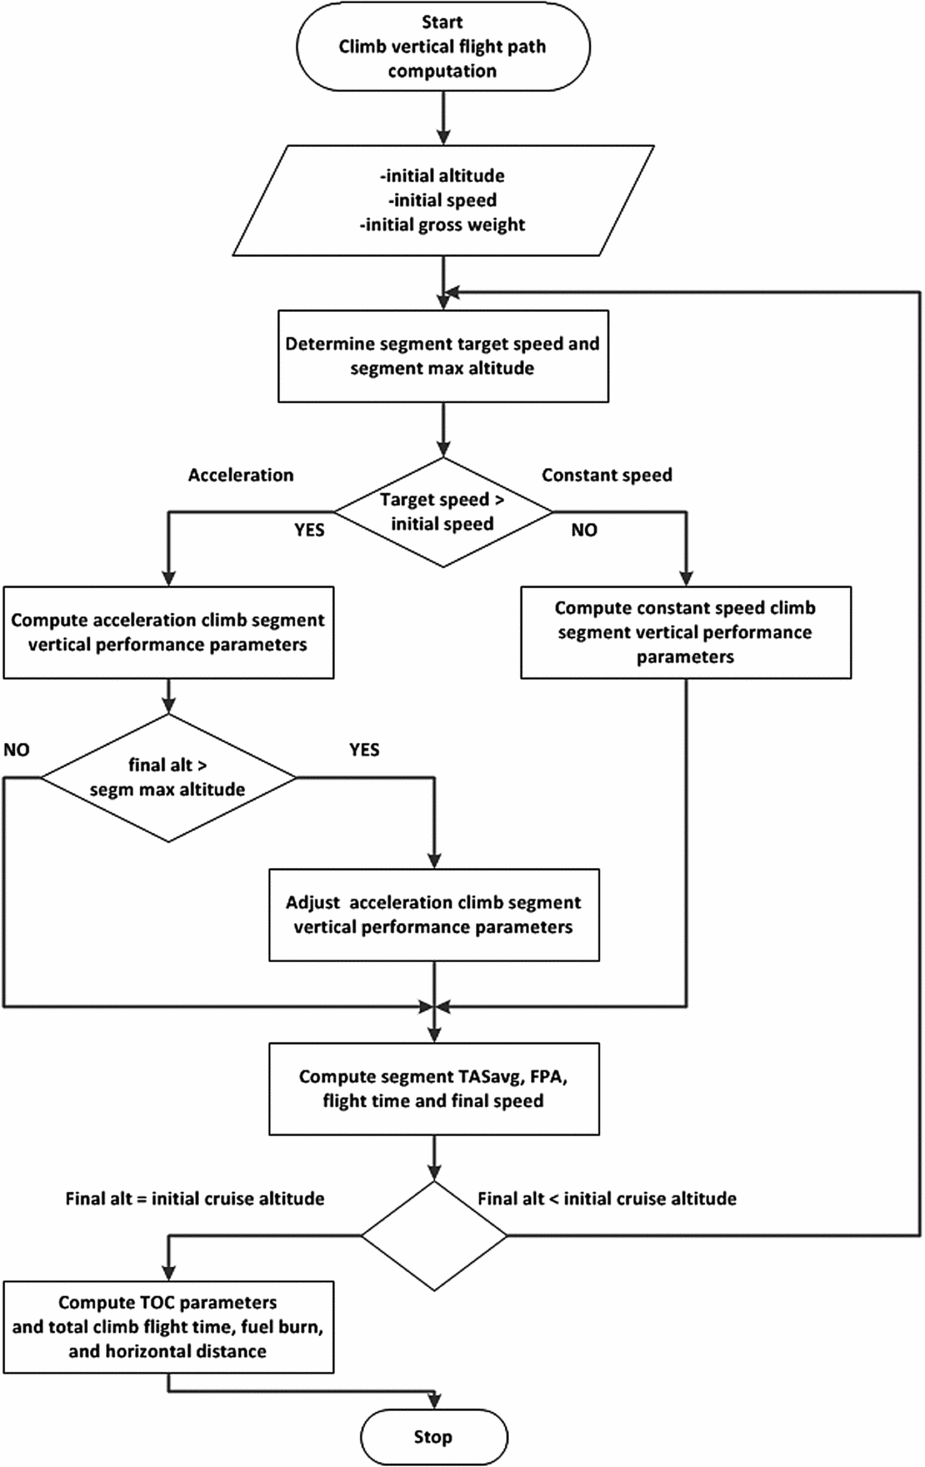
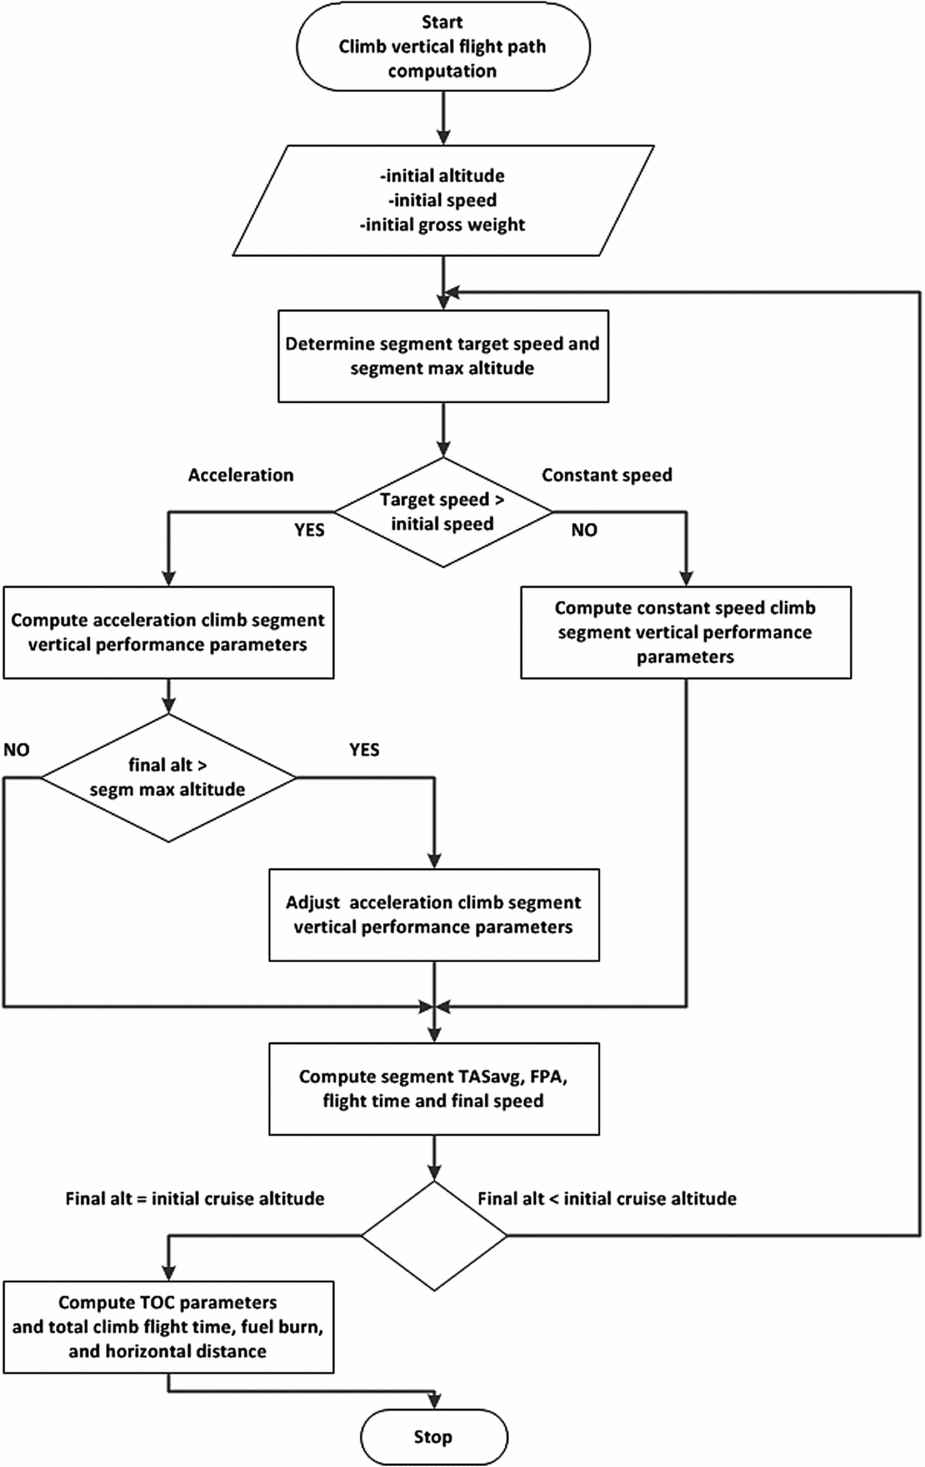
As mentioned above, the climb flight path computation takes into account all procedural speed and altitude constraints, including the take-off speed as well as the thrust reduction, acceleration, speed restriction, and crossover altitudes. The sequence of steps employed for the computation of the climb vertical flight path and the TOC parameters is presented in Fig. 8, below.
The climb vertical flight path computation workflow.
An illustration of a climb vertical flight path, including its altitude-based segmentation, and the corresponding performance parameters is presented in Fig. 9.
The pre-computed climb vertical flight path parameters.
Complementary to the climb vertical flight path data, an additional set of parameters associated with the TOC characterises the climb path as a whole and may include:
• TOC altitude;
• TOC gw, fuel, and cg;
• TOC IAS/Mach and TAS;
• Still-air, horizontal distance measured from aircraft location to the TOC, as the sum of the still-air horizontal distances of the composing climb segments;
• Time to TOC as the summation of the composing climb path segments’ flight times; and
• Climb fuel-burn as the sum of the fuel burns of the composing climb path segments.
The individual segments’ flight times as well as the time to TOC computed in still-air conditions remain valid during the lateral path calculations, as the winds are assumed to have no vertical components. However, during the lateral path computations, the still-air, vertical path-computed speed, horizontal distance, and flight path angle parameters are adjusted as function of each segment's particular wind conditions, as illustrated in Figs. 1-4 and Equations (7)-(9).
3.5 Descent flight paths and the set of Top of Descent points
For the descent phase, the set of computed descent vertical flight paths are connecting the EOD altitude to the maximum valid cruise altitude. They may incorporate the required level-flight deceleration segments at each cruise altitude, which correspond to the aircraft's deceleration from cruise to the descent speed. The set of points situated at the start of the deceleration segments represents the set of Top of Descent (TOD) points. The number of descent vertical paths is equal to the number of expected EOD gross weight values provided as input data. For each descent path, the number of TOD points is identical to the number of altitudes, positioned in the selected range of cruise altitudes, provided as input data, which meet the aircraft's maximum altitude and gross weight flight envelope limitations.
Each descent vertical flight path's parameters are divided in two groups. The first group characterises the set of ‘level-flight deceleration segments’, one segment per valid cruise altitude, and the second group characterises the ‘actual descent path’, which is performed at the descent speed schedule, from the corresponding maximum valid cruise altitude to the EOD altitude. The approach used in the construction of the descent paths ensures that for any selected TOD (corresponding to a descent flight path and cruise altitude), the aircraft's parameters at the end of the deceleration segment are equal to those of the selected actual descent flight path at the TOD's cruise altitude (as illustrated in Fig. 7).
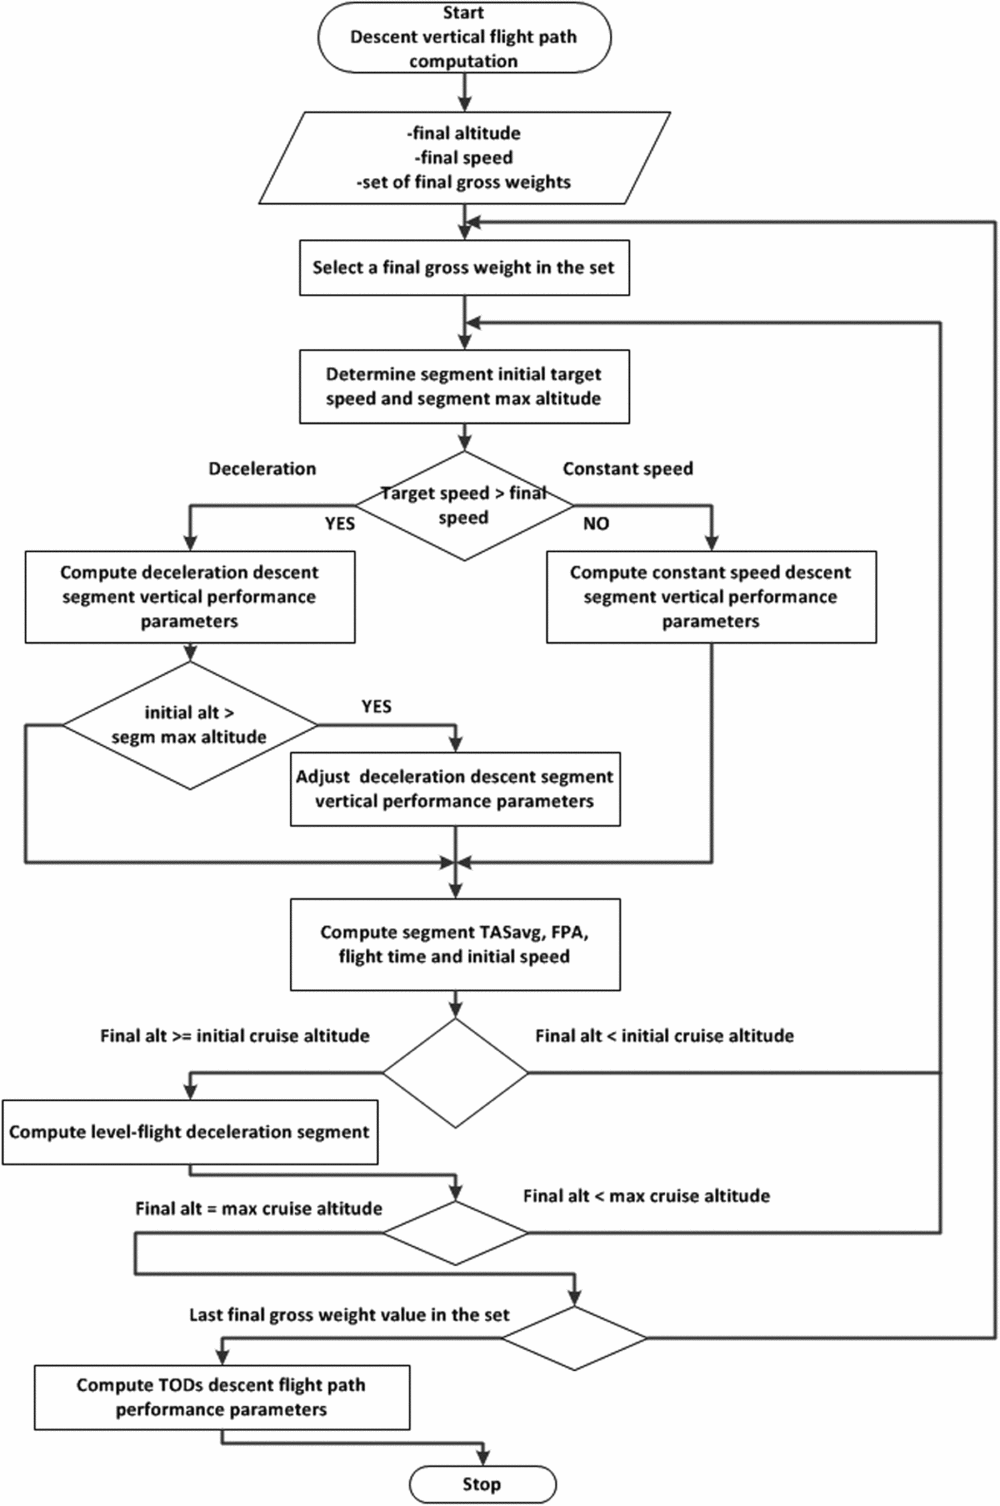
Figure 10 illustrates the sequence of steps employed for the construction of the descent paths, from the EOD altitude up to the maximum cruise altitude, which include the actual descent and the flight paths’ level-flight deceleration segments.
The descent vertical flight paths’ computation workflow.

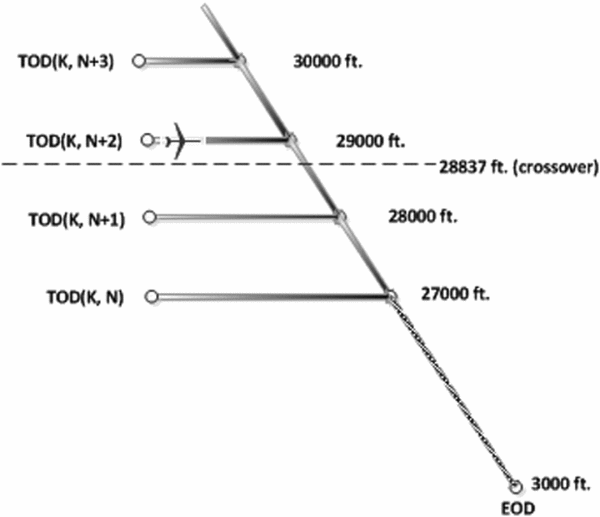
An example of a descent vertical flight path and the relationship between the TODs, the deceleration segments, the actual descent, and the EOD is presented in Fig. 11, where k represents the index of the selected landing/EOD gross weight value, and N+i represents the index of the selected cruise altitude value.
Example of a descent flight path – the deceleration and descent segments.

The actual descent vertical flight path data is similar to the climb vertical flight path data in terms of number and type of parameters, as well as in terms of the sub-segments’ 1,000 ft. altitude decomposition.
Each ‘level-flight deceleration’ segment represents the flight path segment connecting the corresponding pair of level-flight constant speed cruise, and actual descent paths. The deceleration segment is characterised by a set of parameters which include:
• Aircraft's altitude;
• Aircraft's initial and final gw, cg, and fuel weight;
• Aircraft's initial and final IAS/Mach and TAS values;
• Segment's still-air horizontal distance; and
• Segment's flight time, fuel-burn, and average TAS.
The resulting descent vertical flight paths’ data can be assembled as a 2 × K × N structure, where N represents the number of cruise altitudes, and K represents the number of descent paths (expected gross weight landing/EOD values). The element (1, i, j) stores data characterising the ‘deceleration segments’ corresponding to the descent path i ‘at’ the cruise altitude j, and the element (2, i, j) stores the data characterising the ‘actual descent segments’ corresponding to the descent path i ‘from’ the cruise altitude j.
Complementary to the descent segments’ vertical flight path data, an additional set of parameters corresponding to the computed TODs provides a global characterisation of the set of available descent paths. The TOD data may be organised as a function of the EOD gross weight and initial cruise altitude, where the parameters describing each TOD may include:
• TOD gw, fuel, and cg;
• TOD IAS/Mach and TAS;
• Still-air distance from the TOD to the EOD as the sum of still-air horizontal distances of the ‘deceleration in cruise’ and ‘descent’ segments;
• TOD to EOD flight time, as the sum of the corresponding ‘deceleration in cruise’ and ‘descent’ flight times; and
• Descent fuel-burn as the sum of the fuel burns of the corresponding ‘deceleration in cruise’ and ‘descent’ flight path segments.
3.6 Cruise vertical flight paths
For the cruise phase, the set of vertical flight paths consists of flight path segments that may be employed to link the TOC (if the aircraft is in climb) or the actual aircraft position (if the aircraft is already in cruise) with the set of TODs. These segments are positioned between the minimum cruise altitude and the maximum altitude in the set of TOD altitudes. The present method limits the cruise segments’ types to ‘constant-speed level-flight’ and ‘constant-speed step-climb’. As previously mentioned, the proposed method considers constant climb, cruise and descent speed schedules. As well, it considers only climb in cruise segments in accordance with the usual tendencies of searching higher cruise altitudes which yield better flight performance. Cruise step-descents are usually performed as a consequence of an ATC request or extreme weather avoidance manoeuvers and are not a part of pre-planned flight paths. Thus, cruise ‘step-descents’, acceleration or deceleration segments are not considered.
3.6.1 Step-climb vertical flight paths
The actual number of step-climb vertical flight paths stored in the look-up structure is dependent on the relationship between the desired step-climb vertical flight path resolution and the platform's processing time and memory space limitations. These paths may include the earliest climbs to each cruise altitude (the climb paths reaching the cruise altitudes at gross weights corresponding to the maximum gross weight values allowed at each cruise altitude). Each step-climb vertical flight path is decomposed into sub-segments corresponding to maximum 1,000 ft. altitude differences, and takes into consideration the position of the crossover altitude. All step-climb sub-segments are computed in the same manner, and are described by the same set of parameters as the climb sub-segments.
3.6.2 Level-flight cruise vertical flight paths
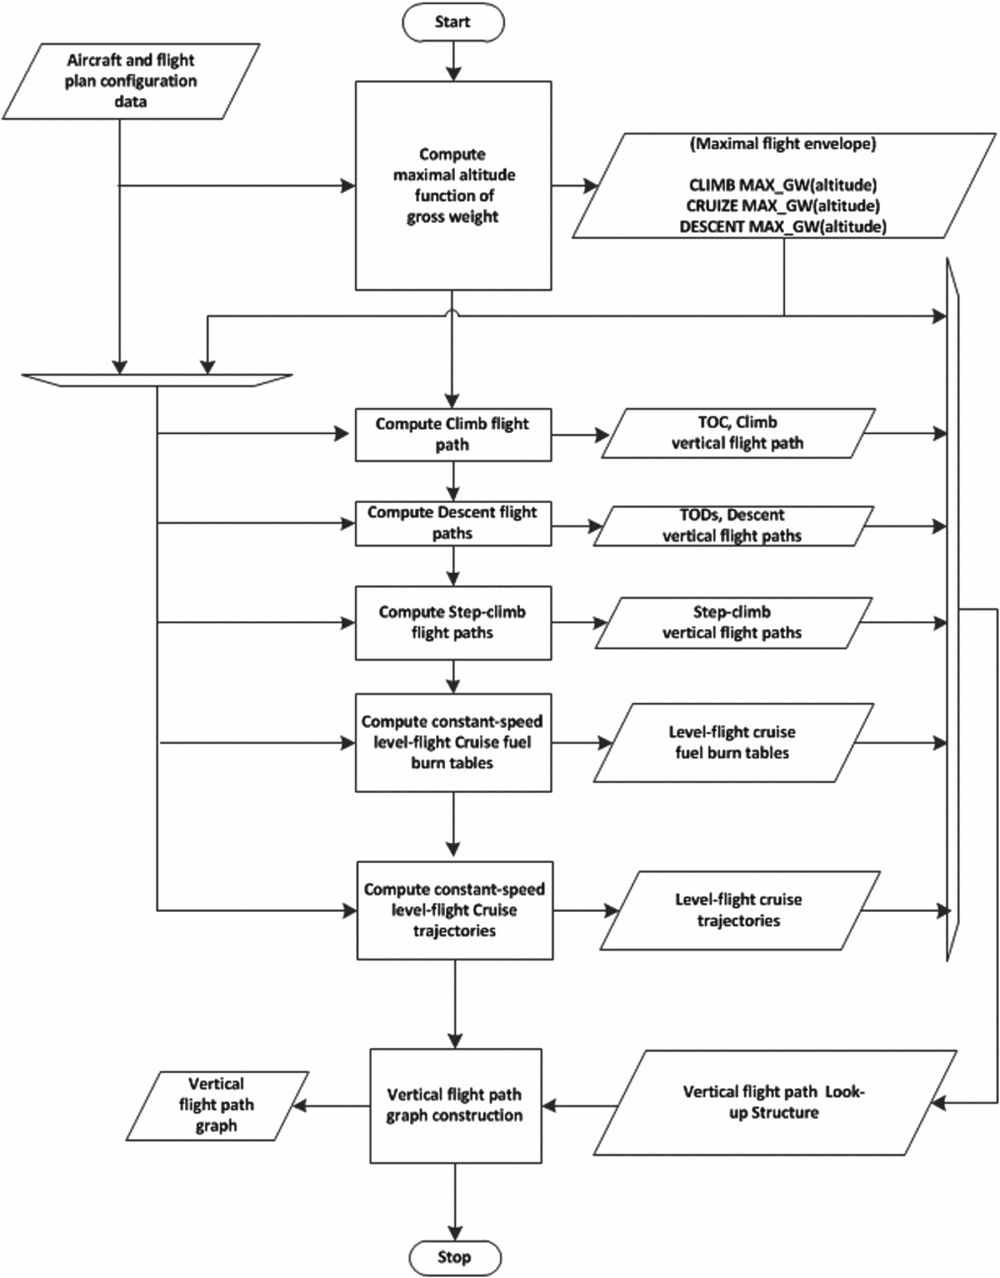
The level flight cruise vertical flight paths are constructed for altitude multiples of 1,000 ft. The performance parameters of the segments composing the level-flight cruise path were calculated using the fuel burn computation algorithm developed at the LARCASE laboratory(Reference Dancila, Botez and Labour29). This algorithm constructs and uses a fuel burn look-up table that describes the correlation between the gross weight at the beginning of the segment, cruise altitude, segment flight time, and the aircraft's gross weight at the end of the segment -the fuel burn. Figure 12 illustrates the sequence of steps employed for the construction of the level-flight cruise vertical path data.
The level-flight cruise vertical flight path computation workflow.

The constant-speed level flight look-up table is calculated once and is valid for the entire cruise flight. This table makes it possible to perform more flexible fuel burn computations than the existing on-board fuel burn algorithms (i.e. ‘fuel burn’ as a function of the ‘flight time’, and ‘flight duration’ as a function of the ‘fuel burn’), and eliminates the restrictions presently imposed on the maximum length of a level-flight cruise segment (50 to 100 Nm) by the existing FMS algorithms(Reference Liden1,Reference Liden2) .
As illustrated in Fig. 7, each level-flight cruise flight path segment starts at a gross weight value equal to that at which the climb flight path or a step-climb flight path reaches the corresponding cruise altitude and ends at a gross weight value equal to that at which the immediately succeeding step-climb or descent flight path reaches the same cruise altitude.
The set of parameters that characterises a level-flight cruise vertical path segment may include:
• Altitude;
• Initial and final gw, cg, and fuel weight;
• IAS/Mach and TAS values;
• Segment's flight time and fuel burn; and
• Segment's still-air horizontal distance.
3.7 The vertical flight path look-up structure and the vertical flight path graph
The assembly of climb, cruise, and descent flight path segments’ performance data can be compiled into a look-up structure. The sets of climb-in cruise and descent paths are organised sequentially, in a reverse order of the gross weight at the start of the vertical flight path (minimum cruise altitude and the EOD, respectively), similar to the usual aircraft's gross weight reduction along a flight path.
The global topological relationships between the climb, cruise, and descent paths (as well as the corresponding path segments) can be described using the vertical flight path graph. Its nodes (Fig. 7) are represented by the gross weight–altitude binomials corresponding to the T/O, TOC, TODs, and the EODs, as well as by all the ‘intersection’ points between the pre-computed cruise vertical flight paths (level flight and step-climb). These intersection points are situated in the cruise phase, between the TOC and the TODs, at altitude multiples of 1,000 ft.
A succinct representation of the succession of steps employed for the construction of the vertical flight path look-up structure and the vertical flight path graph is presented in Fig. 13.
The vertical flight path look-up structure and vertical flight path graph computing workflow.

For any flight phase, given an aircraft's vertical flight plan position defined by an altitude and gross weight, the vertical flight plan graph provides a way for detecting whether that position is situated at a graph node or on an edge and consequently, the number and type of vertical path segments that can be employed for building the subsequent vertical and lateral flight path segment. It also facilitates the detection of the transition points from one flight phase to the next. For example, the graph node corresponding to the TOC designates the transition point from climb mode to cruise. Similarly, upon reaching any graph node corresponding to a TOD, its set of parameters can be used by itself or in conjunction with other parameters (such as the distance to the EOD/destination airport) to decide whether the exploration of a ‘descent path’ is appropriate.
Once the vertical path segment is selected, the vertical flight path graph facilitates the retrieval of the corresponding performance information from the vertical flight path look-up structure, either as general segment description data (say for the entire descent segment as a whole) or as detailed segment description data (say for the set of data of each sub-segment composing the selected descent vertical flight path).
The two sets of data describing the ensemble of available vertical path segments also allow the construction of a complete stand-alone vertical flight plan and the computation of the corresponding set of altitudes, still-air distances, flight times, fuel burns, and flight costs. The construction of the vertical flight plan may also target specific goals including flight time, fuel burn, or flight cost minimisation. However, knowing that such a vertical flight plan is constructed for still-air conditions, its suitability for the construction of the final lateral and vertical flight plan is dependent on the flight's particular navigation (composing segments’ lengths and headings), and wind conditions. Nonetheless, the ability to construct and evaluate such profiles may provide useful insight regarding the relationship between the criteria used for the selection of a vertical flight path and an aircraft's performance, configuration, and navigation conditions.
3.8 The vertical and lateral flight plan computation using the vertical flight plan look-up structure and the vertical flight plan graph
The proposed method considers that the vertical flight path look-up structure and graph are employed in a scenario in which the full vertical and lateral flight plan parameters are computed in a manner similar to the scenario considered by the existing on-board algorithms, one segment at a time, from the aircraft's actual position to the destination airport. The performance parameters of the vertical flight plan segments, however, are not recalculated at every reconstruction/evaluation of the corresponding flight plan segments. Instead, the segment's performance parameters are extracted from the look-up structure and processed along with the corresponding lateral navigation and wind data to determine the full vertical and lateral flight path description (flight plan).
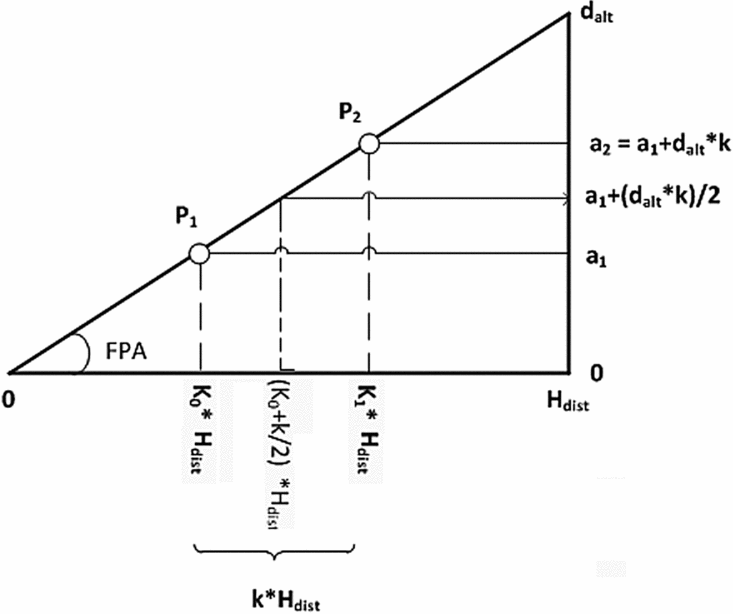
The flight plan computations may be performed with respect to the selected vertical flight path look-up structure segment's entire still-air horizontal distance (H dist), or for just a fraction (k) of it. For the climb, step-climb, and descent segments, the computations may also be performed relative to the look-up structure segment's entire altitude difference (d alt), or for just a fraction (k) of it. These computations allow the determination of the aircraft's parameters at a particular location or altitude on the flight plan.
The actual computation of the flight plan parameters for a fraction k of a look-up structure flight path segment depends on the type of the segment itself and takes advantage of the fact that the look-up structure and the composing segments were computed considering the linearity domains of the aircraft's performance model. Therefore, some of the fractional (k) still-air flight path segment parameters’ values (such as the fuel burn, altitude difference, and horizontal distance) are equal to the same fraction k values of the corresponding full-length still-air flight path segment's parameters. If the segment is flown at constant IAS/Mach, the final TAS is computed using the corresponding speed conversion equation as a function of the final altitude; the segment flight time is equal to the quotient between the segment's still-air distance fraction and its average TAS.
For the constant-speed climb segment example presented in Fig. 14, considering the fuelburn and H dist values retrieved from the look-up structure, the still-air performance parameters for the segment P1P2 (representing a k fraction of the entire constant speed climb segment) are computed as follows:
 $$\begin{equation}
{K_1} &=& {K_0} + k,
\end{equation}$$
 $$\begin{equation}
{P_1}{P_{2 - {\rm{hdist}}}} &=& k*{H_{{\rm{dist}}}},
\end{equation}$$
 $$\begin{equation}
{P_1}{P_{2 - {\rm{fuelburn}}}} &=& k*\;{\rm{fuelburn,}}
\end{equation}$$
 $$\begin{equation}
{P_1}{P_{2 - {\rm{dalt}}}} &=& k*{d_{{\rm{alt}}}},
\end{equation}$$
 $$\begin{equation}
{a_1} &=& {K_0}*{d_{{\rm{alt}}}},
\end{equation}$$
 $$\begin{equation}
{a_2} &=& {a_1} + k*{d_{{\rm{alt}}}},
\end{equation}$$
 $$\begin{equation}
{\hbox{\it TAS}}\_{P_2} &=& {\hbox{\it TAS}}({\hbox{\it IAS}}/Mach,{a_2}),
\end{equation}$$
 $$\begin{equation}
TA{S_{avg\_{P_1}{P_2}}} &=& {\hbox{\it TAS}}\left( {{\hbox{\it IAS}}/Mach,{a_1} + {d_{alt}}\frac{k}{2}} \right),
\end{equation}$$
 $$\begin{equation}
{t_{{\rm{still}} - {\rm{air}}\_{P_1}{P_2}}}& =& \frac{{{P_1}{P_{2 - {\rm{hdist}}}}}}{{TA{S_{avg\_{P_1}{P_2}}}*\cos \left( {{\hbox{\it FPA}}} \right)}} = \frac{{k*{H_{{\rm{dist}}}}}}{{TA{S_{avg\_{P_1}{P_2}}}*\cos \left( {{\hbox{\it FPA}}} \right)}},
\end{equation}$$
Example of fractional constant-speed climb segment performance computation.

‘Acceleration-in-climb’ and ‘deceleration-in-descent’ segments consider a uniform variation of the IAS/Mach. Consequently, the segment's final speed is calculated as a function of the initial and final IAS/Mach values, as well as of the fraction of the look-up structure flight path segment for which the computations are performed. The corresponding final TAS value is computed using the corresponding speed conversion equations. The flight time for the fraction of the segment is computed as the quotient between the actual still-air horizontal distance fraction and its average TAS.
Considering the look-up structure segment presented in Fig. 14, the acceleration-in-climb and deceleration-in-descent segments are characterised by an additional set of parameters: initial speed IAS0/Mach0, and final speed IASf/Machf, and thus the IAS/Mach speed variation dIAS/dMach. The IAS fractional segment's final and average speed values, and the flight time are computed using the following equations (similarly for Mach segments):
 $$\begin{equation}
{\hbox{\it IAS}}\_{P_1} &=& IA{S_0} + {K_0}*{d_{\scriptsize{\hbox{\it IAS}}}},
\end{equation}$$
 $$\begin{equation}
{\hbox{\it IAS}}\_{P_2} &=& {\hbox{\it IAS}}\_{P_1} + k*{d_{\scriptsize{\hbox{\it IAS}}}} = IA{S_0} + \left( {{K_0} + k} \right)*{d_{\scriptsize{\hbox{\it IAS}}}},
\end{equation}$$
 $$\begin{equation}
{\hbox{\it TAS}}\_{P_1} &=& {\hbox{\it TAS}}({\hbox{\it IAS}}\_{P_1},{a_1}),
\end{equation}$$
 $$\begin{equation}
{\hbox{\it TAS}}\_{P_2} &=& {\hbox{\it TAS}}({\hbox{\it IAS}}\_{P_2},{a_2}),
\end{equation}$$
 $$\begin{equation}
IA{S_{avg\_{P_1}{P_2}}} &=& {\hbox{\it IAS}}\_{P_1} + \frac{{k*{d_{\scriptsize{\hbox{\it IAS}}}}}}{2},
\end{equation}$$
 $$\begin{equation}
TA{S_{avg\_{P_1}{P_2}}} &=& {\hbox{\it TAS}}\left( {IA{S_{avg\_{P_1}{P_2}}},{a_1} + {d_{{\rm{alt}}}}\frac{k}{2}} \right),
\end{equation}$$
 $$\begin{equation}
{t_{{\rm{still}} - {\rm{air}}\_{P_1}{P_2}}}& =& \frac{{{P_1}{P_{2 - {\rm{hdist}}}}}}{{TA{S_{avg\_{P_1}{P_2}}}*\cos \left( {{\hbox{\it FPA}}} \right)}} = \frac{{k*{H_{{\rm{dist}}}}}}{{TA{S_{avg\_{P_1}{P_2}}}*\cos \left( {{\hbox{\it FPA}}} \right)}}
\end{equation}$$
The final gw and cg values are computed using Equations (15) and (16).
For a level-flight constant-speed cruise segment the look-up structure data provides the values corresponding to the flying altitude, IAS/Mach speed, initial gross weight, fuelburn, TAS, still-air flight time, and horizontal distance. The corresponding (P1P2) fractional flight path segment parameters’ computation can be performed relative to a selected fraction (k) of the fuelburn value, flight time or still-air horizontal distance. The fuelburn-based computations are performed using Equations (13) and (14), where gw initial and gw final are replaced by the actual gross weight at the start and at the end of the fractional segment (gwP1 and gwP2, respectively). Thus,
 $$\begin{equation}
g{w_{P2}} = g{w_{P1}}\,{\rm{ + }}\,k^{\ast}{\rm{fuelburn}}
\end{equation}$$
For the fractional flight time or horizontal distance-based still-air computations, the relationship between the flight time and still-air horizontal distance is described by Equation (14), and therefore:
 $$\begin{equation}
{P_1}{P_2}_{ - {\rm{still}} - {\rm{air}} - {\rm{dist}}} = k*{H_{{\rm{dist}}}}
\end{equation}$$
and
 $$\begin{equation}
{P_{1}\,P_{2 -{\rm still} - {\rm air} - {\rm time}}} = k*{t_{{\rm{crz}} - {\rm{segm}} - {\rm{still}} - {\rm{air}}}}
\end{equation}$$
The final gw and fuelburn values are computed from the cruise fuelburn look-up tables(Reference Dancila, Botez and Labour30) as functions of the initial gw, altitude, and actual segment flight time:
 $$\begin{equation}
g{w_{P2}} = f\left( {al{t_{{\rm{crz}}}},g{w_{P1}},{P_1}{P_{2 - }}_{{\rm{still}} - {\rm{air}} - {\rm{time}}}} \right)
\end{equation}$$
For a selected fraction of a level-flight deceleration segment, situated between a TOD and the corresponding actual descent path, the horizontal flight distance and fuel burn values are equal to the same fractional value of the total segment's H dist and fuelburn found in the look-up structure. The computation of the flight path segment's complete set of still-air parameters is performed in a manner similar to that used for the climb-acceleration or descent-deceleration segments, using Equations (17)-(22) and (Reference Jensen, Hansman, Venuti and Reynolds26)-(32), where d alt = 0. The final gw and cg values are computed using Equations (15) and (16). The final speed, average segment speed, and actual segment flight time are computed considering a uniform deceleration relative to the aircraft's IAS/Mach.
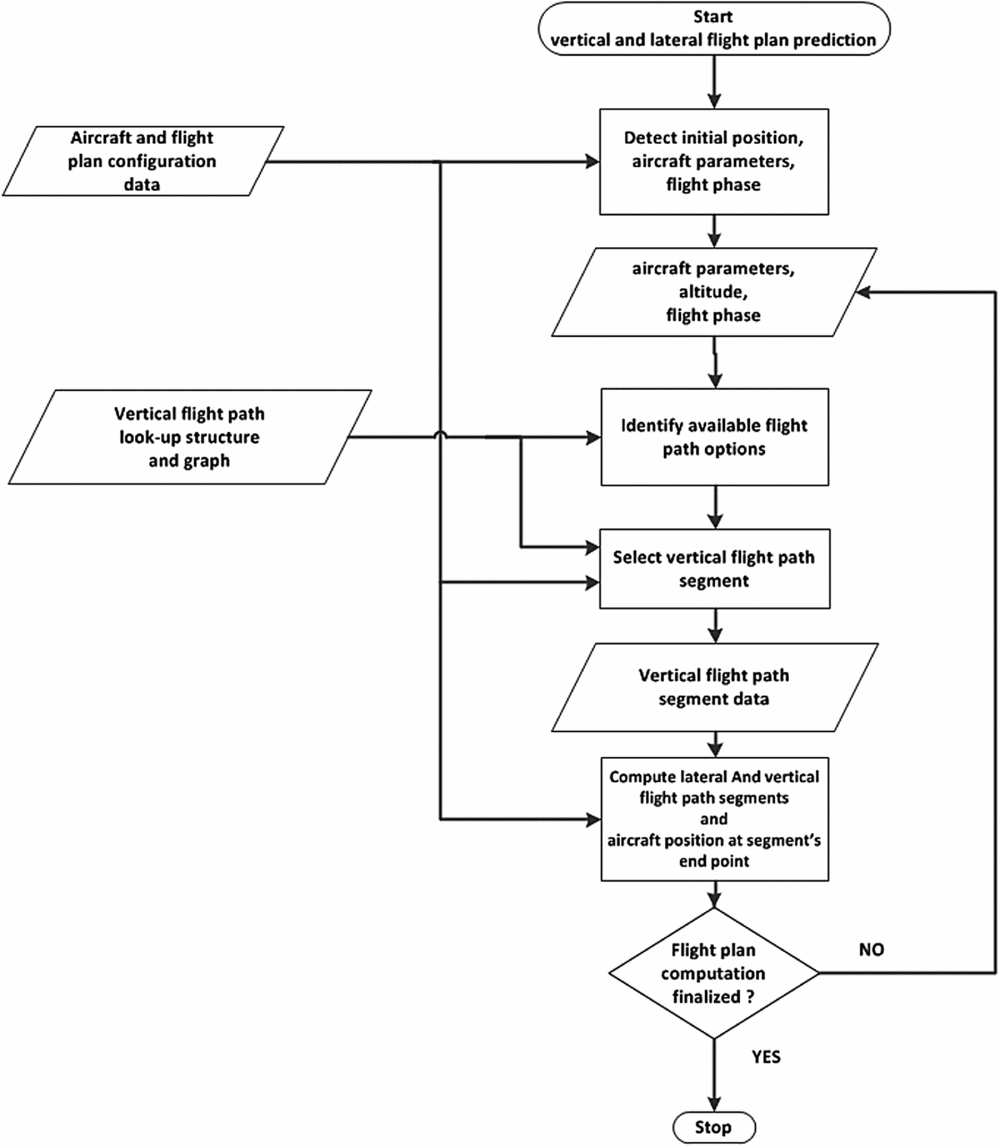
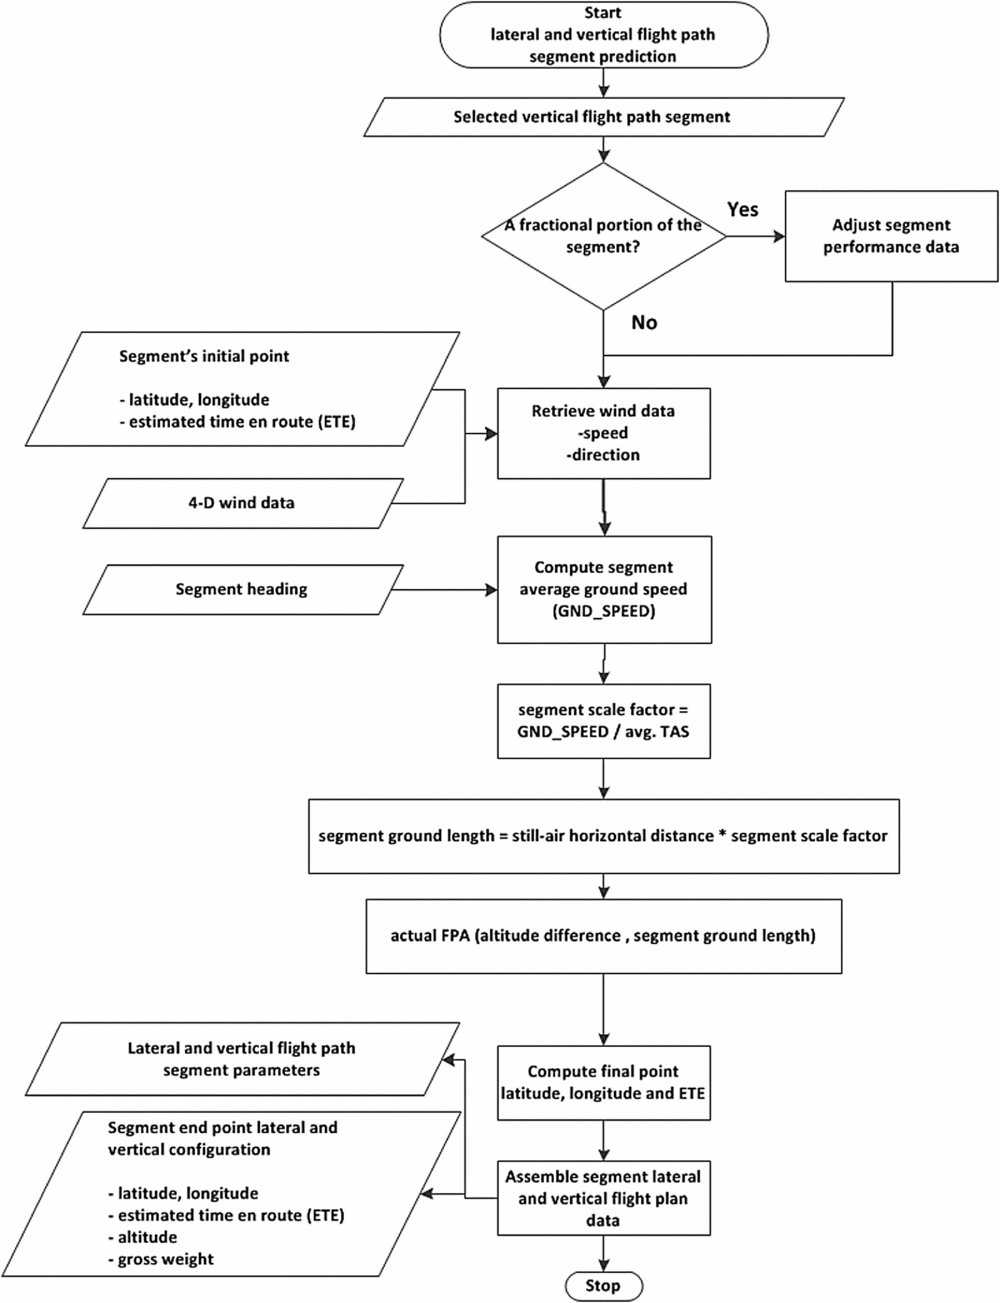
Figure 15 presents a simplified description of a typical use of the vertical flight path graph and look-up structure, and Fig. 16 presents the processing steps employed for the translation of the vertical path segment data into lateral and vertical flight plan segment data.
The flight plan computation workflow.

The flight plan segment's computation workflow.

4.0 RESULTS
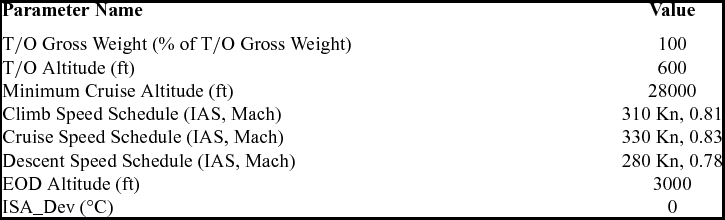
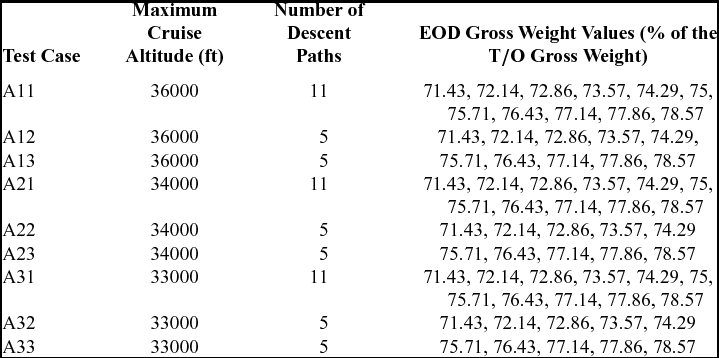
The method described in this paper was investigated using a performance model dependent upon the centre-of-gravity position on nine test scenarios corresponding to flight plans connecting the T/O and EOD points. The principal objective was the determination of the characteristics and parameters of the resulting flight envelopes, and the influence of the number of cruise altitudes and descent paths on the flight envelope's performance; namely, the range of total flight times and still-air flight distances, and the vertical flight paths describing the minimum and maximum flight times and still-air flight distances. The nine scenarios, designated as A11, A12, A13, A21, A22, A23, A31, A32, and A33, shared the same aircraft take-off weight and balance configuration, minimum cruise altitudes, as well as speed schedules, and standard temperature deviation values. These scenarios employed three values of the maximum cruise altitude (three test cases for each maximum cruise altitude value), and three sets of End of Descent (EOD) gross weight values (identical for each maximum cruise altitude value). The set of configuration parameters for the nine test cases are presented in Tables 1 and 2.
The set of test configuration parameters common to all nine scenarios

The sets of test configuration parameters specific to each test case

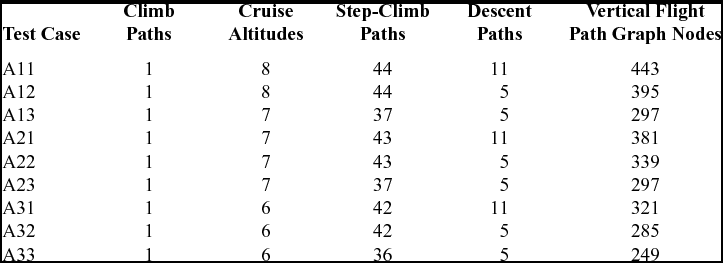
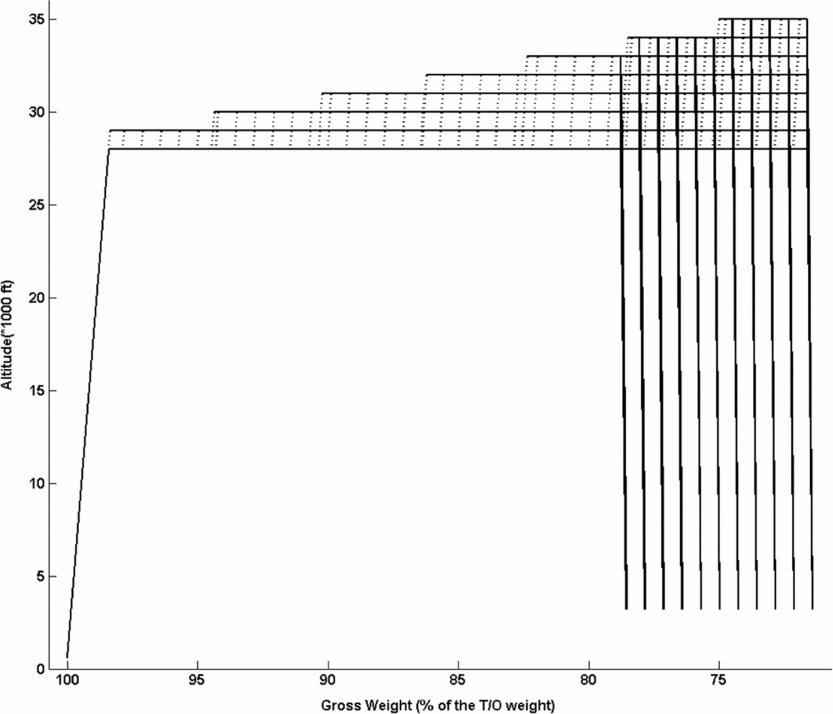
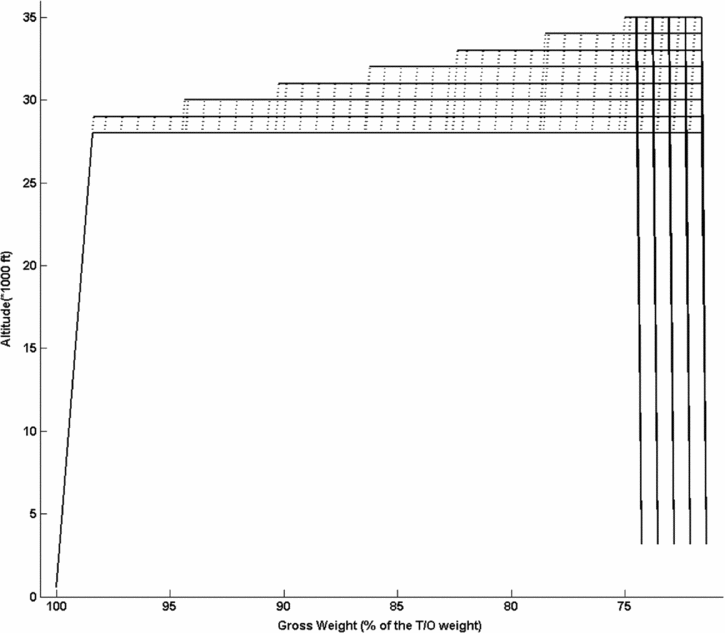
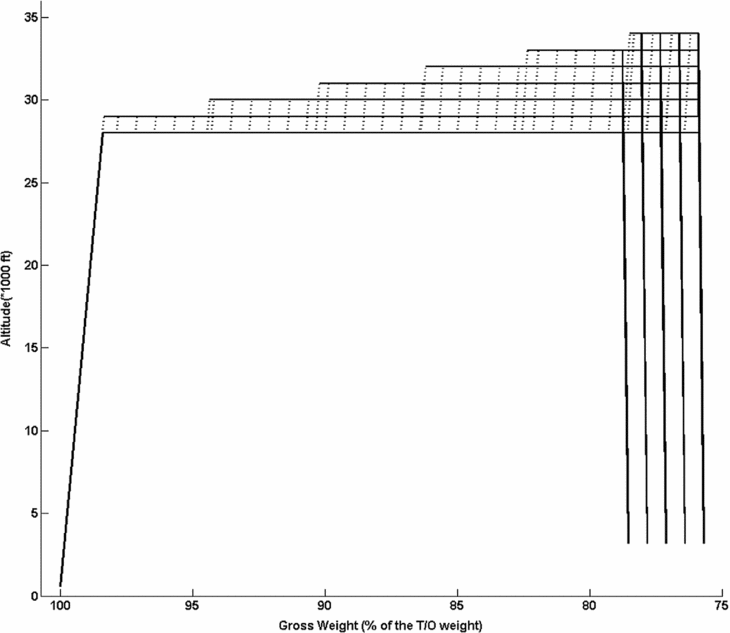
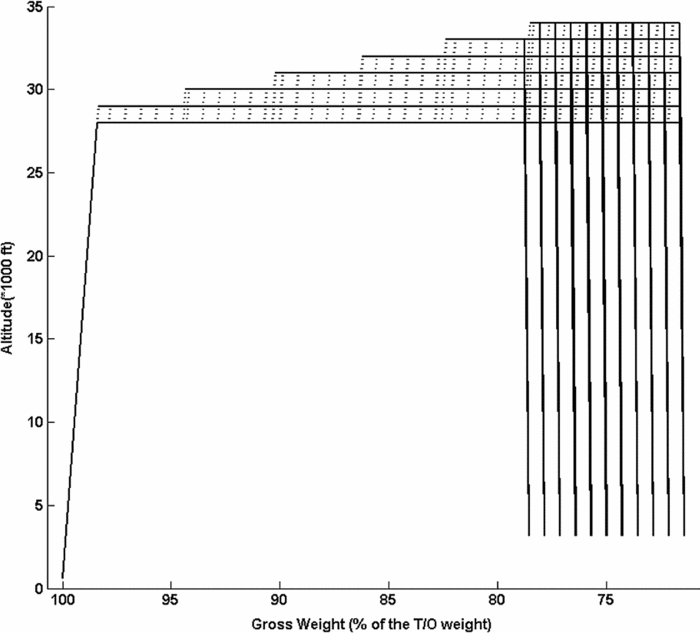
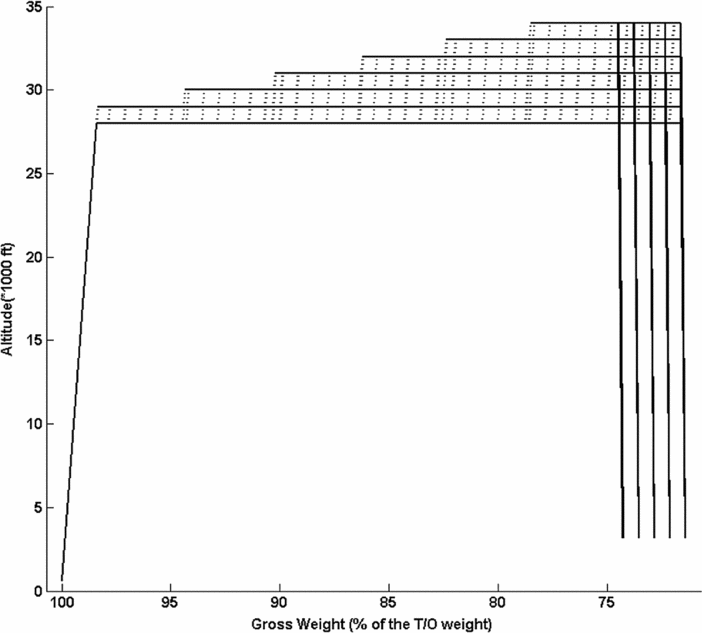
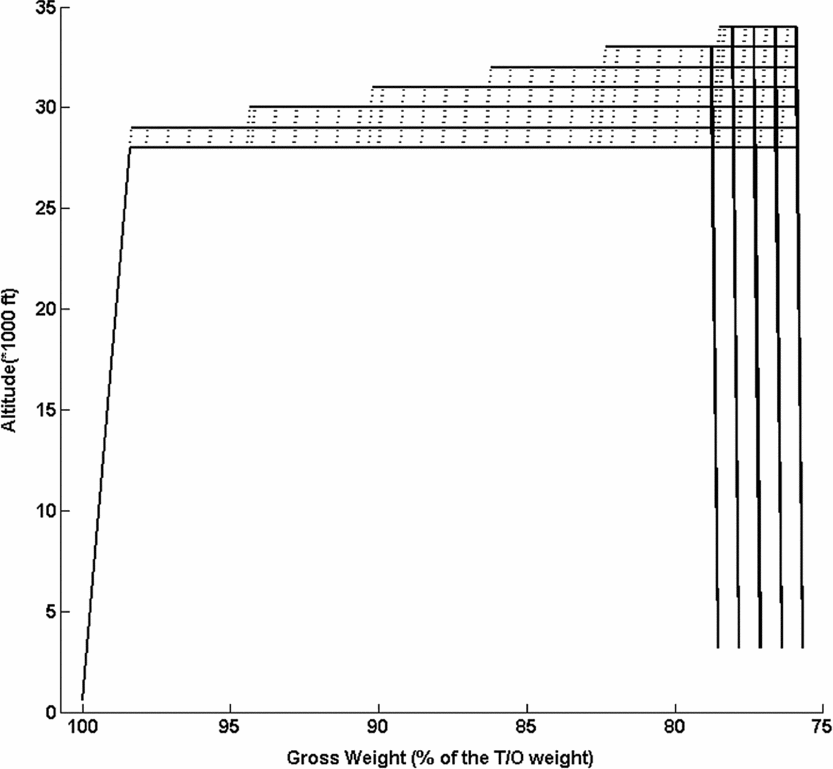
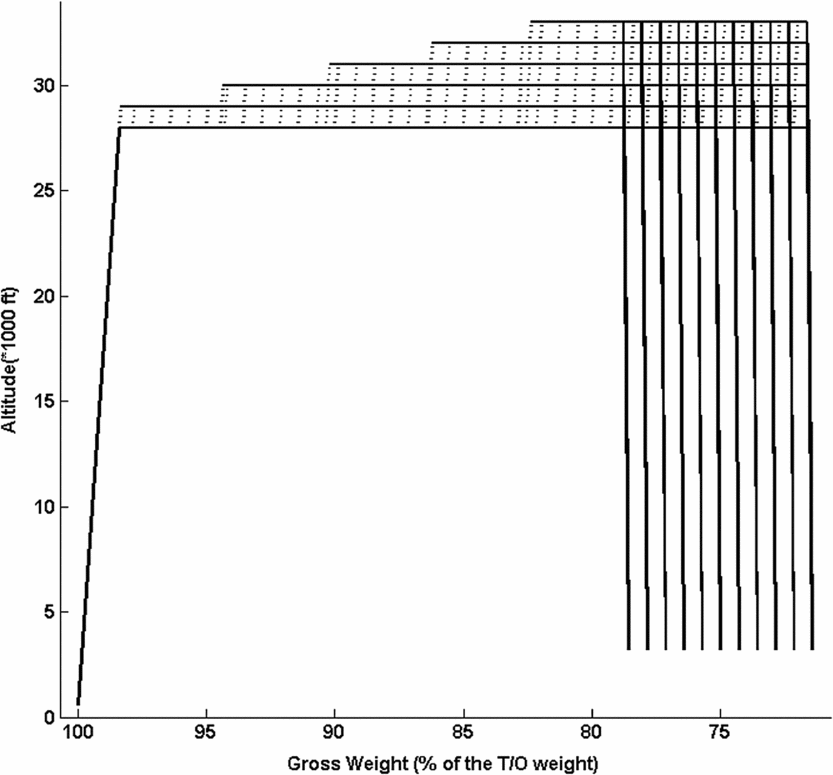
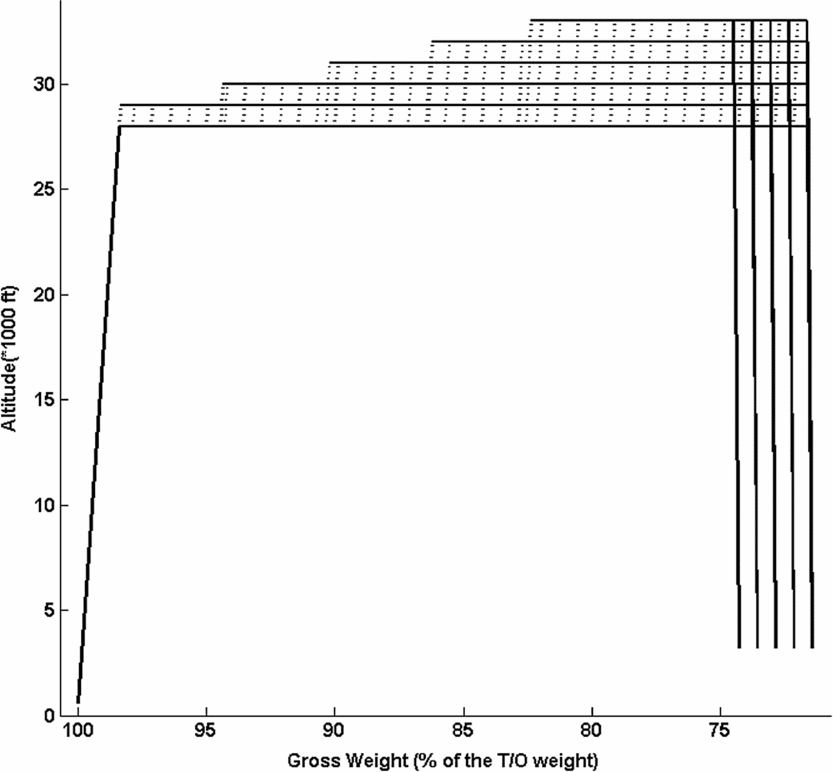
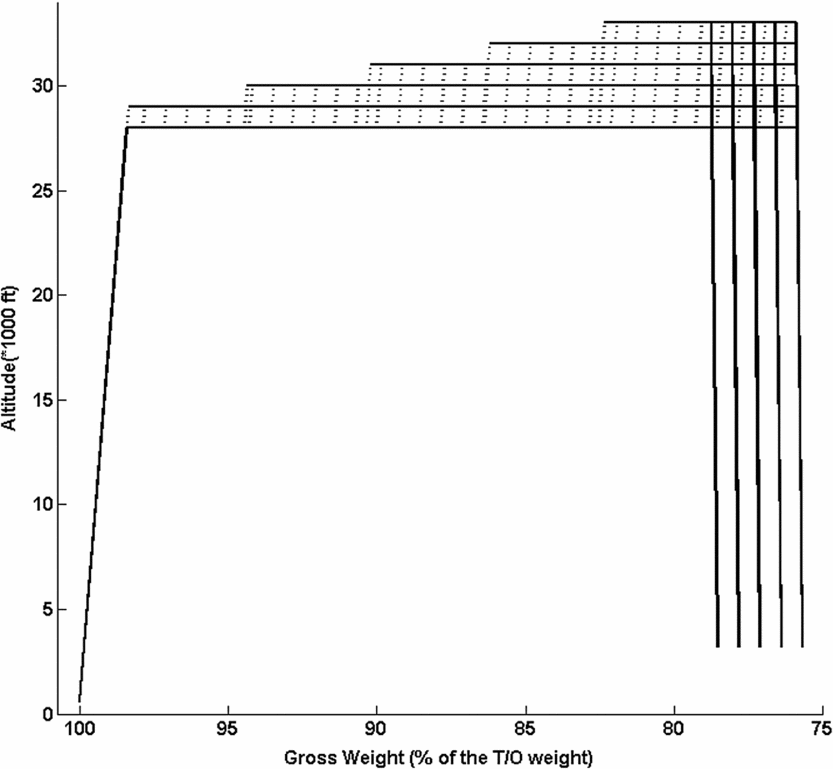
The topologies of the sets of flight paths described by the resulting vertical flight path look-up structures and vertical flight path graphs, calculated using the proposed methodology, are presented in Table 3. A graphical representation of the set of vertical flight paths stored in each vertical flight path look-up structure (and vertical flight path Graph) is presented in Figs. 17-25. It can be observed that for each case presented in Figs. 17-25 the set of paths composing the corresponding vertical flight path graph is similar to that described in Fig. 7: a climb path connecting the take-off to the minimum cruise altitude, a set of cruise constant altitude segments, a set of step-climb segments connecting each pair of consecutive cruise altitudes for a number of cruise gross weight configurations, and a set of descent segments connecting each cruise altitude to each of the landing/EOD altitude and gross weight configurations.
The topologies of the sets of flight paths described by the resulting vertical flight path look-up structures and vertical flight path graphs

Vertical flight path graphs corresponding to the vertical flight paths stored in the vertical flight path look-up structures: test case A11.

Vertical flight path graphs corresponding to the vertical flight paths stored in the vertical flight path look-up structures: test case A12.

Vertical flight path graphs corresponding to the vertical flight paths stored in the vertical flight path look-up structures: test case A13.

Vertical flight path graphs corresponding to the vertical flight paths stored in the vertical flight path look-up structures: test case A21.

Vertical flight path graphs corresponding to the vertical flight paths stored in the vertical flight path look-up structures: test case A22.

Vertical flight path graphs corresponding to the vertical flight paths stored in the vertical flight path look-up structures: test case A23.

Vertical flight path graphs corresponding to the vertical flight paths stored in the vertical flight path look-up structures: test case A31.

Vertical flight path graphs corresponding to the vertical flight paths stored in the vertical flight path look-up structures: test case A32.

Vertical flight path graphs corresponding to the vertical flight paths stored in the vertical flight path look-up structures: test case A33.

The data showed that, as expected, the values of the minimum cruise altitudes (selected as an input parameter) and maximum cruise altitudes (determined as function of the aircraft's configuration and performance) had an influence on the number of vertical flight path graph nodes. Moreover, they also showed that the selected number of descent paths, and more importantly their corresponding EOD gross weight values, had an important influence on the number of step-climb vertical flight paths and on the number of vertical path graph nodes.
The influence of the EOD gross weight values is twofold: first, as function of the aircraft's performance, the EOD GWs determine the maximum altitudes of the TODs, and thus the maximum cruise altitude (an example of maximum cruise altitude differences due to the EODs’ gross weight values’ selection is illustrated in Table 3 and Figs. 18-19, for test cases A12 and A13). Second, the set of TOD gross weight values determines the minimum gross weight at each cruise altitude, thus the vertical flight path look-up structure's (and vertical flight path graph's) total number of step-climb paths.
It can be observed that for test cases A11 and A12 (and similarly for test cases A21 and A22, or A31 and A32), the number of step-climb flight paths was identical although the number of descent flight paths was different. This can be explained by the fact that for the two test cases (similarly for the other two pairs of test cases), the EOD gross weight minimum values were identical, and thus the minimum gross weight values at each cruise altitude and, by consequence, the number of step-climb paths were also identical.
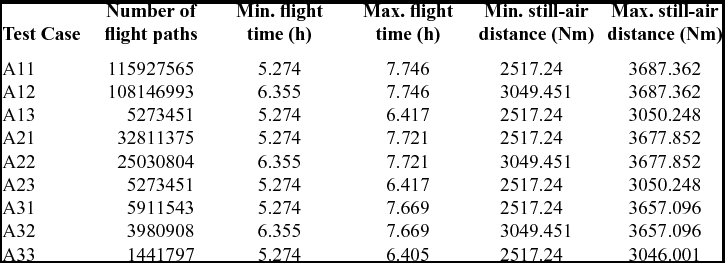
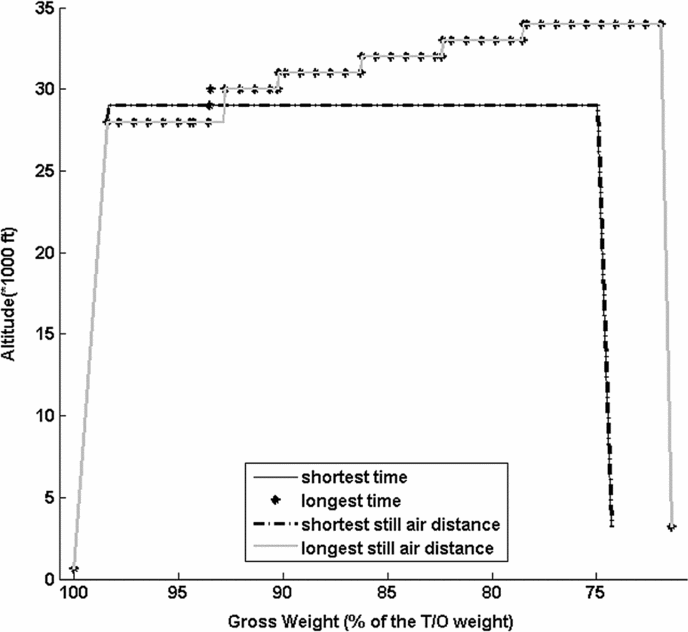
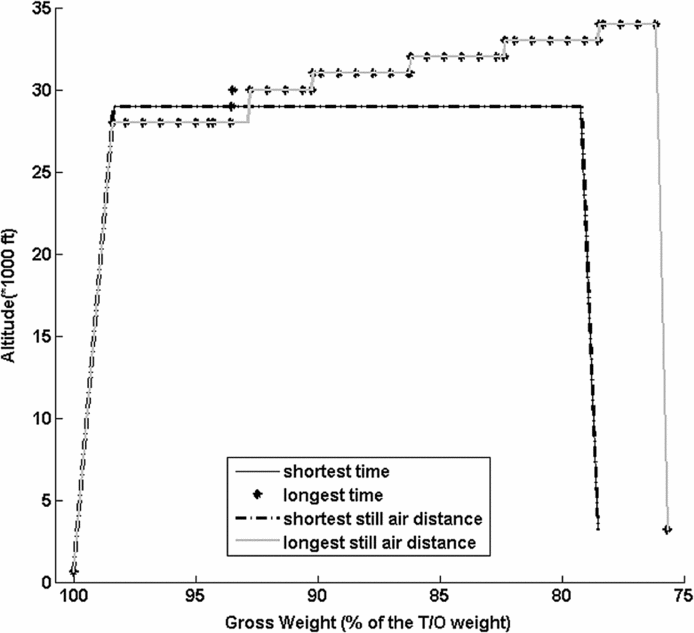
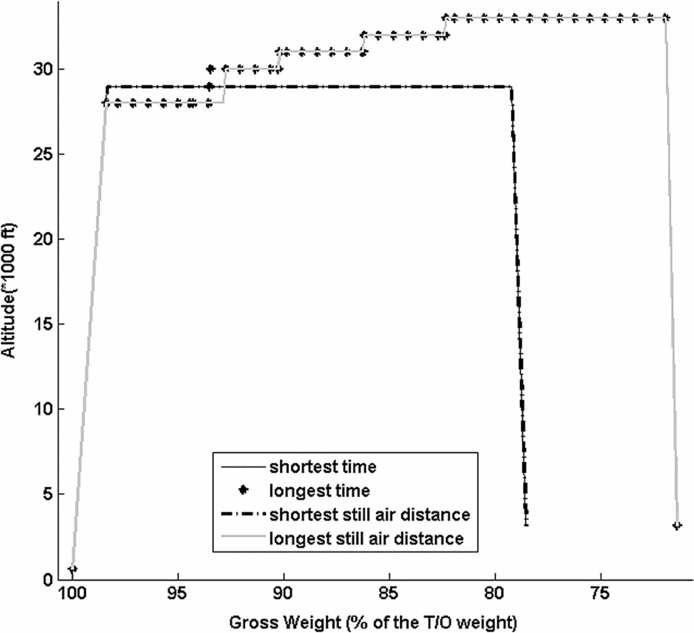
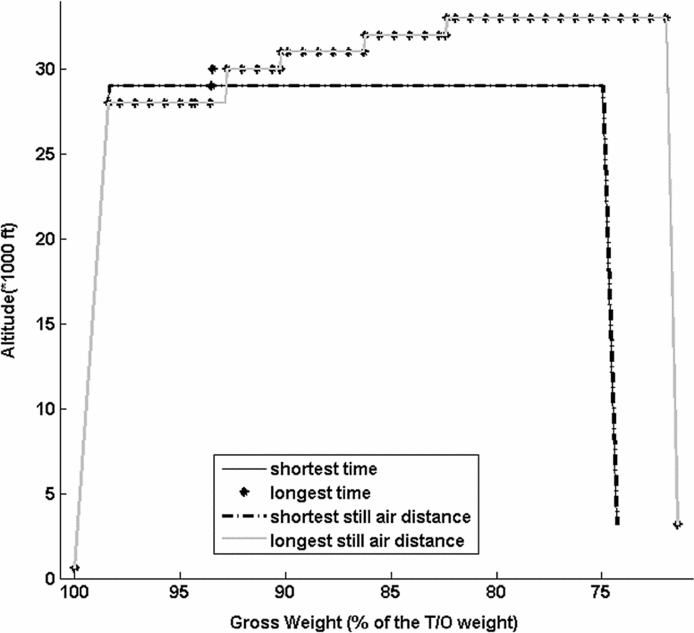
Subsequently, the investigation aimed to determine the total number of distinct flight paths that could be constructed using the vertical flight path graph, the minimum and maximum flight times and still-air distances, as well as the corresponding vertical flight path trajectories, using a ‘depth first’ exhaustive exploration of the vertical flight path graph. The results corresponding to each of the nine test cases investigated in this paper are presented in Table 4 and Figs. 26-34.
The vertical flight path graphs’ total number of flight paths, the minimum and maximum flight times and still-air distances

These results showed that, as expected, the total number of distinct flight paths described by a vertical flight path graph is directly dependent on the number of graph nodes and the graph's topology (the particular disposition of the graph nodes). Moreover, the parameters defining the graph topology (the number of cruise altitudes and the number of step-climb and descent paths) do not have the same influence in determining the total number of distinct flight paths. The parameter having the largest influence is the number of ‘step-climb’ flight paths, while the number of ‘descent’ flight paths has the least influence. This can be explained by the fact that the number of possible descent paths (as function of the combination of cruise altitude and EOD GW) is much smaller than the possible number of cruise flight paths (as function of the combination of constant speed level flight, and climb in cruise segments).
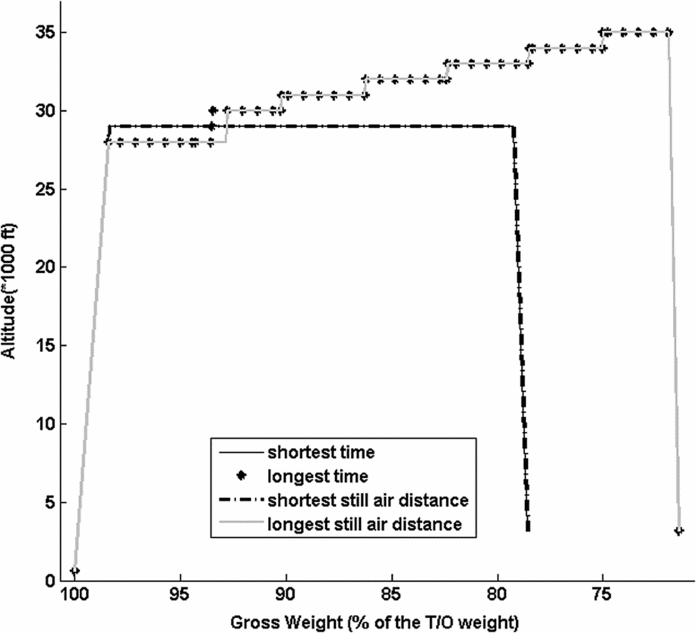
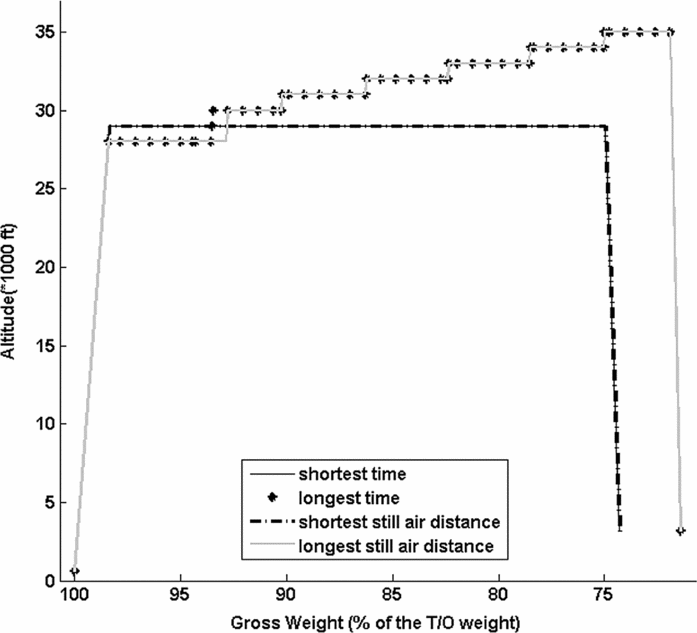
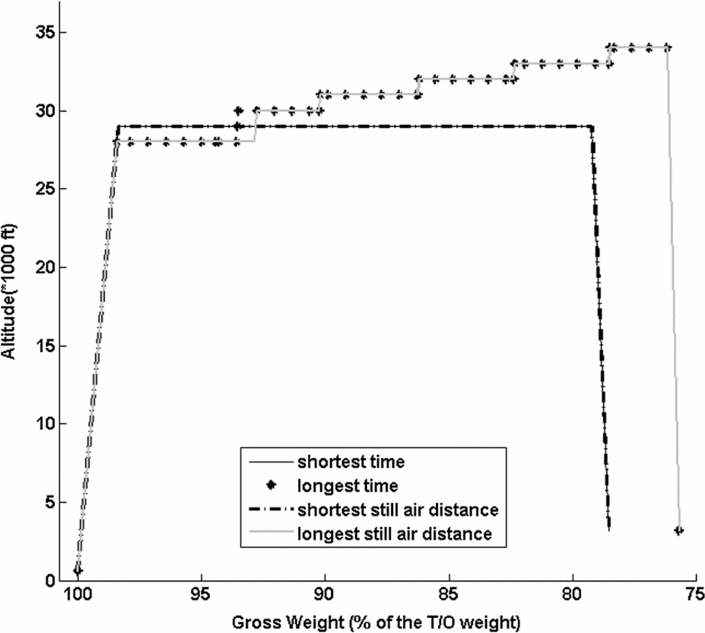
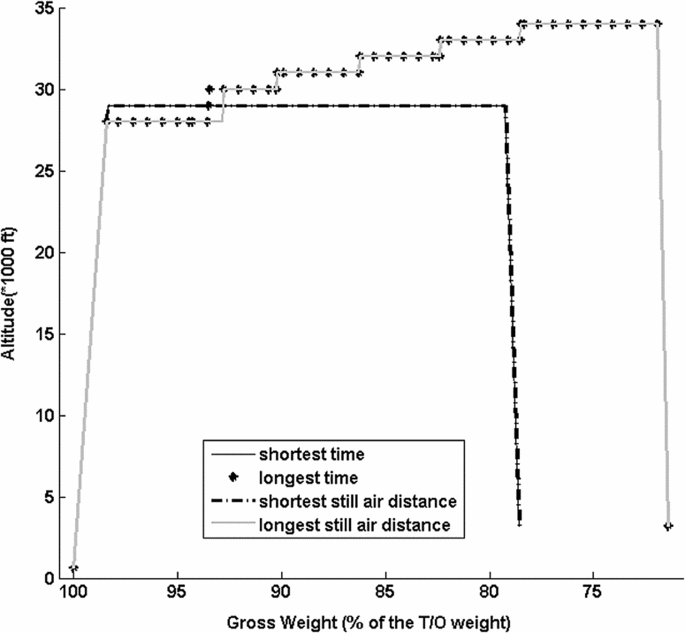
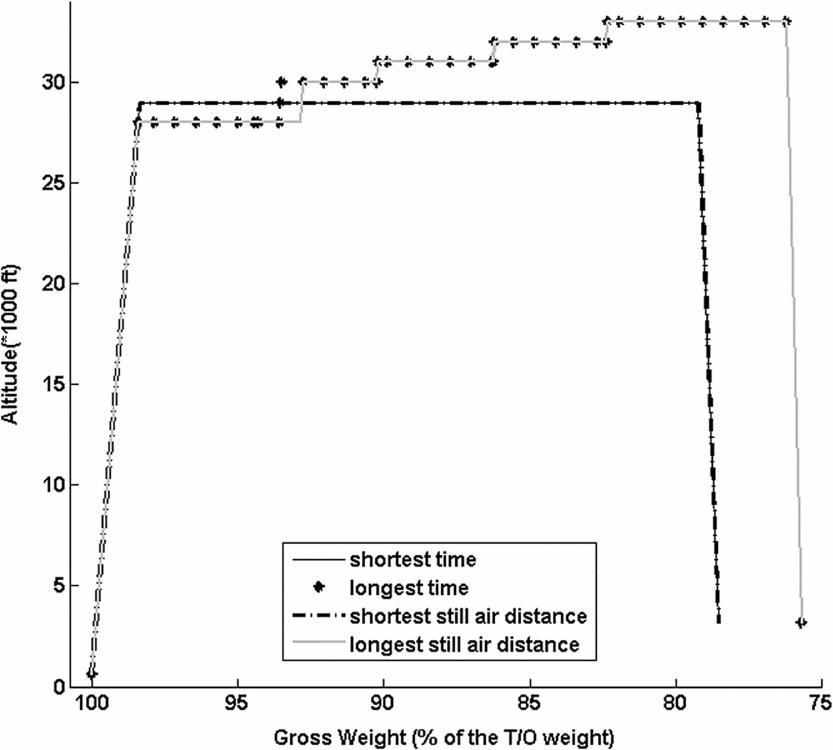
The analysis also showed that the minimum and maximum values of the flight time and still-air distance are dependent on the sets of cruise altitudes, cruise-in-climb flight paths, and EOD gross weight values composing the vertical flight path graph. Moreover, each of the four values were attained on corresponding flight paths, each path being composed of a particular combination of consecutive segments from the set of level-flight cruise, step-climb, and descent segments of the vertical flight path graph (Figs. 17-25), and described by the succession of the vertical flight path graph nodes delimiting these segments.
As illustrated in Figs. 26-34, for all test cases, the maximum flight times and still-air distances were attained on flight paths employing a number of step-climb segments leading to the maximum cruise altitude, and descents segments corresponding to the minimum EOD gross weight values (and thus, maximum fuel burn). The minimum flight times and still-air distances, on the other hand, were attained on flight paths employing a single step-climb to altitudes different than the maximum altitudes, and on descent paths ending at the maximum EOD gross weight values (and thus, minimum fuel burn). The two vertical profiles are generally different because of the fact that they employ different cruise altitude values; one cruise altitude value corresponds to the maximum fuel burn rate, and the other value corresponds to the minimum TAS. However, it can be observed that for the T/O configuration and the set of cruise altitudes used in this paper, the profiles for the minimum flight times and still-air distances were identical.
Vertical flight path profiles for the maximum and minimum flight-times and still-air distances: test case A11.

Vertical flight path profiles for the maximum and minimum flight-times and still-air distances: test case A12.

Vertical flight path profiles for the maximum and minimum flight-times and still-air distances: test case A13.

Vertical flight path profiles for the maximum and minimum flight-times and still-air distances: test case A21.

Vertical flight path profiles for the maximum and minimum flight-times and still-air distances: test case A22.

Vertical flight path profiles for the maximum and minimum flight-times and still-air distances: test case A23.

Vertical flight path profiles for the maximum and minimum flight-times and still-air distances: test case A31.

Vertical flight path profiles for the maximum and minimum flight-times and still-air distances: test case A32.

Vertical flight path profiles for the maximum and minimum flight-times and still-air distances: test case A33.

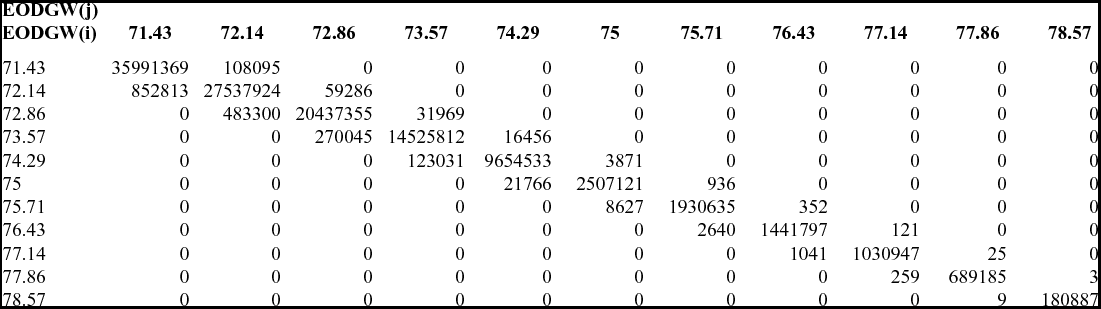
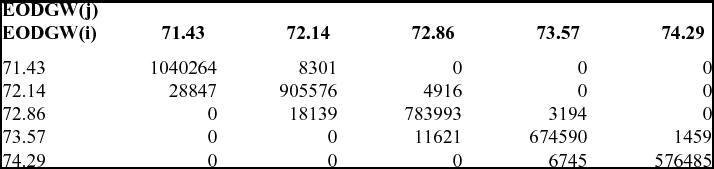
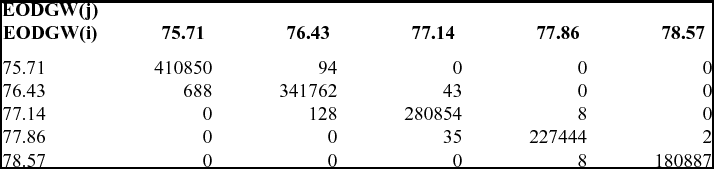
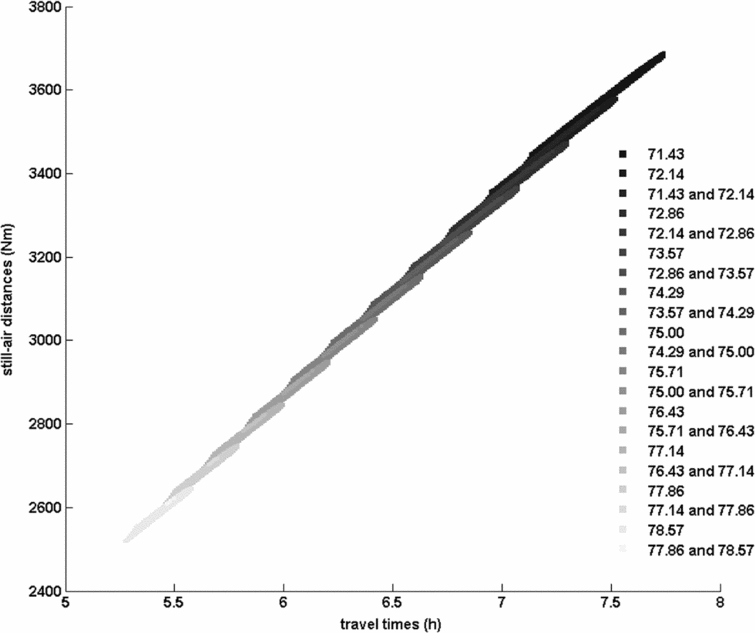
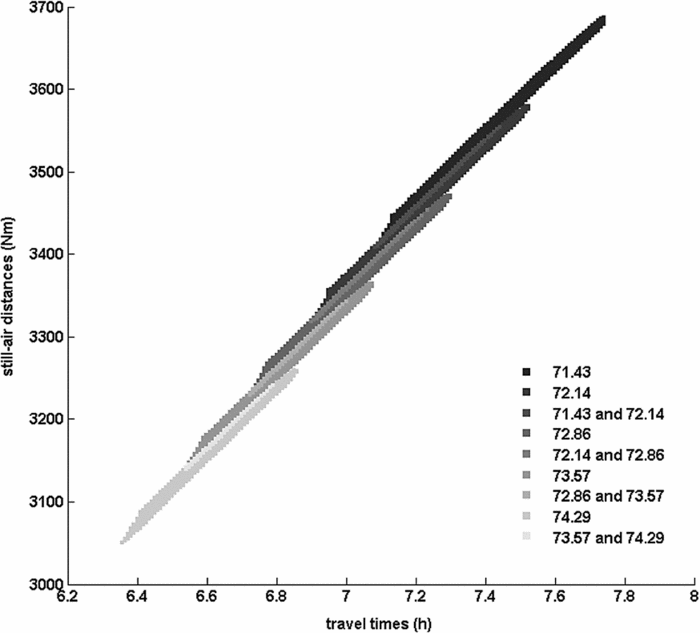
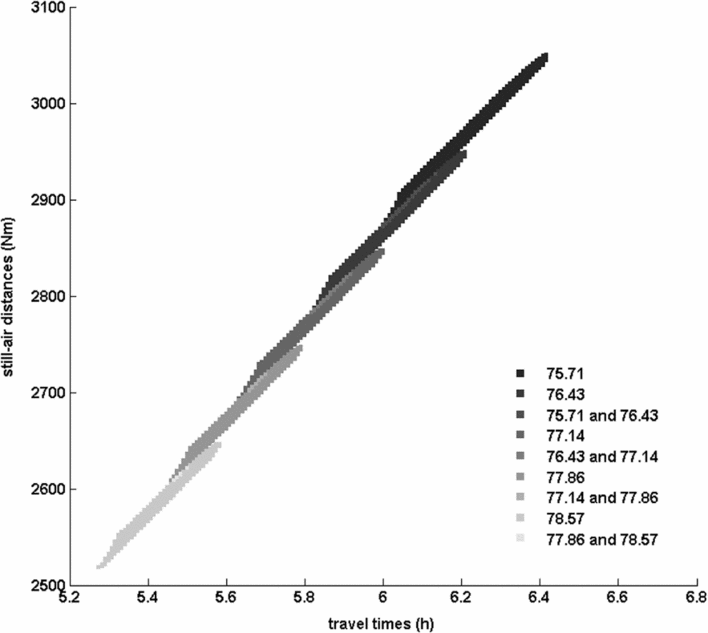
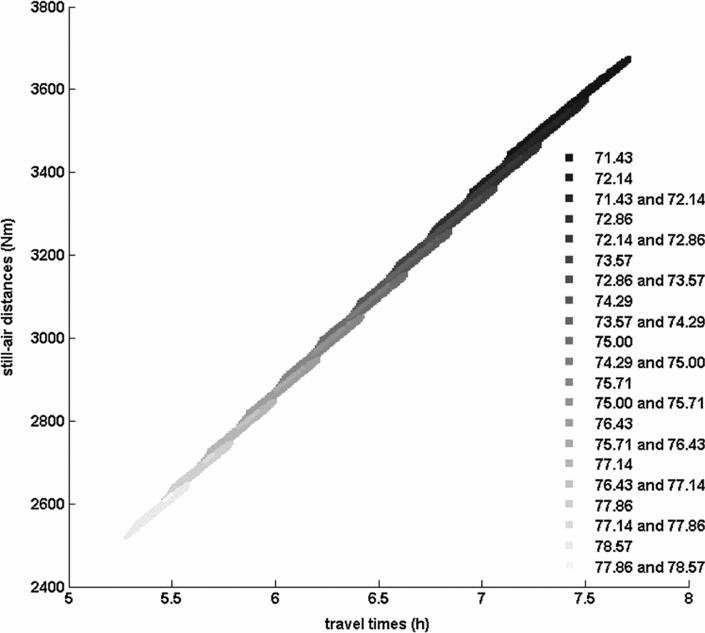
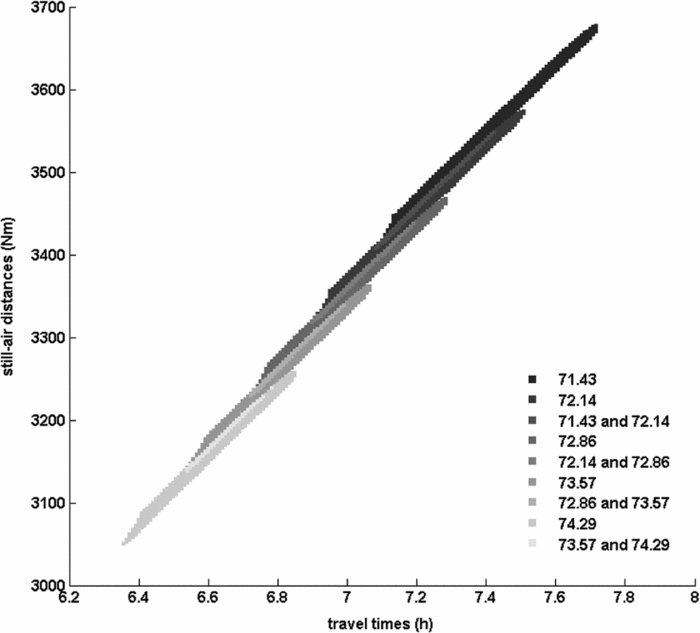
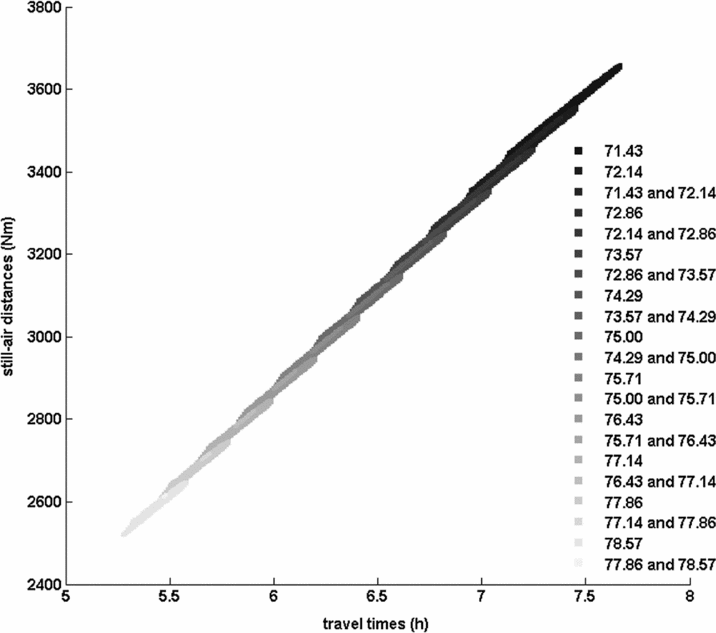
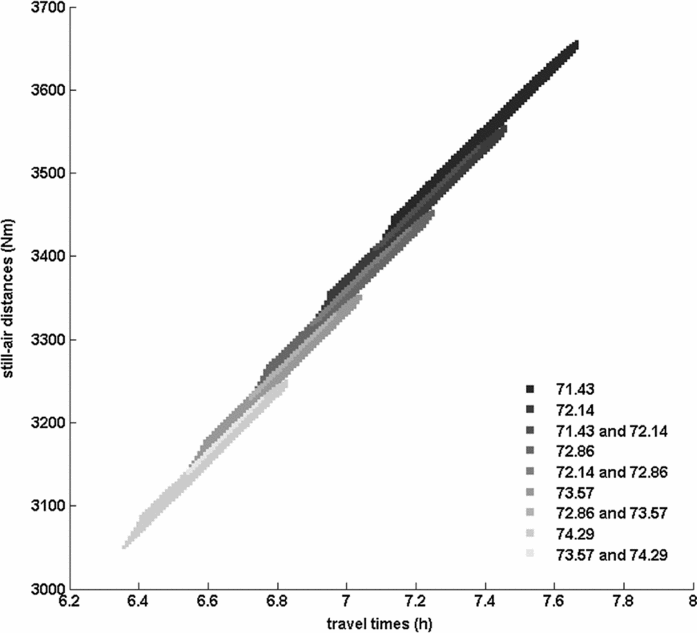
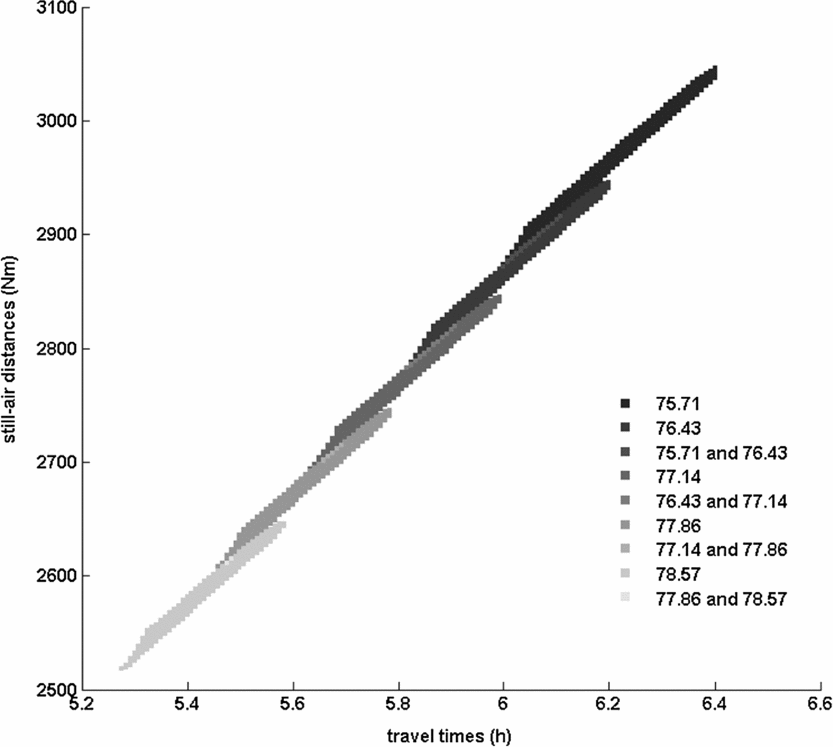
An additional point of interest was the investigation of the flight path's flight time and the still-air distance distribution as a function of the set of cruise altitudes (corresponding to each test case) and the EOD gross weight values. Consequently, for each test case, the corresponding range of flight times was decomposed into a set of 30-seconds intervals; the range of still-air distances was also decomposed into a set of 1 Nm intervals. Subsequently, an exhaustive exploration of the flight paths described by the vertical flight path graph was used to determine the number of flight paths leading to each sub-domain corresponding to a flight time and still-air distance interval as a function of the EOD gross weight value. A statistical analysis of the data allowed the identification of the flight time – still-air distance domain covered by the vertical flight path graph as a function of the EOD gross weight. Moreover, the statistical analysis provided the number of flight paths associated with each EOD gross weight, as well as the flight time – still-air distance domains attainable by flight paths corresponding to two or more EOD gross weight values. The results of the statistical analysis are presented in Tables 5-13 (one table per test case), and in Figs. 35-43.
Test case A11 –Statistical analysis of the number of vertical flight paths ending at an EOD gross weight that share the same flight time – still-air flight distance domain with vertical flight paths ending at each EOD gross weight, function of the EOD gross weight

Test case A12 – Statistical analysis of the number of vertical flight paths ending at an EOD gross weight that share the same flight time – still-air flight distance domain with vertical flight paths ending at each EOD gross weight, function of the EOD gross weight

Test case A13 – Statistical analysis of the number of vertical flight paths ending at an EOD gross weight that share the same flight time – still-air flight distance domain with vertical flight paths ending at each EOD gross weight, function of the EOD gross weight

Test case A21 – Statistical analysis of the number of vertical flight paths ending at an EOD gross weight that share the same flight time – still-air flight distance domain with vertical flight paths ending at each EOD gross weight, function of the EOD gross weight

Test case A22 – Statistical analysis of the number of vertical flight paths ending at an EOD gross weight that share the same flight time – still-air flight distance domain with vertical flight paths ending at each EOD gross weight, function of the EOD gross weight

Test case A23 – Statistical analysis of the number of vertical flight paths ending at an EOD gross weight that share the same flight time – still-air flight distance domain with vertical flight paths ending at each EOD gross weight, function of the EOD gross weight

Test case A31 – Statistical analysis of the number of vertical flight paths ending at an EOD gross weight that share the same flight time – still-air flight distance domain with vertical flight paths ending at each EOD gross weight, function of the EOD gross weight

Test case A32 – Statistical analysis of the number of vertical flight paths ending at an EOD gross weight that share the same flight time – still-air flight distance domain with vertical flight paths ending at each EOD gross weight, function of the EOD gross weight

Test case A33 – Statistical analysis of the number of vertical flight paths ending at an EOD gross weight that share the same flight time – still-air flight distance domain with vertical flight paths ending at each EOD gross weight, function of the EOD gross weight

Vertical flight paths’ flight-time and still-air distance domain distribution as function of the EOD gross weight value: test case A11.

Vertical flight paths’ flight-time and still-air distance domain distribution as function of the EOD gross weight value: test case A12.

Vertical flight paths’ flight-time and still-air distance domain distribution as function of the EOD gross weight value: test case A13.

Vertical flight paths’ flight-time and still-air distance domain distribution as function of the EOD gross weight value: test case A21.

Vertical flight paths’ flight-time and still-air distance domain distribution as function of the EOD gross weight value: test case A22.

Vertical flight paths’ flight-time and still-air distance domain distribution as function of the EOD gross weight value: test case A23.

Vertical flight paths’ flight-time and still-air distance domain distribution as function of the EOD gross weight value: test case A31.

Vertical flight paths’ flight-time and still-air distance domain distribution as function of the EOD gross weight value: test case A32.

Vertical flight paths’ flight-time and still-air distance domain distribution as function of the EOD gross weight value: test case A33.

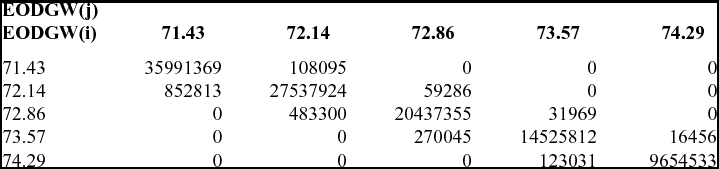
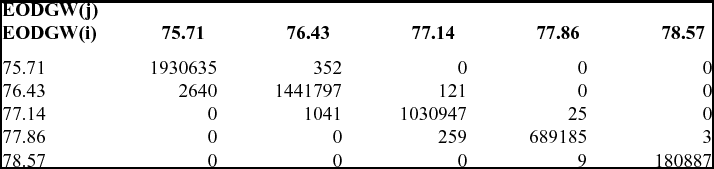
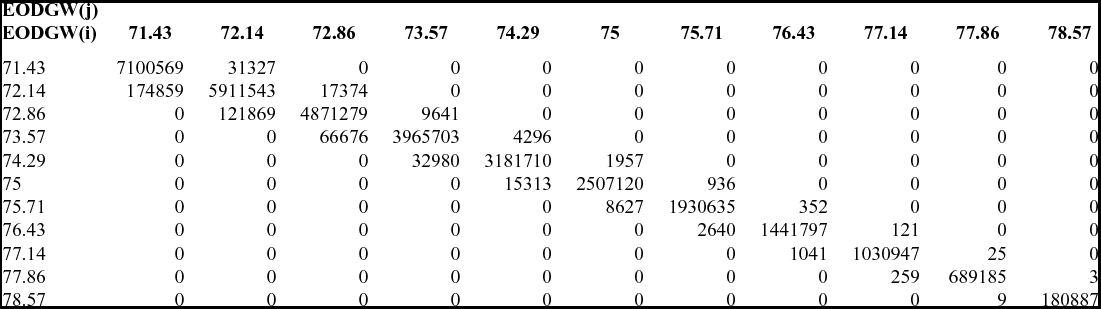
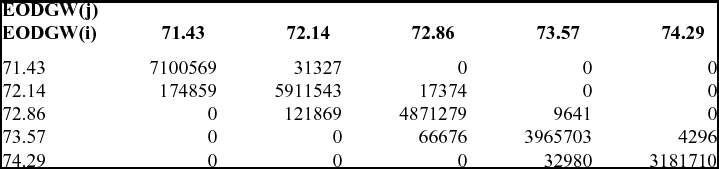
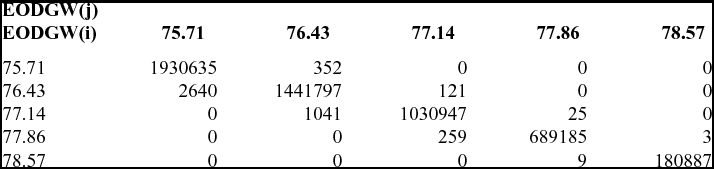
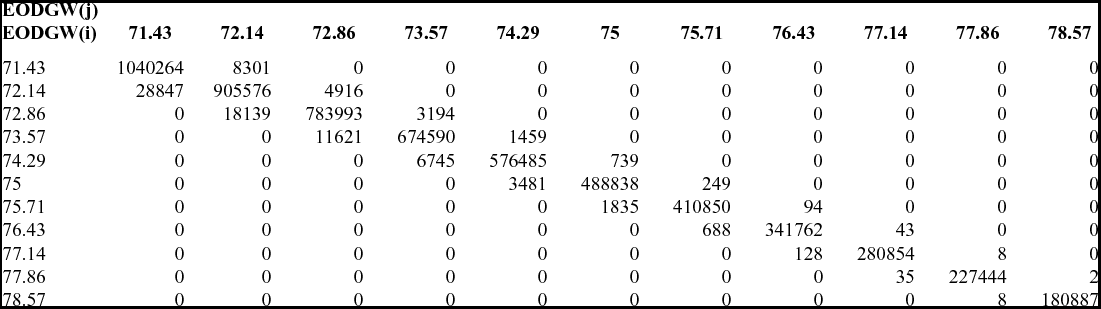
In each of the nine tables (Tables 5-13), each cell C(i, j) of a row i describes the number of vertical flight paths that the flight time – still-air distance domain corresponding to EOD(i) shared with the flight time – still-air distance domain corresponding to EOD(j). For i = j, C(i, j) describes the total number of vertical flight paths corresponding to EOD(i). As each of the three sets of test cases (A1x, A2x, and A3x) described a different set of cruise altitudes, a comparison of the data tables depicts the variation of the number of vertical flight paths corresponding to each EOD gross weight as function of the set of cruise altitudes. The plots presented in Figs. 35-43 illustrate, for each test case, the flight time – still-air distance domains covered by the sets of flight paths ending at each of the EODs defined by the corresponding look-up structure. The plots presented in Figs. 35-43 also illustrate, for each test case, the flight time – still-air distance domains common to pairs of EODs corresponding to consecutive gross weight values. These plots showed that, for each test case, the flight time – still-air distance domain covered by the ensemble of flight paths corresponding to all EODs defined in the corresponding look-up table did not have discontinuities. Moreover, each EOD flight time – still-air distance domain presented areas which overlapped with the domains corresponding to the adjacent EODs (identified distinctively in each test case plot).
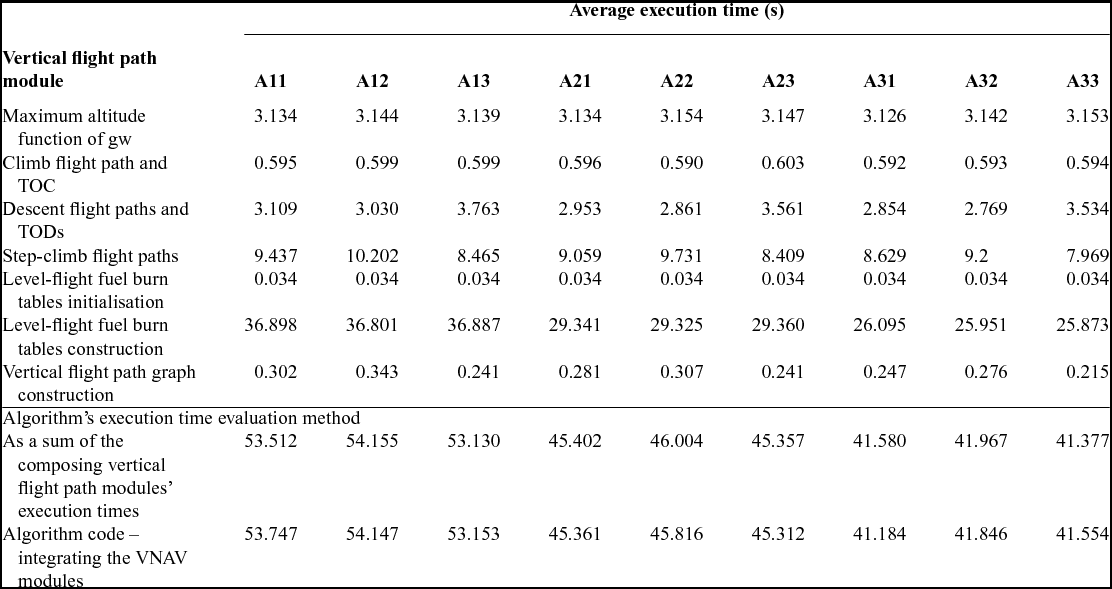
An investigation regarding the values of the total time required for the generation of the vertical flight path look-up structures and the vertical flight path graphs using the same aircraft and flight plan configurations as depicted in Tables 1-3 and Figs. 17-25, as well as their decomposition as a function of the processing module are presented in Table 14. The processing times correspond to a code developed in Matlab and executed on an AMD Phenom(tm) II X4, 2.80 GHz platform.
Vertical flight path modules’ and total average execution times (in seconds)

Most of the processing time (approximately 62% to 69.4% of the total processing time) was consumed for the generation of the level-flight fuel burn tables. Although this is a large proportion, this time is spent only once, and advanced generation strategies may reduce its overall impact on the construction and availability of the set of pre-computed vertical flight path segments.
The other two modules which required significant processing time were those computing the step-climb and the descent flight path segments, taking between 15.92% and 21.98%, and 5.7% and 8.5% of the total processing time, respectively. Knowing that their processing times were dependent on the selected number of step-climb and descent flight paths, a careful selection of their number and configurations would likely reduce the impact on the availability of the set of pre-computed vertical flight path data while ensuring the desired range of step-climb and descent vertical flight path options.
5.0 CONCLUSIONS
This paper presents a method for constructing a set of vertical flight path segments, assembled as a vertical flight path look-up structure and a corresponding vertical flight path graph, encompassing an aircraft's climb, cruise, and descent phases and covering the full range of altitudes allowed by an aircraft's performance envelope. This paper also describes the envisaged utilisation of the structure and graph for constructing a full lateral and vertical flight plan. The principal advantage of the proposed method over the existing flight plan computation algorithms is that it reduces the volume of repetitive resource-intensive calculations that use the aircraft performance model, limiting them to the construction of the look-up structure. This reduction is especially important for flight path optimisation, which entails repetitive computations and evaluations of the cost objective function values of a number of different flight paths. Another advantage is the availability, through the graph data, of advanced information (aircraft altitude and gross weight values) identifying critical points of the vertical flight plan (such as the TOC, the start of a step-climb segment, or a TOD), and the available options for constructing the vertical flight segments composing the flight paths.
The main limitation of this method is that the flight paths described by the look-up structure are constructed by considering only a single value of the temperature deviation, and the speed schedule for each of the three flight phases (climb, cruise, and descent). This limitation facilitated an initial evaluation of the look-up structure and vertical flight path graph computation complexity, and of the performance of the corresponding set of vertical flight paths. This limitation also facilitates the exploratory investigation of flight path optimisation algorithms employing a vertical flight path look-up structure and a vertical flight path graph, which is the object of a subsequent research and will be the subject of a distinct publication. The construction and performance of a vertical flight path look-up structure and vertical flight path graph encompassing multiple temperature deviation and speed schedule values may also be the subject of future research.
Another limitation is the fact that the range of step-climb and descent flight path segments available for the construction of a vertical flight plan are limited to those stored in the vertical flight path look-up structure. However, practical navigation constraints relative to the execution of consecutive step-climb manoeuverings presently restrict the actual number of step-climbs that can be employed during a flight. This limitation could therefore be diminished by a careful selection of the set of step-climb flight paths stored in the look-up structure.
The results of the investigation showed that the total number of distinct vertical flight paths that can be constructed using the set of vertical flight path segments stored in the look-up structure can be extremely large – up to more than 115.9 million (Tables 4-13). It must be noted, however, that some of these flight paths may not be usable on real flights due to practical limitations, such as the minimum flight time between two consecutive climb steps. The investigation also showed that this number is dependent on the topology of the vertical flight path graph, as the parameters determining it are (ordered according with their weight) – the number of climb-in cruise flight paths, the number of cruise altitudes and the number of descent flight paths.
The results indicate that for a given aircraft Take-Off (T/O) and flight plan configuration parameters, the number of step-climb flight paths is influenced by the minimal value in the set of the EOD gross weight values, given that it determines the minimal values of the TOD gross weight at each cruise altitude. They also show that the maximum flight time and still-air flight distance were attained on vertical flight plans employing a number of step-climbs leading to the maximum cruise altitude, and on the descent flight paths leading to the minimum EOD gross weight value (maximum fuel burn). The minimum flight time and still-air flight distance were attained on vertical flight plans employing a single cruise altitude and a descent flight path leading to the maximum EOD gross weight value (minimum fuel burn).
The results of the statistical analysis performed on each set of vertical flight paths, constructed using the vertical flight path look-up structures, have shown the influence of the number and range of the EOD gross weight values, as well as the influence of the range of cruise altitudes on the number of flight paths and the flight time/still-air distance distribution function of their EOD gross weight value. The results showed that the flight time/still-air distance domains of two sets of flight paths, corresponding to two EOD gross weight values, may intersect – the corresponding common range of flight times/still-air distances and the number of flight paths corresponding to each EOD gross weight value depending on the particular flight plan configuration parameters. The results indicated that for a given flight plan configuration, the flight time/still-air distance domain corresponding to an EOD gross weight value increases when the maximum cruise altitude increases and/or the EOD gross weight value decreases. For the set of configurations considered in this paper, the domains corresponding to an EOD gross weight described flight time ranges of between approximately 0.3 and 0.7 hours, and still-air flight distances between 150 and 250 Nm. A more advanced analysis may allow the identification of the relationship between the flight configuration parameters, EOD gross weight, and the corresponding domain's range of flight times and still-air distances, which in turn may allow the determination of the optimal number and set of EOD gross weight values as a function of the desired range of flight times and still-air distances.
The processing times required for generating the look-up structure and the vertical flight path graph are large compared to the times associated with the construction of a single vertical flight plan. However, the time required for retrieving the data from the look-up structure is much smaller than the actual calculation using the aircraft performance model and interpolation algorithms. In the context of multiple, repetitive flight plan computations, this time difference may result in significant processing time reductions. Moreover, a judiciously chosen set of flight paths and advanced generation strategies may further contribute to reducing the general computing times.
The availability of the vertical flight path data (look-up structure and graph) opens the way for the investigation of flight plan optimisation strategies and algorithms based on the vertical flight path graph exploration, namely the investigation and selection of the vertical flight plans that are bestsuited to achieve the flight time, fuel burn, or total cost objective as a function of the aircraft and flight plan configuration parameters. It also allows for the analysis of the influence of the lateral position of the start and destination points, and of the wind conditions in the selection of the optimal still-air vertical flight path profile.
ACKNOWLEDGEMENTS
The authors would like to thank to Messrs Yvan Blondeau, Rex Hygate, and Dominique Labour, CMC Electronics – Esterline, and the Green Aviation Research & Development Network (GARDN) for their support in conducting this research.