1. INTRODUCTION
Most dynamic economic theories, such as the efficient market hypothesis, the expectations hypothesis, consumption and tax smoothing, dynamic asset pricing, and more generally rational expectations, have implications on and only on the conditional mean dynamics of underlying economic variables (e.g., Cochrane, 2001; Sargent and Ljungqvist, 2002; Adda and Cooper, 2003). For example, dynamic asset pricing implies that the expectation of the pricing error given the information available to economic agents is zero for all assets. Although economic theory may suggest a nonlinear relationship for the conditional mean dynamics, it does not give a concrete functional form. Various models used in practice can be, at best, viewed as approximations to the underlying conditional mean dynamics. It is important to check conditional mean specification, because misspecification in mean can lead to misleading conclusions and suboptimal point forecasts. Indeed, specification testing for dynamic conditional mean models has become an integral part of the modern time series econometric model building practice (e.g., White, 1987; Wooldridge, 1990a, 1990b, 1991).
Hong and Lee (2005) recently proposed a class of generally applicable omnibus nonparametric tests for possibly nonlinear time series conditional mean models, without requiring any prior knowledge of possible alternatives. They used a suitable partial derivative of the generalized spectrum that focuses on the conditional mean dynamics. The generalized spectrum was first proposed in Hong (1999) as a new frequency domain analytic tool for nonlinear time series. It can capture both linear and nonlinear serial dependence and enjoys the nice features of spectral analysis. In particular, it incorporates information on serial dependence at all lags and can characterize cyclical dynamics caused by linear or nonlinear serial dependence. As a result, the Hong and Lee (2005) tests can detect a wide variety of conditional mean misspecifications in both functional form and lag structure. This differs from existing tests for time series conditional mean models, which assume a fixed lag order and focus on functional form specification. One important feature of time series modeling is that the conditioning information set usually contains an infinite number of lags (i.e., the entire past history), unless a Markovian assumption holds. Hong and Lee (2005) checked a large number of lags without suffering from the “curse of dimensionality.” Because they compared a nonparametric generalized spectral derivative estimator with a restricted counterpart implied by correct conditional mean specification, their tests can be viewed as a generalization of the Hausman (1978) methodology from a parametric context to a nonparametric time series context. Unlike Hausman (1978), however, Hong and Lee (2005) did not require that parameter estimators be asymptotically efficient under the null hypothesis.
Dynamic economic theory, although having implications on the conditional mean dynamics of an underlying economic process, is usually silent about its higher order conditional moment dynamics. There is a growing consensus among economists that the volatilities of most economic and financial time series are time-varying (e.g., Wooldridge, 1990a; Granger and Teräsvirta, 1993). Volatility clustering is a rule rather than an exception for most economic and financial time series. Moreover, recent studies (e.g., Gallant, Hsieh, and Tauchen, 1991; Hansen, 1994; Harvey and Siddique, 1999, 2000; Jondeau and Rockinger, 2003) documented time-varying conditional skewness and kurtosis of economic and financial time series. Time-varying higher order moments may be caused by (e.g.) correlated jumps or large sudden changes that occur occasionally. It is important to develop tests of the conditional mean models that are robust not only to conditional heteroskedasticity but also to time-varying higher order moments. Failure to accommodate these features will lead to distorted sizes (i.e., Type I errors) for the tests. The Hong and Lee (2005) tests are robust to conditional heteroskedasticity and all higher order conditional moments of unknown form. Thus, any conditional mean model can be subjected to testing without reestimating the model.
Hong and Lee (2005) only required estimation of the null conditional mean model, and parameter estimation uncertainty has no impact on the asymptotic distribution of their tests. Intuitively, parameter estimation uncertainty has an impact on the finite-sample distribution of the tests, and the degree of the impact depends on the number of estimated parameters associated with endogenous variables. For a parametric model, the number of estimated parameters is finite and fixed as the sample size T → ∞. As a result, the impact is at most an adjustment of a finite number of degrees of freedom. When the number of lags employed in the generalized spectral derivative tests is large (i.e., grows to infinity with T), the adjustment of a finite number of degrees of freedom becomes asymptotically negligible.
The asymptotic “nuisance parameter–free” property simplifies the implementation of the tests. Only the estimated model residuals are needed to implement the tests, and no specific estimation method is required. However, the sample sizes of most low-frequency economic and financial time series data are not large, whereas econometric time series models may contain a relatively large number of estimated parameters. Thus, the impact of parameter estimation uncertainty may not be trivial in small and finite samples. Indeed, our simulation studies show that the empirical sizes of the Hong and Lee (2005) tests deteriorate as the number of estimated autoregressive parameters increases. In particular, they tend to underreject, apparently because parameter estimation tends to make the estimated residuals look more like a martingale difference sequence (m.d.s.). This can be troublesome in practice, because underrejection makes it more difficult to detect neglected dynamic structure in mean in finite samples.
To deal with the underrejection problem, one could use a bootstrap procedure, which can take into account the impact of parameter estimation uncertainty. In the present context, naive bootstraps cannot be used, because under correct specification of the conditional mean model, the regression error is an m.d.s., which is not necessarily an independent and identically distributed (i.i.d.) sequence. For a non-i.i.d. sequence, the bootstrap can be complicated, because higher order serial dependence has to be preserved (Horowitz, 2003; Gonçalves and Kilian, 2004). In this paper, we propose a substantive modification to the Hong and Lee (2005) tests that can reduce the impact of parameter estimation uncertainty. This is achieved by using the Wooldridge (1990a) device, which is a convenient auxiliary regression that can effectively remove the impact of parameter estimation uncertainty of a parametric test statistic up to a higher order. By running an increasing sequence of auxiliary regressions, we can reduce the impact of parameter estimation uncertainty of the generalized spectral derivative tests. As a consequence, the finite-sample distribution of the tests is expected to be more robust to the number of estimated parameters.
As White (1994) pointed out, the Wooldridge (1990a) device generally renders a test unable to detect certain misspecification. This is also the case for our modified generalized spectral derivative tests. However, when the least squares estimator (or a Gaussian quasi–maximum likelihood estimator) is used, the modified generalized spectral derivative tests share the same consistency (i.e., asymptotic power one) property as the unmodified generalized spectral derivative tests, although the modified and unmodified test statistics, after being properly scaled, do not converge to the same probability limit under a fixed alternative. In this case, there is no asymptotic power loss for our modified tests, but their sizes have been significantly improved. This is confirmed in our simulation studies.
Section 2 introduces hypotheses of interest and modified generalized spectral derivative tests and also provides heuristics on how the Wooldridge (1990a) device can improve the asymptotic normal approximation of the generalized spectral derivative tests. Section 3 derives the asymptotic distribution of the modified tests, and Section 4 investigates their asymptotic power property under a general fixed alternative. In Section 5, we compare the finite-sample performances of the modified and unmodified generalized spectral derivative tests. Section 6 concludes. All proofs are collected in the Appendix. The GAUSS code for implementing our modified tests is available from the authors upon request. Throughout, we use C to denote a generic bounded constant, ∥·∥ the Euclidean norm, and A* the complex conjugate of A.
2. GENERALIZED SPECTRAL DERIVATIVE TESTS
2.1. Hypotheses of Interest
Suppose g(It−1,θ) is a parametric model for the conditional mean E(Yt|It−1) of a stochastic time series process {Yt}, where It−1 is an information set at time t − 1, which may contain lagged dependent variables {Yt−j,j > 0} and current and lagged exogenous variables {Zt−j,j ≥ 0}, and θ ∈ Θ is a finite-dimensional parameter. Examples of g(It−1,θ) include linear time series regression (static or dynamic) models, autoregressive moving average (ARMA) models, ARMA with exogenous variables (ARMAX) models, regime-switching autoregressive models (Hamilton, 1989), parametric state-space models (Priestley, 1988), smooth transition autoregressive models (Teräsvirta, 1994), Poisson jump autoregressive models, and threshold autoregressive models with known thresholds (e.g., Potter, 1995).1
We conjecture that our modified generalized spectral derivative tests are also applicable to threshold autoregressive models with unknown thresholds, but our regularity conditions given in Section 3 rule out this class of models.
We say that the model g(It−1,θ) is correctly specified for E(Yt|It−1) if

Alternatively, the model g(It−1,θ) is misspecified for E(Yt|It−1) if

Conditional mean modeling has been a primary interest in time series analysis, because E(Yt|It−1) is the optimal predictor for Yt using It−1 in terms of the mean squared error criterion. In addition, most dynamic economic theories have implications on and only on the conditional mean dynamics of economic processes, as pointed out earlier.
2.2. Generalized Spectral Derivative Tests
In time series modeling, It−1 is possibly infinite-dimensional (i.e., dating back to the infinite past), as is the case for non-Markovian processes. This poses a challenge in testing the adequacy of the model g(It−1,θ), due to the curse of dimensionality. Hong and Lee (2005) proposed a nonparametric test of

using a suitable partial derivative of the Hong (1999) generalized spectrum, which avoids the curse of dimensionality. Define the model error

Then

holds if and only if E [εt(θ0)|It−1] = 0 a.s. for some θ0 ∈ Θ. The null hypothesis

thus implies E [εt(θ0)|It−1ε] = 0 a.s., where It−1ε ≡ {εt−1(θ0),εt−2(θ0),…}. This forms a basis for testing

.
For notational economy, we put εt ≡ εt(θ0), where

and

is a parameter estimator. Suppose {εt} is a strictly stationary process with marginal characteristic function φ(u) ≡ E(eiuεt) and pairwise joint characteristic function φj(u,v) ≡ E(eiuεt+ivεt−| j|), where

,

, and j = 0,±1,… The basic idea of the generalized spectrum in Hong (1999) is to consider the spectrum of the transformed series {eiuεt}. It is defined as

where ω is the frequency and σj(u,v) ≡ cov(eiuεt,eivεt−| j|) is the covariance function of the transformed series. The function f (ω,u,v) can capture any type of pairwise serial dependence in {εt}, i.e., dependence between εt and εt−j for any j ≠ 0, including nonlinear serial dependence with zero autocorrelation. This is analogous to the higher order spectra (Brillinger, 1965; Brillinger and Rosenblatt, 1967a, 1967b). Unlike the higher order spectra, however, f (ω,u,v) does not require the existence of any moment of {εt}. Nevertheless, when E(εt2) exists, we can obtain the power spectrum as a partial derivative of f (ω,u,v) at (u,v) = (0,0):

For this reason, we call f (ω,u,v) the generalized spectrum of {εt}.
As is well known, the interpretation of spectral analysis is more difficult for nonlinear time series than for linear time series. For example, the bispectrum (e.g., Subba Rao and Gabr, 1984) has no physical (i.e., energy decomposition over frequencies) interpretation, unlike the power spectrum. This is also true of f (ω,u,v). However, the basic idea of characterizing cyclical dynamics still applies: f (ω,u,v) is useful when searching for linear or nonlinear cyclical movements. A strong cyclicity of data can be linked with a strong serial dependence in {εt} that may not be captured by the autocorrelation function. The generalized spectrum f (ω,u,v) can capture such nonlinear cyclical patterns by displaying distinct spectral peaks. This can be seen from the Taylor series expansion of f (ω,·,·) around the origin (0,0):

assuming all moments of {εt} exist. Now suppose an asset series is a white noise (cov(εt,εt−j) = 0 for all j ≠ 0) but has a stochastic cyclical dynamics in volatility clustering, which may be linked to business cycles (e.g., Schwert, 1989; Hamilton and Lin, 1996). Then the power spectrum will miss these volatility cycles, but f (ω,u,v) can effectively capture them. More generally, f (ω,u,v) can capture cyclical dynamics in the conditional distribution of {εt}, including those in volatility, skewness, and kurtosis.2
A potentially useful application is the investigation of possible nonlinear business cycles by f (ω,u,v). It has been well known that business cycles exhibit asymmetric features, typically with longer expansions and short recessions (e.g., Hamilton, 1989; Diebold and Rudebusch, 1990). The power spectrum, when applied to macroeconomic time series such as the U.S. GDP growth rates, often produces a flat spectrum. However, some nonlinear time series experts (e.g., Tong, 1990, p. 232) believe that business cycles are related to nonlinear cyclical dynamics. It will be interesting to examine whether f (ω,u,v) can capture and identify such nonlinear business cycles.
The generalized spectrum f (ω,u,v) itself is not suitable for testing

, because it can capture serial dependence not only in mean but also in higher order moments.
3The generalized spectrum f (ω,u,v) is suitable for testing the i.i.d. hypothesis for {εt} as is considered in Hong and Lee (2003). It is not suitable for testing

, because {εt} can be an m.d.s. but not an i.i.d. sequence.

where

The measure σj(10)(0,v) checks whether the autoregression function E(εt|εt−j) at lag j is zero. Under appropriate regularity conditions, σj(10)(0,v) = 0 for all

if and only if E(εt|εt−j) = 0 a.s.
4See Bierens (1982) and Stinchcombe and White (1998) for discussion in a different context with i.i.d. samples.
The use of E(εt|εt−j) or σj(1,0)(0,v) for testing

is analogous in spirit to the nonparametric additive models in the nonparametric estimation literature (e.g., Kim and Linton, 2004).
Although E(εt|εt−j) and σj(10)(0,v) are equivalent measures, the use of σj(10)(0,v) avoids smoothed nonparametric estimation. Moreover,

can be viewed as an operational measure of the maximum mean correlation, maxf (·)|corr[εt,f (εt−j)]|, which was proposed by Granger and Teräsvirta (1993, p. 23) as a measure for nonlinearity in mean. Similarly, the generalized spectral derivative modulus

can be viewed as the maximum dependence in mean at frequency ω. It can be used to search cycles in mean that are caused by linear or nonlinear serial dependence in mean (e.g., ARCH-in-mean effect; see Engle, Lilien, and Robins, 1987).6
We note that the hypothesis of E(εt|It−1ε) = 0 a.s. is not the same as the hypothesis of E(εt|εt−j) = 0 a.s. for all j > 0. The former implies the latter but not vice versa. This is the price we have to pay for dealing with the difficulty of the curse of dimensionality. One example that is not an m.d.s. but has E(εt|εt−j) = 0 a.s. for all j > 0 is a nonlinear moving-average process εt = αzt−2 zt−3 + zt, {zt} ∼ i.i.d.(0,σ2).
Because εt is not observed, we need to use an estimated model residual

where It−1[dagger] is the information set observed at time t − 1 that may involve some assumed initial values.
7For example, consider an MA(1) model:

. Here, the infeasible information set It−1 = {Yt−1,Yt−2,…,Y1,Y0,…} contains the entire past history {Ys,s < t} dating back to the infinite past. On the other hand, It−1[dagger] = {Yt−1,Yt−2,…,Y1,ε0}, where ε0 is an assumed initial value for ε0.

-consistent parameter estimator

can be used. Examples of

are the conditional least squares and quasi–maximum likelihood estimators. With

, one can consistently estimate f(010)(ω,0,v) by a smoothed kernel estimator

where


, and

. Here, p ≡ p(T) is a bandwidth, and

is a symmetric kernel. Examples of k(·) include the Bartlett, Daniell, Parzen, and quadratic spectral kernels (e.g., Priestley, 1981, p. 442). The factor (1 − | j|/T)1/2 is a finite-sample correction. It could be replaced by unity.
Under

, the generalized spectral derivative f(010)(ω,0,v) is a “flat” spectrum:

which can be consistently estimated by

To test

, Hong and Lee (2005) compared

and

via an L2-norm. Their test statistic is

where

is a nondecreasing function that weighs sets symmetric about zero equally,

Throughout, all unspecified integrals are taken on the support of W(·). An example of W(·) is the N(1,0) cumulative distribution function (c.d.f.), which is commonly used in the characteristic function literature. The factors

and

are the approximate mean and variance of the quadratic form

. They have taken into account the impact of conditional heteroskedasticity and time-varying higher order conditional moments. As a result,

is robust to conditional heteroskedasticity and time-varying higher order conditional moments of unknown form.
8Hong and Lee (2005) also considered two other classes of generalized spectral tests, derived under conditional homoskedasticity and i.i.d. regression errors, respectively. These tests can also be modified in the same way as we do for

to remove the impact of parameter estimation uncertainty.

and

grow to infinity at a rate of p as p → ∞, p/T → 0.
Hong and Lee (2005) showed that

under

. Because the parametric estimator

converges to θ0 faster than the rate at which the nonparametric kernel estimator

converges to f(010)(ω,0,v), the asymptotic normal distribution of

is solely determined by

. Attractively,

can be any

-consistent estimator of θ0, and parameter estimation uncertainty has no impact on the asymptotic distribution of

. In other words, the asymptotic distribution of

is unchanged when

is replaced by its probability limit θ0. This results in significant simplification of some otherwise difficult contexts. In particular, only estimated model residuals are needed to compute the test statistics.
However, the convenient asymptotic nuisance parameter–free property is not without cost for

. Although parameter estimation uncertainty has no impact on the asymptotic distribution of

, it has an impact on the finite-sample distribution. Because g(It−1,θ) is a parametric model,

can result in at most an adjustment of a finite number of degrees of freedom to the distribution of

. When the lag order p → ∞ as T → ∞, the impact of

becomes negligible when normalized by the standard deviation estimator

, which grows to infinity at the rate of p1/2. However, asymptotic analysis reveals that the asymptotically negligible higher order terms in

that are associated with parameter estimation uncertainty vanish to zero in probability rather slowly, as will be seen subsequently. Therefore,

may significantly distort the size of

in small and finite samples. This is particularly the case when there are relatively many parameters but the sample size T is not large, as is typically encountered for macroeconomic time series data and low-frequency financial time series data.
2.3. Wooldridge's Device
In a series of important works, Wooldridge (1990a, 1990b, 1991) proposed a unified approach to robust, regression-based parametric specification tests for possibly dynamic time series models, including time series conditional mean models. Wooldridge (1990a) considered the null hypothesis

where φt(θ) is a measurable, possibly vector-valued function. In the present context, φt(θ) = iεt(θ) in (2.1). Wooldridge (1990a) used a test function Λt(θ) ∈ It−1 and checked if E [Λt(θ0)φt(θ0)] = 0 by using the sample moment

where

,

, and

is a

-consistent estimator of θ0. Straightforward algebra shows that

where Φt(θ0) ≡ E [(∂/∂θ)φt(θ0)|It−1]. Thus, the asymptotic distribution of

is jointly determined by

and

, unless Φt(θ0) = 0 under the null hypothesis.
To remove the impact of parameter estimation uncertainty of

on the asymptotic distribution of

, Wooldridge (1990a) first purged from

its linear projection onto

, a consistent estimator for Φt(θ0), and then considered the modified test statistic

where

is the ordinary least squares (OLS) estimator of regressing

on

. It can be shown that for any

-consistent estimator

,

where

. Thus, the asymptotic distribution of

is robust to parameter estimation uncertainty because it is not affected by any

-consistent estimator

up to OP(T−1/2). An asymptotic χ2 test can be obtained by forming a suitable quadratic form in

. We note that the Wooldridge (1990a) device does not imply that

has a better asymptotic approximation than

in finite samples or vice versa. However, it nicely generates a new set of moment conditions

that is robust to parameter estimation uncertainty up to OP(T−1/2). Consequently, its asymptotic distribution does not depend on any

-consistent estimator

. This makes the test based on

rather convenient in practice.
Although the Wooldridge (1990a) device may not deliver a better asymptotic distribution approximation for

, it ideally suits our purpose of improving the finite-sample performance of the generalized spectral derivative test

in (2.6), because with a new set of moment conditions, it can make the asymptotically negligible higher order terms in

that are associated with

vanish faster to 0. Subsequently, we first describe how the Wooldridge (1990a) device can be adapted to

and then explain why it can improve the asymptotic normal approximation for

.
Although

is more complicated than the Wooldridge (1990a) test statistic, the Wooldridge (1990a) device can be applied to each generalized covariance derivative

, which has a similar structure to

, with

and

. Based on this observation, we introduce a modified generalized covariance

where

,

, and

The modified generalized spectral derivative estimators can then be defined as follows:

and

Comparing

and

via an L2-norm, we obtain the modified test statistic

where the centering and scaling factors

To gain insight into why the Wooldridge (1990a) device can improve the finite-sample performance of

, we now provide heuristics. Put ψt(v) = eivεt − φ(v), Gt = (∂/∂θ)g(It−1,θ0), ξt−j(v) = ivGt−j eivεt−j, and ηj(v) = E [Gtψt−j(v)] for j > 0 and let

be defined in the same way as

with {εt}t=1T replacing

. Then, by a Taylor series expansion around θ0, we have for each j > 0,

where the remainder OP [(T − j)−1] term in the first equality comes from the higher order terms of the Taylor series expansion, including the effect of replacing the information set It−1[dagger] with It−1. The last equality follows from

, Chebyshev's inequality,

under the m.d.s. property of {εt} as implied by

, and

under suitable mixing conditions on the time series process {εt,Gt′}′.
For static conditional mean models where g(It−1,θ0) is only a function of strictly exogenous variables independent of innovations {εt}, we have ηj(v) = 0 for all j > 0. For dynamic conditional mean models where g(It−1,θ0) is a function of lagged dependent variables and/or lagged innovations, ηj(v) is generally nonzero at least for some j > 0. To examine the impact of ηj(v) on

, we use (2.11) and obtain

where the second term in the first equality is OP(1) given

and

by the dominated convergence theorem, where the limit is nonzero when g(It−1,θ0) is a dynamic conditional mean model. Similarly, the third term in the first equality is also OP(1) given

and Chebyshev's inequality.
Using analogous reasoning, we can also obtain that, for the mean and variance estimators

and

in

,

where

and

are defined in the same way as

and

with {εt}t=1T replacing

. Recalling that

grows at a rate of p, we then obtain

where

is an infeasible test statistic that is defined in the same way as

with {εt}t=1T replacing

. In (2.13), the OP(p−1/2) term arises because of the effect of

and the fact that

in probability. This term vanishes to 0 in probability given p → ∞. On the other hand, the OP(p1/2/T1/2) term also vanishes to 0 in probability given p/T → 0. As a result, the asymptotic distribution of

is determined by the infeasible test statistic

, which is evaluated at θ0 and is asymptotically N(0,1) under

.
In practice, the lag order p usually grows to infinity at a slow rate. For example, when the Bartlett and Parzen kernels are used, the optimal rates for p in terms of the mean squared error criterion are p ∝ T1/3 and p ∝ T1/5, respectively. In these cases we have p−1/2 ∝ T−1/6 and p−1/2 ∝ T−1/10, respectively. The slow convergence of the OP(p−1/2) term implies that the asymptotic normal approximation for

may be inadequate in finite samples and may become worse when one has to estimate more parameters.
The slowly vanishing OP(p−1/2) term in

is thus troublesome in finite samples. The ability to remove it is highly desirable. This will improve the asymptotic N(0,1) approximation for

in finite samples. As we illustrate subsequently, the Wooldridge (1990a) device ideally suits this purpose, although it does not necessarily improve the size performance of the Wooldridge (1990a) modified parametric m-tests in finite samples. Let

be defined in the same way as

with {εt}t=1T replacing

. Then, by taking a Taylor series expansion and using reasoning analogous to that of (2.11), we have for j > 0,

where ht−j(v) = ψt−j(v) − Gt′ βj(v), βj(v) = [E(Gt Gt′)]−1E [Gtψt−j(v)], δt−j(v) = ξt−j(v) − Gt′τj(v), τj(v) = [E(Gt Gt′)]−1E [Gtξt−j(v)], and ςj(v) = E [Gt ht−j(v)]. Unlike the function ηj(v) = E [Gtψt−j(v)] that is associated with

in (2.11), we always have ςj(v) = 0 for all j > 0 in (2.14), no matter whether g(It−1,θ0) is a static or dynamic conditional mean model. It follows that

, and consequently,

Therefore, we have

where

is an infeasible test statistic that is defined in the same way as

with {εt}t=1T replacing

. Under

, we have

. The Wooldridge (1990a) device does not imply that

has a better normal approximation than

in finite samples or vice versa.
9As one referee points out, the asymptotic N(0,1) distribution of

or

can be viewed as the normal approximation for a chi-square distribution with the degree of freedom growing to infinity. Because the chi-square distribution is skewed to the right, the normal approximation may be not accurate unless the degree of freedom is sufficiently large. To improve the finite-sample performance of

or

, one may consider (e.g.) the Chen and Deo (2004) power transformation, which can alleviate the skewness problem. We leave this possibility to future work.

, because its asymptotically negligible higher order terms vanish to 0 in probability faster than the higher order terms in

. We emphasize that the finite-sample improvement is achieved by combining Wooldridge's device and the nonparametric testing approach. As pointed out earlier, Wooldridge's device alone does not necessarily improve the finite-sample performance. Intuitively, for each

, there is an impact of parameter estimation uncertainty. In particular, a Taylor series expansion of

around θ0 reveals that replacing

for θ0 affects the asymptotic distribution, although the cumulative effect of replacing

for θ0 becomes asymptotically negligible when we employ an increasing number of lags, making

robust to parameter estimation uncertainty (this differs from the parametric m-tests based on

). In contrast, a Taylor series expansion of

around θ0 reveals that the asymptotic distribution of

is the same as that of

. By applying the Wooldridge (1990) device to each

and using

instead, we can effectively reduce the impact of parameter estimation uncertainty to a higher order. Thus, we expect more robustness of

to parameter estimation uncertainty in finite samples.
One important difference between the Wooldridge (1990a) test and

is that Wooldridge (1990a) checks a fixed number of moment conditions whereas

checks an increasing number of moment conditions as T → ∞. In fact, a plausible alternative approach that is closer in spirit to the Wooldridge (1990a) test is to consider the following sample moment condition:
10We are grateful to a referee for suggesting this alternative approach.

where

,

,

is the OLS coefficient of regressing

on

, and p is a fixed lag order. Straightforward algebra shows that

where Λt(v) = Ψt(v) − Gt′B(v), where Ψt(v) = [ψt−1(v),…, ψt−p(v)]′ and B(v) = [E(Gt Gt′)]−1E [GtΨt(v)]. It follows that

on every compact set on

, where ⇒ denotes weak convergence, and Z(v) is a complex-valued Gaussian process with mean 0 and variance-covariance kernel cov[Z(v1),Z(v2)] = E [εt2Λt(v1)Λt*(v2)′] for

. To construct a test statistic, we can define a quadratic form

where

. Under suitable regularity conditions and using the continuous mapping theorem, we expect that under

,

where χp2(v) ≡ Z(v)′V−1(v)Z*(v) may be called a chi-squared process (see Hansen, 1996, p. 417), with V(v) = E [εt2Λt(v)Λt*(v)′]. This test is also robust to conditional heteroskedasticity of unknown form. Unfortunately, the asymptotic distribution of ∫χp2(v) dW(v) is not distribution free; it depends on the data generating process (DGP) and cannot be tabulated. This asymptotic distribution, however, can be consistently approximated using the Hansen (1996) resampling method. Because the asymptotic analysis is rather involved and the simulation study is computationally intensive, we defer the investigation of this approach to future research.
3. ASYMPTOTIC DISTRIBUTION
In Sections 3 and 4, we will compare the asymptotic properties of the modified test

in (2.10) and the unmodified test

in (2.6) under

and

, respectively. To derive the null limiting distribution of

, we first give some regularity conditions.
Assumption A.1. {Yt} is a strictly stationary time series process such that μt ≡ E(Yt|It−1) exists a.s., where It−1 is an information set at time t − 1 that may contain lagged dependent variables {Yt−j, j > 0} in addition to current and lagged exogenous variables {Zt−j, j ≥ 0}.
Assumption A.2. g(It−1,θ) is a parametric model for μt, where θ ∈ Θ is a finite-dimensional parameter and Θ is a parameter space, such that (a) for each θ ∈ Θ, g(·,θ) is measurable with respect to It−1; (b) with probability one, g(It−1,·) is continuously twice differentiable with respect to θ ∈ Θ, and E supθ∈Θ∥(∂/∂θ)g(It−1,θ)∥4 ≤ C and E supθ∈Θ∥(∂2/∂θ∂θ′)g(It−1,θ)∥2 ≤ C; and (c) E [(∂/∂θ)g(It−1,θ)(∂/∂θ′)g(It−1,θ)] is nonsingular for θ ∈ Θ.
Assumption A.3. Let It[dagger] be an observed information set available at time t that may contain some assumed initial values. Then

Assumption A.4.

, where

.
Assumption A.5. Put εt ≡ Yt − g(It−1,θ0) and Gt ≡ (∂/∂θ)g(It−1,θ0). Then {εt,Gt′}′ is a strictly stationary α-mixing process with α-mixing coefficient α(j) satisfying

for some υ > 1. In addition, E(εt2) = σ2 and E(εt4) ≤ C.
Assumption A.6.

is symmetric about 0 and is continuous at 0 and all points except a finite number of points, with k(0) = 1 and |k(z)| ≤ C|z|−b as z → ∞ for some b > 3.
Assumption A.7.

is nondecreasing and weighs sets symmetric about zero equally, with

.
Assumption A.8. For each sufficiently large integer q, there exists a strictly stationary process {εq,t} such that as q → ∞, εq,t is independent of It−q−1 for each t, E(εq,t|It−1) = 0 a.s., E(εt − εq,t)4 ≤ Cq−2κ for some constant κ ≥ 1, and E(εq,t4) ≤ C.
Assumption A.1 imposes a strict stationarity condition on the process {Yt}. The existence of the conditional mean μt can be ensured by assuming that E(Yt2) < ∞. Assumption A.2 is a standard regularity condition on the conditional mean model g(It−1,θ). For a (static or dynamic) linear regression model g(It−1,θ) = Xt′θ, where Xt ∈ It−1 is finite-dimensional, it suffices if E∥Xt∥4 ≤ C and E(Xt Xt′) is nonsingular. Assumption A.2 covers many stationary nonlinear time series conditional mean models, such as nonlinear moving-average, bilinear, exponential, Markov regime-switching, smooth transition, and Poisson jump autoregressive models. It also covers threshold autoregressive models with known thresholds. An example is the class of self-exciting autoregressive threshold models for the U.S. economy, where the recession and the expansion are defined as the gross domestic product (GDP) growth rate being larger or smaller than zero (e.g., Potter, 1995). However, Assumption A.2 rules out the autoregressive threshold models with unknown thresholds as considered in Hansen (2000), where g(It−1,θ) is not continuous in threshold parameters. We conjecture that our tests are applicable to these models under additional regularity conditions, but we do not attempt to justify this here, which is beyond the scope of this paper. We note that Assumption A.2(c) was not needed for

, but it is needed for

because we use a sequence of auxiliary OLS regressions.
Assumption A.3 is a condition on the truncation of information set It−1, which usually contains information dating back to the very remote past and so may not be completely observable. Because of the truncation, one may have to assume some initial values in estimating the model g(It−1,θ). Assumption A.3 ensures that the use of initial values, if any, has no impact on the limiting distribution of

. For instance, consider an ARMA(1,1) model:

where |α| ≤ α < 1 and |β| ≤ β < ∞. Here It−1 = {Yt−1,Yt−2,…} but It−1[dagger] = {Yt−1,Yt−2,…,Y1,ε0}, and ε0 is an initial value assumed for ε0. By recursive substitution, Hong and Lee (2005) showed

Similarly we can show that the information truncation condition for {(∂/∂θ)g(It−1[dagger],θ) − (∂/∂θ)g(It−1,θ)} in Assumption A.3 holds for the ARMA(1,1) model. This condition was not needed for

but is needed for

.
Assumption A.4 requires a

-consistent estimator

, which need not be asymptotically most efficient. It can be a conditional least squares estimator or a conditional quasi–maximum likelihood estimator. Also, we need not know the asymptotic expansion structure of

, because the sampling variation in

does not affect the asymptotic distribution of

. These features are similar in spirit to the Wooldridge (1990a) modified m-tests. Assumption A.5 imposes mixing conditions on {εt,Gt′}′, which restrict the degree of the serial dependence in {εt,Gt′}′. The mixing condition is suitable and convenient for nonlinear time series analysis. For more discussion on mixing conditions, see (e.g.) White (2001).
Assumption A.6 is a regularity condition on the kernel k(·). It includes all commonly used kernels in practice. The condition of k(0) = 1 ensures that the asymptotic bias of the smoothed kernel estimator

in (2.9) vanishes to 0 as T → ∞. The tail condition on k(·) requires that k(z) decays to zero sufficiently fast as |z| → ∞. It is more stringent than that imposed in Hong and Lee (2005). It implies that

. This condition rules out the Daniell and quadratic spectral kernels, whose b = 2.
11We impose b > 3 to simplify the proof of Theorem 1. In other words, the condition of b > 3 is sufficient but may not be necessary for

to be asymptotically N(0,1) under

.
Assumption A.8 is required only under

. It assumes that when q is sufficiently large, the m.d.s. {εt} can be approximated by a q-dependent m.d.s. process {εq,t} arbitrarily well. Horowitz (2003) imposed a similar condition in a different context. Because {εt} is an m.d.s. under

, Assumption A.8 essentially imposes restrictions on the serial dependence in the higher order moments of {εt}. It holds trivially when {εt} is a q0-dependent process with an arbitrarily large but fixed order q0. It also covers many non-Markovian processes. For example, Hong and Lee (2005) showed that Assumption A.8 holds for a threshold GARCH(1,1) error process that includes a standard GARCH process as a special case:

provided ρ < 1, where ρ ≡ α + β+ + (β− − β+)E [zt21(zt ≤ 0)] and 1(·) is an indicator function. It also holds for a general stochastic volatility process:

where

, E(zt4) < ∞, and {zt} and {ηt} may not be independent of each other.
We now state the asymptotic distribution of the

test under

.
THEOREM 1. Suppose Assumptions A.1–A.8 hold and p = cTλ for 0 < λ < (3 + (1/(4b − 2)))−1 and 0 < c < ∞. Then

and

under

.
As with the original test

, we obtain the convenient asymptotic N(0,1) distribution for the modified test

, but the latter is expected to have a better finite-sample performance. Theorem 1 also implies that

and

are asymptotically equivalent under

. The asymptotic equivalence holds even if the orthogonality condition that

fails. This orthogonality condition is needed for the Wooldridge (1990a) modified and unmodified parametric m-tests to be asymptotically equivalent under the null hypothesis (see Wooldridge, 1990a, Lem. 2.2, pp. 28–29). It will hold when one uses the nonlinear least squares estimator

The asymptotic equivalence between

and

under

has an important implication. Although we do not formally analyze it here, we expect that the asymptotic equivalence between

and

will continue to hold under a suitable class of local alternatives to

(for a similar discussion on unmodified and modified parametric m-tests, see Wooldridge, 1990a, p. 29). In other words,

will be asymptotically as powerful as

under a class of local alternatives.
We now summarize the procedures to implement the modified test

as follows.
Step 1. Obtain a

-consistent estimator

(e.g., the nonlinear least squares estimator) for the conditional mean model g(It−1,θ) and save the estimated residual

.
Step 2. Compute

. For a linear regression model g(It−1,θ) = Xt′θ, we have

, the regressor vector.
Step 3. For each lag order j from 1 to T − 1, run an OLS regression of

on

, where we set

for t ≤ 0.
12Alternatively, one could use the OLS estimator

for 0 < j < T. The asymptotic N(0,1) distribution of

remains unchanged, but the formal proof is more tedious.

. If the kernel k(·) has a bounded support (i.e., k(z) = 0 if |z| > 1), then it suffices to run regressions for j from 1 to p.
Step 4. Compute the modified test statistic

in (2.10).
Step 5. Compare

with an upper tailed N(0,1) critical value (e.g., 1.645 at the 5% level) and reject

at a suitable significance level if

is larger than the critical value.
We note that for a static conditional mean model g(It−1,θ) = g(Xt,θ), where Xt is a strictly exogenous random vector independent of innovations {εt}, we need not use the Wooldridge (1990a) device because, as pointed out earlier, the impact of parameter estimation uncertainty has been a rather small order in this case and the Wooldridge (1990a) device cannot further reduce the order of magnitude for the higher order terms in

that are associated with

. However, for a dynamic conditional mean model g(It−1,θ) = g(Xt,θ), where Xt contains lagged dependent variables and/or lagged innovations, the Wooldridge (1990a) device can reduce the order of magnitude of the higher order terms in

that are associated with

, thus achieving a better normal approximation in small and finite samples.
In this paper we have focused on time series conditional mean models with additive errors in (2.1). In fact, our approach is also applicable to a time series conditional mean model with multiplicative errors:

where {Yt} is a nonnegative stochastic time series, g(It−1,θ) is a parametric model for the conditional mean E(Yt|It−1), and εt(θ) is a nonnegative multiplicative error. Examples of the model in (3.1) include the Engle and Russell (1998) autoregressive conditional duration model for duration times of financial events and its various extensions. When and only when the model g(It−1,θ) is correctly specified for E(Yt|It−1), we have

The generalized spectral derivative tests can be applied to the model in (3.1), with the estimated residual

and the gradient

used in

being replaced by

and

.
4. ASYMPTOTIC POWER
To investigate the power property of

, particularly the impact of the auxiliary regressions on the asymptotic power of

, we consider the asymptotic behavior of

under

. For this purpose, we define the population modified generalized spectrum

where γj(u,v) = cov[eiuεt,ht−j(v)], ht−j(v) = ψt−j(v) − Gt′ βj(v), Gt = (∂/∂θ)g(It−1,θ0),

and ψt(v) = eivεt − φ(v). We also define the population modified generalized “flat” spectrum:

Then the partial derivatives of the modified generalized spectrum are S(010)(ω,0,v) ≡ (∂/∂u)S(ω,u,v)|u=0 and S0(010)(ω,0,v) ≡ (∂/∂u)S0(ω,u,v)|u=0, provided these partial derivatives exist. With these notations, we can state Theorem 2.
THEOREM 2. Suppose Assumptions A.1–A.7 hold and p = cTλ for 0 < λ < ½ and 0 < c < ∞. Then as T → ∞,

where

and ρj(u,v) = cov[ht(u),ht−j(v)].
The constant Dd takes into account the impact of serial dependence in conditioning functions {ht−j(v),j > 0}, which generally exists even under

, due to the presence of serial dependence in the conditional variance and higher order moments of {εt}. It has also taken into account the impact of the auxiliary regressions on the behavior of

. For comparison, we have from Hong and Lee (2005, Thm. 2) that for the unmodified test,

where

. Clearly,

and

are not asymptotically equivalent under

because they do not converge to the same probability limit after being multiplied by the rate p1/2/T. Unlike the case under

, where the auxiliary regressions have no impact on the asymptotic distribution of

, the auxiliary regressions have impact on the probability limit of

under

.
We now discuss how the auxiliary regressions may affect the power of

. Suppose the autoregression function E(εt|εt−j) ≠ 0 at some lag j > 0. Then we have ∫|σj(10)(0,v)|2 dW(v) > 0 for any weighting function W(·) that is positive, monotonically increasing, and continuous, with unbounded support on

. It follows that

for any sequence of constants C(T) = o(T/p1/2), and so the unmodified test

has asymptotic unit power at any given significance level α ∈ (0,1), whenever E(εt|εt−j) is nonzero at some lag j > 0. This is the reason why

has omnibus power against a wide variety of linear and nonlinear alternatives with unknown lag structure, as is confirmed in the Hong and Lee (2005) simulation. It avoids the blindness of searching for different alternatives when one has no prior information.
Theorem 2 indicates that the power of

depends on whether γj(10)(0,v) ≠ 0 at least for some j > 0 under

. Note that γj(10)(0,v) ≠ σj(10)(0,v) generally under

. However, if we have either (i) E(Gtεt) = 0 or (ii) βj(v) = 0 for all j > 0 under

, then γj(10)(0,v) = σj(10)(0,v) for all

. In these cases,

has the same consistency property as

, although their probability limits still may be different, because of the fact that the denominator Dd depends on βj(v) when βj(v) ≠ 0 at least for some j > 0. The case that βj(v) = 0 for all j > 0 can arise when g(It−1,θ0) = g(Xt,θ0), where Xt is a strictly exogenous vector independent of innovations {εt}. The case that E(Gtεt) = 0 can arise under

even when g(It−1,θ0) contains lagged dependent variables and/or lagged innovations. In particular, when

is a nonlinear least squares estimator, i.e.,

, then

will satisfy the condition that E(Gtεt) = E [(∂/∂θ)g(It−1,θ0)εt] = 0 under

.
When E(Gtεt) ≠ 0 and βj(v) ≠ 0 at least for some j > 0, we generally have γj(10)(0,v) ≠ 0 if σj(10)(0,v) ≠ 0. However, there exists a certain model misspecification against which the modified test

has no power. This arises when γj(10)(0,v) = 0 for all j > 0 but σj(10)(0,v) ≠ 0 for some j > 0. Let

be the least squares coefficient of regressing εt on Gt. Then the possibility that γj(10)(0,v) = 0 for all j > 0 but σj(10)(0,v) ≠ 0 for all j > 0 can arise if and only if

i.e., if and only if the covariance between εt and eivεt−j coincides with the covariance between their linear projections onto Gt. This occurs when the neglected dynamics in mean takes the form of E(εt|It−1) = α′[Gt − E(Gt)]. In this (pathological) case, the modified test

has no power. This is the price that we have to pay when using the Wooldridge (1990a) device, as is also the case in parametric testing (for discussion, see White, 1994, Ch. 9). However, we emphasize that the gain in the size improvement from using Wooldridge's device for our tests overwhelms the possible power loss in detecting misspecification in the direction of the gradient Gt. More importantly, if the nonlinear least squares estimator is used,

will be able to detect such pathological misspecification and achieve the same consistency property as the original test

.
Because existing tests for time series conditional mean models only consider a fixed order lag, they can easily miss misspecifications at the higher lag orders. Of course, these tests could be used to check a large number of lags when a large sample is available. However, they are not expected to be powerful against many alternatives of practical importance, because of the loss of a large number of degrees of freedom. This power loss is greatly alleviated for our tests as a result of the use of k2(·). Most nonuniform kernels discount higher order lags. This enhances good power against the alternatives whose serial dependence in mean decays to zero as lag order j increases. Thus, our tests can check a large number of lags without losing too many degrees of freedom. This feature is not shared by popular chi-square-type tests with a large number of lags, which essentially give equal weighting to each lag. Equal weighting is not fully efficient when a large number of lags is used.
Once the model g(It−1,θ) is rejected by

, one may want to go further to explore possible sources of model misspecification in mean. For this purpose, we can further differentiate the modified generalized spectral derivative S(010)(ω,0,v) with respect to v at 0 and construct a sequence of tests similar in spirit to

. Specifically, the partial derivatives

can be used. For l = 1,2,3,4, tests based on these derivatives can check whether there exist linear correlation, ARCH-in-mean, skewness-in-mean, and kurtosis-in-mean effects, respectively. ARCH-in-mean effects are important in finance, and the recent literature has also documented time-varying skewness and kurtosis and their economic significance in asset pricing (e.g., Harvey and Siddique, 1999, 2000).
5. MONTE CARLO EVIDENCE
The results of Theorems 1 and 2 are asymptotic. Nothing is known about the finite-sample performance of the modified test

relative to the unmodified test

. We now investigate their finite-sample performance.
5.1. Simulation Design
5.1.1. Size.
To examine the sizes of the tests under

, we consider the following AR(d) processes:

where (i) εt = zt or (ii) εt = ht1/2zt, ht = 0.43 + 0.57εt−12, where {zt} ∼ i.i.d.N(0,1).13
We do not include exogenous variables as regressors, which is common in practice, because the inclusion of exogenous variables will not have much adverse impact on the size even for the

test. This is because the estimated parameters corresponding to exogenous variables do not have significant impact on the distribution of the

test. In contrast, the lagged dependent variables have significant impact on the size of the original test M1(p), on which we focus in this simulation study.
The null conditional mean model for Yt is an AR(d) model with intercept:

To examine the impact of increasing the number of estimated autoregressive parameters, we consider d = 1,2,3,4, respectively. The OLS estimator

is consistent for parameter θ0 ≡ (θ1,…, θd+1)′. The model error {εt(θ0)} is conditionally homoskedastic under the i.i.d. innovations and is conditionally heteroskedastic under the ARCH innovations. This allows us to examine the robustness of the tests to conditional heteroskedasticity. We have chosen ARCH parameter values such that E(εt4) < ∞, thus satisfying Assumption A.5.
14We also consider a generalized autoregressive conditionally heteroskedastic (GARCH) process with an infinite unconditional fourth-order moment. The size performance of the generalized spectral derivative tests is similar.
5.1.2. Power.
Next, we examine the power of the tests for neglected nonlinearity or dynamic misspecification, i.e., lag order misspecification in mean. Following Hong and Lee (2005), we consider the following data DGPs:

where {εt} is i.i.d.N(0,1). These DGPs are discussed in Hong and Lee (2005). We will examine the power of the modified test

relative to the unmodified test

for two sample sizes: T = 100 and 250. For each T, we generate 500 data sets.
To compute

and

, we use the N(1,0) c.d.f. truncated on [−3,3] for the weighting function W(·), and we use the Parzen kernel

which has a bounded support and is computationally efficient. For the choice of lag order p, we use a data-driven lag order

via the plug-in method described in Hong and Lee (2005, Sect. 6), with the Bartlett kernel k(z) = (1 − |z|)1(|z| ≤ 1) used in the preliminary generalized spectral derivative estimators. To certain extent, the data-driven lag order

lets data tell an appropriate lag order, but it still involves the choice of the preliminary bandwidth p, which is somewhat arbitrary. To examine the impact of the choice of the preliminary bandwidth p, we consider p = 10, 15, 20, 25, 30, which cover a sufficiently wide range of preliminary lag orders.
5.2. Monte Carlo Evidence
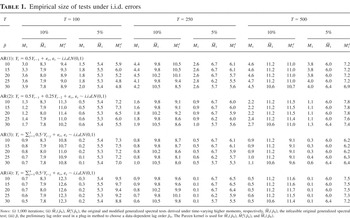
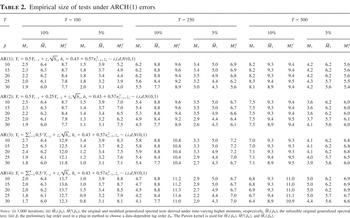
Tables 1 and 2 report the empirical rejection rates of the tests under

at the 10% and 5% significance levels, using the asymptotic theory. We first consider the unmodified test

. When the DGP is an AR(d) process with i.i.d. errors,

underrejects

severely at both the 10% and 5% levels (particularly for larger d), even when T = 500. When the DGP is an AR(d) process with ARCH errors,

also shows underrejection (particularly when T = 100), but the sizes are better than under DGPs with i.i.d. errors when T ≥ 250, and they improve as T increases. Overall, as the lag order d of the AR model increases,

displays more severe underrejection (except for the case at the 5% level and when T = 500), thus confirming our conjecture.
Empirical size of tests under i.i.d. errors

Empirical size of tests under ARCH(1) errors

To investigate whether the underrejection of

is due to the impact of parameter estimation uncertainty, we also report the rejection rates of the infeasible test statistic

of (2.13) that uses the true errors {εt} rather than the estimated model residuals

. When {εt} is i.i.d.,

outperforms

for all sample sizes T, and its sizes are reasonable and are robust to the choice of the preliminary lag order p. Note that the rejection rates of

remain unchanged when the order of the AR(d) model increases, because

does not use the estimated model residuals

. When {εt} is ARCH(1),

shows some underrejections when T = 100, but its sizes become reasonable when T ≥ 250. For all sample sizes T,

outperforms

. These results confirm our theory that parameter estimation uncertainty has nontrivial impact on

in finite samples. In particular, parameter estimation is like a calibration that makes the estimated model residuals look more like an m.d.s., leading to underrejection of the test.
For each sample size T and each preliminary lag order p, the means of the data-driven lag

are the same or very similar for all

,

, and

, regardless of the order of the AR(d) model and the types (i.i.d. or ARCH(1)) of the errors. When the preliminary lag p changes from 10 to 30, the means of

range from 4.6 to 7.2 for T = 100, from 5.5 to 7.2 for T = 250, and from 6.2 to 7.3 for T = 500. These results indicate relative robustness of

to the choice of p.
15For the Bartlett kernel, the range of the means of

is wider, from 6.3 to 17.5 when T = 100, from 6.4 to 17.8 for T = 250, and from 6.6 to 18.0 when T = 500. This is apparently due to different bandwidth rules: for the Bartlett kernel,

, and for the Parzen kernel,

. Nevertheless, the sizes of the tests using the Bartlett kernel are similar to the sizes of the tests using the Parzen kernel. These results are available from the authors upon request.
We now turn to the modified test

to examine whether the Wooldridge (1990a) device can effectively reduce the impact of parameter estimation uncertainty on the sizes of the test. For T = 100,

shows some overrejections when the order d of the AR(d) model is relatively large. However, it has reasonable sizes under all DGPs for T ≥ 250. The

test performs more similarly to the infeasible test

than

when T = 100, and when T ≥ 250,

and

perform more or less similarly. These results indicate the relative robustness of the modified test

to parameter estimation uncertainty, illustrating the merits of applying the Wooldridge (1990a) device to the generalized spectral tests.
Next, we turn to the power of the tests

and

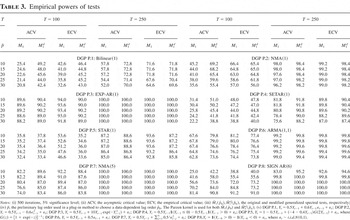
. Table 3 reports the empirical rejection rates of the tests at the 5% significance level under DGPs P.1–P.8 using asymptotic and empirical critical values, respectively. For the power using asymptotic critical values,

is more powerful than or equally powerful to

under all scenarios, which is not surprising at all given the fact that

tends to underreject under

. Under DGPs P.1 (bilinear(1)), P.2 (NMA(1)), P.4 (SETAR(1)) and P.8 (SIGN AR(6)),

has substantially lower power than

when T = 100, although its power increases as the sample size T increases and catches up with that of

when T = 250. This is consistent with the substantial underrejection of

due to the impact of parameter estimation uncertainty. Under DGPs P.2 (NMA(1)), P.3 (EXP-AR(1)), P.6 (ARMA(1,1)), P.7 (NMA(5)), and P.8 (SIGN AR(6)), both

and

have unit power except for one scenario when T = 250.
Empirical powers of tests

We now compare the powers of the tests using empirical critical values, which provide fair comparison of different tests on an equal ground. The empirical critical values are obtained under AR(1)-i.i.d. Under DGP P.1 (bilinear(1)),

is a bit more powerful than

when T = 100. They have equal or similar power when T = 250. The power of

is relatively more robust to the choice of the preliminary lag order p than that of

. Under DGP P.2 (NMA(1)),

and

have roughly equal power. The power of

and

is rather robust to the choice of the preliminary lag order p when T = 250.
Under DGP P.3 (EXP-AR(1)),

is slightly less powerful than

when T = 100. When T = 250,

and

have the same unit power. Also, the power of both tests is robust to the choice of preliminary lag order p. Under DGP P.4 (SETAR(1)),

and

also have roughly equal powers for each sample size T.
Under DGP P.5 (STAR(1)),

is less powerful than

, particularly when T = 100, but the power of

increases rapidly as T increases. Under DGP P.6 (ARMA(1,1)), the power of

is slightly smaller than that of

, and it quickly increases as T increases. When T = 250,

and

are equally powerful, and their powers are close to unity.
Under DGP P.7 (NMA(5)),

is slightly less powerful than

when T = 100, but its power quickly catches up with that of

when T = 250. When T = 250, both tests have unit power. Under DGP P.8 (SIGN AR(6)), both

and

are equally powerful for both sample sizes, and they have unit power when T = 250.
We note that there exist substantial or significant differences between the power of

using the asymptotic critical value and the power of

using the empirical critical value. In particular, the power of

using asymptotic critical value is lower than that of

using empirical critical value. In contrast, the power of

using asymptotic critical value is similar to that of

using empirical critical value in all cases.
In summary, we have observed the following stylized facts.
- The empirical sizes of the original
test are substantially lower than the nominal significance levels, because of the impact of parameter estimation uncertainty. The underrejection is more severe under homoskedastic errors and with more estimated autoregressive parameters. On the other hand, the Wooldridge (1990a) device can effectively reduce the impact of parameter estimation uncertainty; the empirical sizes of the modified
 test are reasonable in most cases, especially when the sample size becomes moderately large. Its sizes are slightly larger than the corresponding significance levels when the preliminary lag order p is small, but they improve as both the preliminary lag order p and the sample size T increase.
- As the lag order d of the AR(d) model increases,
i.e., the number of estimated autoregressive parameters increases,
shows more severe underrejections. In contrast,is relatively robust to parameter estimation uncertainty and the number of estimated autoregressive parameters in most cases.
- For the power using asymptotic critical values,
is always more powerful than, and the power ofis more robust to the choice of the preliminary lag order p than that ofin many cases.
- When using empirical critical values, the
test is not always as powerful as thetest, but it has similar power toin most cases, particularly when the sample size is moderately large. There is not much power loss for the modified test, although its size has been significantly improved. Both tests have omnibus power against all eight DGPs provided the sample size is sufficiently large. They require no knowledge of the lag structure of the potential alternative.
- There exist some substantial differences between the power of
using the asymptotic critical value and the power ofusing the empirical critical value. In particular, the power ofusing asymptotic critical values is always lower than the power ofusing empirical critical values, sometime rather substantially. In contrast, the powers ofusing asymptotic and empirical critical values are more or less similar.


6. CONCLUSION
Adapting the Wooldridge (1990a) device to a generalized spectral derivative approach, we propose an improved version of a class of residual-based, generally applicable specification tests for linear and nonlinear conditional mean models in time series, where the dimension of the conditioning information set may be infinite. Like the original generalized spectral derivative tests, the modified tests can detect a wide range of model misspecification in mean while being robust to conditional heteroskedasticity and time-varying higher order moments of unknown form. They check a large number of lags but naturally discount higher order lags, which alleviates the power loss due to the loss of a large number of degrees of freedom. The most appealing feature of the modified tests is that their finite-sample distribution is relatively robust to parameter estimation uncertainty and this is achieved without suffering from significant power loss, as is confirmed in our simulation. These results indicate that the proposed modified tests can be a useful tool in the specification analysis for time series conditional mean models.
MATHEMATICAL APPENDIX
Throughout the Appendix, we let C ∈ (1,∞) denote a generic bounded constant.
Proof of Theorem 1. We shall show that

. The asymptotic normality of

then follows immediately from Hong and Lee (2005, Thm. 1) under Assumptions A.1–A.8. Noting that εt(θ) ≡ Yt − g(It−1,θ) in (2.1), where It is the unobservable information set from period t to the infinite past, we write

Because It−1[dagger] ≠ It−1 generally, we have

, but Assumption A.3 implies

By the mean value theorem, we have

for some θ between

and θ0, where Gt(θ) ≡ (∂/∂θ)g(It−1,θ). It follows from the Cauchy–Schwarz inequality and Assumptions A.2 and A.4 that

where Θ0 is a neighborhood containing θ0, the

. Both (A.1) and (A.2) imply

Throughout, we put Tj ≡ T − | j|. To show that

, it suffices to show (i)

(ii)

, and (iii)

, where

as shown in Hong and Lee (2005, proof of Thm. 1). For reasons of space, we focus on the proof of (A.4); the proofs for (ii) and (iii) are straightforward. Note that we need to obtain the convergence rate OP(T−1/2) for

to ensure that replacing

with

has asymptotically negligible impact given p/T → 0.
To show (A.4), we decompose

where

where

is the real part of

and

is the complex conjugate of

. Then (A.4) follows from Theorems A.1 and A.2, which are given subsequently, and p → ∞ as T → ∞.
THEOREM A.1. Under the conditions of Theorem 1,

, and

.
THEOREM A.2. Under the conditions of Theorem 1,

.
Proof of Theorem A.1. By the definitions of

and

, we have for j > 0,

where

,

,

,

, and

. Noting that

, where

denotes the minimum eigenvalue of

, we have

We first show that

with probability approaching 1. Given that

, where Gt ≡ Gt(θ0) = (∂/∂θ)g(It−1,θ0), we have

where

given Assumptions A.2–A.4 and the mean value theorem for the expansion of

.
On the other hand, given Assumption A.5, {Gt Gt′} is a strictly stationary mixing process with mixing coefficient α(j). By a standard α-mixing inequality, and Assumption A.2, we have

It follows from (A.8) and (A.9) that

, and so

given nonsingularity of E(Gt Gt′) in Assumption A.2. Thus, to bound the order of magnitude for

, we can focus on the term

where we have used the identity that

. Theorem A.1 follows from Propositions A.1 and A.2, which are given subsequently,

, and p → ∞ as T → ∞.
PROPOSITION A.1.

and

.
PROPOSITION A.2.

and

.
Proof of Proposition A.1. Noting that

and

, we decompose

given Assumptions A.2–A.4, the Cauchy–Schwarz inequality, the mean value theorem, and Markov's inequality or Chebyshev's inequality. The mean value theorem is used for the second, fifth, and sixth terms in (A.10), and Chebyshev's inequality is used for the last term in (A.10), where {Gtεt} is an m.d.s. under

.
Next we decompose

where ηj(v) ≡ E [Gtψt−j(v)]. For the first term in (A.11), given

, we have

. It follows from Assumptions A.3, A.6, and A.7, and Markov's inequality that

where

as is shown in Hong (1999, (A.15)).
For the second term in (A.11),

, using the mean value theorem and the fact that

, we have

. It follows that

given Assumptions A.2, A.4, A.6, and A.7, Minkowski's inequality, and Markov's inequality.
For the third term

, we write

For the term

, using the identity that |eiz1 − eiz2| ≤ |z1 − z2| for any real-valued z1 and z2, we have

. It follows from the Cauchy–Schwarz inequality and (A.3) that

For the term

, we first decompose

It follows from the Cauchy–Schwarz inequality and Markov's inequality that

where we used the facts that

and

, where the latter follows from Assumption A.5 and a standard mixing inequality.
We now consider the fourth term in (A.11),

. Put

. We decompose

By Assumption A.5 and a standard mixing inequality, we have

and

(see Hong, 1999, (A.7) and related proof). It follows that

Finally, for the last term in (A.11), we have

where we have made use of the facts that

given Assumption A.5, and |k(·)| ≤ 1 from Assumption A.6.
Collecting (A.10)–(A.17), we obtain

█
Proof of Proposition A.2. We first write

For the term in the first bracket in (A.18), we can obtain

by analogous reasoning to (A.11)–(A.17). Note that the difference of having the factor |k(·)| rather than the factor k2(·) does not change the order of magnitude for the term in (A.19).
Next we consider the term in the second bracket in (A.18). As in (A.10), we decompose

For the first term

in (A.20), we have

by the Cauchy–Schwarz inequality. It follows that

where

, following analogous reasoning to (A.15) of Hong (1999).
Next, we consider

. By the mean value theorem and the Cauchy–Schwarz inequality, we have

It follows that

given Assumptions A.2–A.4 and A.6, where the term in the second bracket is OP(p2/T2) by Markov's inequality and the fact that

where

as p → ∞ and T → ∞.
Next, for the

term in (A.20), by the Cauchy–Schwarz inequality, we have

It follows from Assumptions A.2, A.3, A.5, and A.6 and Markov's inequality that

Similarly, following analogous reasoning to

, we can obtain

Next, using the mean value theorem for

and

, respectively, we can obtain

and

given Assumptions A.2 and A.4–A.6, where we have made use of the fact that

given Assumption A.6.
Finally, for the

term in (A.20), by Markov's inequality and the fact that

given the m.d.s. property of {εt} under

, we have

Collecting (A.20)–(A.27) and p/T → 0, we obtain

It follows from (A.18), (A.19), and (A.28) that

, given p3/T2 → 0. This completes the proof of Theorem A.1. █
Proof of Theorem A.2. Given (A.6), we can write

First we consider the term

in (A.29). Recalling that

, we have

As shown in the proof of Theorem A.1, we have

and

in (A.10). Therefore, we only need to bound the order of magnitude for the term

Using (A.11), we can decompose

For the first term in (A.30),

, we have

by the Cauchy–Schwarz inequality, (A.12), and the fact that

under

, as implied by Hong and Lee (2005, Thm. 1).
Similarly, for the second to fourth terms

,

, and

, by the Cauchy–Schwarz inequality and (A.13)–(A.16), we have for d = 2,3,4,

Finally, we consider the last term

. Recalling that

, and using the triangle inequality, we have

where the first term is OP(T1/2) by Markov's inequality, Minkowski's inequality,

, |k(·)| ≤ 1, and

under

; the second term is also OP(T1/2) by the Cauchy–Schwarz inequality,

, |k(·)| ≤ 1, and

as is shown in Hong and Lee (2005, Prop. A.1).
Combining (A.30)–(A.34),

, and

, we obtain

It remains to consider the term

in (A.29). By the Cauchy–Schwarz inequality and

from Proposition A.2, we have

The desired result of Theorem A.2 then follows from (A.29), (A.35), (A.36), and p2/T → 0. █
Proof of Theorem 2. Recall that ht−j(v) = ψt−j(v) − Gt′ βj(v), where ψt−j(v) = eivεt−j − φ(v), Gt = (∂/∂θ)g(It−1,θ0), and βj(v) = [E(Gt Gt′)]−1E [Gtψt−j(v)]. We define the following pseudo test statistic:

where

,

The proof of Theorem 2 consists of the proofs of Theorems A.3 and A.4, which follow, where Theorem A.3 shows that replacing the estimated residuals

with the unobservable sample {εt}t=1T and replacing the OLS estimators

with their population counterparts do not affect the asymptotic behavior of

under

. Theorem A.4 shows that (p1/2/T)M1d(p) converges to a well-defined probability limit under

from which the

test gains its power.
THEOREM A.3. Under the conditions of Theorem 2,

.
THEOREM A.4. Under the conditions of Theorem 2,

Proof of Theorem A.3. It suffices to show that (i)

(ii)

; (iii)

; and (iv) D1d(p) ∝ p. Here we focus on the proof of (i). The proofs of (ii) and (iii) are straightforward, and the result (iv) that D1d(p) ∝ p can be shown in a similar way to the proof of the

term in Hong and Lee (2005, proof of Thm. 1).
To show (A.37), we decompose

where

From the Cauchy–Schwarz inequality and the fact that

under

as is implied by Theorem A.4 (the proof of Theorem A.4 does not depend on Theorem A.3) and

, it suffices to show that

.
By straightforward algebra, we have j > 0,

For the first term in (A.39), by the Cauchy–Schwarz inequality, we have

where

given the fact that

is the OLS estimated residual of regressing

on

. It follows from (A.3) and

that

Next, using the inequality that |eiz1 − eiz2| ≤ |z1 − z2| for any real-valued z1 and z2, and the Cauchy–Schwarz inequality, we have

. It follows from (A.3) and Markov's inequality that

For the third term in (A.39), we have

given

and |φ(v)| ≤ 1. It follows that

by Markov's inequality and the fact that

using Assumption A.5 and a standard mixing inequality. Note that {εt} is not an m.d.s. under

.
Now, we turn to the fourth term

in (A.39). Recalling that

and

, we have

where we made use of the fact that

with probability approach 1, which has been shown in the proof of Theorem A.1. Moreover, we have

where

, by Assumptions A.2–A.4 and the mean value theorem for the second term. It follows from Markov's inequality that

Finally, we consider the last term

in (A.39). By the Cauchy–Schwarz inequality, we have

We now focus on

. Noting that βj(v) = [E(Gt Gt′)]−1ηj(v), we decompose

Using (A.8) and (A.9) and Chebyshev's inequality, we have

. This implies

given that E(Gt Gt′) is O(1) and nonsingular. Moreover, given

, we have

. It follows that

Therefore, we obtain

where we used the fact that

.
Next, we consider

, for which it suffices to consider

. We write

where the

are defined as in (A.11). As shown in the proof of Theorem A.1, we have

Moreover, given |k(·)| ≤ 1, we have

where

given Assumption A.5 and the standard mixing inequality ∥ηj(v)∥ ≤ Cα(j)(ν−1)/ν. It follows that

Combining (A.45)–(A.47), we obtain

Combining (A.39)–(A.44) and (A.48) then yields

given p/T → 0. This completes the proof of Theorem A.3. █
Proof of Theorem A.4. See Hong (1999, proof of Thm. 5) for the case of (m,l) = (1,0). We note that following reasoning analogous to the proof of Hong and Lee (2005, proof of Thm. 1), we can obtain C1d(p) = OP(p) and

, where Dd is as in Theorem 2. █