Implications
Estimates of daily enteric methane production by individual cattle derived by averaging multiple short-term measures of emission rate are complementary to and consistent with respiration chamber-derived measures, offering capability to measure many animals in their production environment over extended periods of time. Repeated short-term measures made using a GreenFeed Emission Monitoring unit thus provide a valid means of quantifying livestock methane emissions. This may have application in verifying on-farm mitigation claims for carbon trading schemes and in generating high volumes of individual animal data to enable genomic selection of cattle based on enteric emission rates.
Introduction
Accurate methods of measuring of daily methane production (DMP; g CH4/day) and methane yield (MY; g CH4/kg of dry matter intake, DMI) from ruminants are essential for discovery of methane mitigation strategies and development of national inventories. There is a strong need to develop fast, simple and low-cost methods to measure enteric methane emissions on-farm (Reference Pickering, de Haas, Basarab, Cammack, Hayes, Hegarty, Lassen, McEwan, Miller, Pinares-Patiño, Shackell, Vercoe and OddyPickering et al., Reference Pickering, Oddy, Basarab, Cammack, Hayes, Hegarty, Lassen, McEwan, Miller, Pinares-Patiño and de Haas2015). For many years, most DMP measurements have been made over one or more 22 to 24 h period in respiration chambers (RC), or in the field using the sulfur hexafluoride (SF6) tracer method (Johnson et al., Reference Johnson, Huyler, Westberg, Lamb and Zimmerman1994; Deighton et al., Reference Deighton, Williams, Hanna, Eckard, Boland, Wales and Moate2014). Recently, multiple short-term enteric emission measurements have being used for regularly measuring larger numbers of animals within production systems (Garnsworthy et al., Reference Garnsworthy, Craigon, Hernandez-Medrano and Saunders2012a). Estimates of DMP based on short-term flux (3 to 120 min) including by confinement (Robinson et al., Reference Robinson, Bickell, Toovey, Revell and Vercoe2010; Goopy et al., Reference Goopy, Woodgate, Donaldson, Robinson and Hegarty2011) or imputed from the methane concentration in expired air (Chagunda and Yan, Reference Chagunda and Yan2011; Garnsworthy et al., Reference Garnsworthy, Craigon, Hernandez-Medrano and Saunders2012b) are being evaluated and compared (Huhtanen et al., Reference Huhtanen, Krizsan, Hetta, Gidlund and Cabezas Garcia2014; Dorich et al., Reference Dorich, Varner, Pereira, Martineau, Soder and Brito2015) The GreenFeed Emission Monitoring system (GEM; C-Lock Inc., Rapid City, South Dakota, USA) is a commercial system developed to estimate DMP of cattle from repeated short-term measures of methane emission over a period of days, weeks or months. The objective of this study was to compare DMP estimated by GEM systems with DMP measured by RC for cattle fed roughage-based diets. It was hypothesized that multiple emission measurements made over short (3 to 5 min) periods could be averaged to provide an estimate of DMP that does not differ from that obtained by complete collection of expired gases in an RC.
Material and methods
Two experiments were conducted 10 months apart with measurements of methane emission being determined from cattle using GEM and RC techniques within each of six experimental periods in each experiment. The six measurement periods were consecutive and animals left the RC from one period to commence the 1st day of GEM measurement in the next period. The GEM system delivering pelleted supplement as an attractant was evaluated in both experiments while a GEM system delivering water as an attractant (GEM water) was only evaluated in experiment 1 (Expt. 1). These studies were approved by the University of New England Animal Ethics Committee (AEC 11–126 for Expt. 1 and 12–077 for experiment 2 (Expt. 2)).
Animals and feeding
In Expt. 1, five female Shorthorn cattle varying in age and in live weight (LW) from 392 to 680 kg (518±132 kg LW SD) were group-housed in a pen (8×12 m) in an open barn with access to an outside exercise pen (10×12 m). The range in animal LW was chosen to induce variable voluntary feed intakes so the emissions would span a range of DMP. Cattle were not lactating with one heifer in the first trimester of pregnancy. Cattle had 18 days to adapt to the diet, environment and GEMs before the measurements commencing but had no RC experience before the study. One animal exhibited high feed refusals in the RC so all data from this animal was excluded from analysis. The main ration was a lucerne/oaten chaff blend (Manuka Chaff Mill, Quirindi, NSW, Australia; 8.8 MJ metabolizable energy (ME)/kg DM; 11.2% CP; 55% NDF, 33% ADF in DM). The chaff was provided ad libitum to all animals through a ‘Ruddweigh’ (Ruddweigh, Guyra, NSW, Australia) feed dispenser with cattle identified by radio frequency ear-tag (RFID), so that each meal of each individual animal was recorded (Bindon, Reference Bindon2001). The weight of all meals consumed in a day was summed and compared with the known weight of chaff added to the feeder daily to confirm the accuracy of the scales in the feed dispenser.
In addition to the chaff, cattle were also provided with a measured quantity of pelleted supplement each time they accessed the GEM unit (13.2 MJ ME/kg DM, 12.7% CP, 24% NDF, 11% ADF, 3.1% fat; 70% barley, 20% lucerne). When in the RC each animal was offered a quantity of mixed chaff and pellets equal to its voluntary consumption of these feeds (from Ruddweigh and GEM units) over the 2 days preceding RC entry. As it is known that methane production is affected by intake not only on the day of measurement, but at least on the preceding 2 days (Robinson et al., Reference Robinson, Goopy, Hegarty and Vercoe2011), the DMI used in calculation of MY by all techniques was the mean intake (chaff+pellets) on the day of measurement and of the 2 preceding days (i.e. for RC=chamber day+2 preceding days in pen; for GEM=intake in previous RC day+intake during 2 days in pen).
The conduct of Expt. 2 was as for Expt.1 except that 10 Aberdeen Angus steers (365.2±50 kg LW SD) were used, commencing after steers had been adapted to the diet, GEM unit and facilities for 21 days including multiple training periods in RCs. There were no animals removed in Expt. 2. In further difference to Expt. 1, there were slight diet differences with the chaff (ME=9.4 MJ ME/kg DM; 13.0% CP) and supplement (ME=9.5 MJ ME/kg DM, 13.4%CP, 25% NDF, 7% ADF, 2.7% fat in DM) and feed allowance in the RC was based on intake averaged over 3 days before RC entry.
GEM units
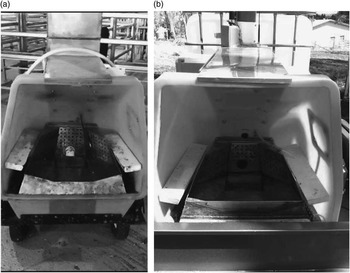
The GEM unit was manufactured by C-Lock Inc. (US Patent 7966971) and the principle of the unit is explained by Zimmerman (Reference Zimmerman2013). For both experiments, a pelleted supplement was provided to cattle in a controlled manner (quantity of supplement/event and number of supplement events/day) based on animal identity as detected by RFID ear-tag. To access the supplement, cattle placed their head in an open shroud where the pellets were provided (Figure 1a) in a scheduled manner. An extraction fan in the airflow system continuously drew air through the shroud and past the neck and head of the feeding animal at a precisely measured rate. This air was filtered and the concentrations of methane, CO2 and propane (released periodically as a reference gas) were determined in the exhaust. Air filters were not changed during either experiment as airflow did not fall below the 27 l/s minimum criteria. The background gas concentrations to be deducted from gas concentrations measured during an animal’s visit were calculated for each second of the visit. For each visit to the GEM, a linear relationship was automatically fitted between the ambient pre-visit gas concentrations (averaged over 30 s before animal entry) and the gas concentrations post-visit (again averaged over 30 s after the animal has exited the GEM) to estimate background concentrations for every second of measurement.
GreenFeed Emission Monitoring (GEM) units showing shroud where cattle enter to receive a pelleted supplement (GEM supplement; a) or water (GEM water; b) based on animal RFID identification.

Methane and CO2 calibrations and CO2 recovery tests were performed weekly during both experiments. The purpose of the calibrations was to define sensor responses to known concentrations of methane and CO2. Recovery of a gravimetrically determined quantity of CO2 released over 20 min into the shroud was calculated from the CO2 concentration and air flow rate through the GEM to verify gases released in the shroud were completely drawn into the exhaust stream.
A feeding period of 3 to 5 min typically detected several eructation events. To identify occasions when animals stepped away from the shroud during methane measurement and methane could have been lost, a proximity sensor in the shroud monitored the head-position of the animal throughout each feeding event. A measure of methane production rate (expressed as g CH4/day or DMP) was only generated when an animal’s head was continuously in the shroud for 3 min (described as a useful GEM visit). Data from GEM visits when animals did not keep their head in the shroud for the full 3 min were not utilized. To estimate the DMP rate of a given animal on a given day, the arithmetic mean of emission rates of all useful GEM visits by that animal on that day was calculated. No data were removed because of being unexpectedly high or low, so any outlier emission measurements contributed to the DMP of that day.
In Expt. 1, pellets delivered by the GEM unit were made at the University of New England using a pellet press with a 6 mm diameter. Pellet delivery in the GEM was programmed so that each animal was able to access up to five drops of pellets per supplement session (54.9±0.8 g pellet/drop), with 40 s between each drop and a minimum of 3 h between supplement sessions. In Expt. 2, the supplement pellets (Pryde‘s EasiFeed, Gunnedah, NSW, Australia; 6 mm diameter) were again delivered to provide five drops of pellet (30.5±0.9 g/drop) with 50 s between drops and a 4 h delay between supplement sessions. The smaller drop size, longer between-drop and between-session delays were implemented to increase duration of each visit while keeping supplement as a minor proportion of the total feed intake. The pellet hopper was checked daily and kept filled throughout the study.
The GEM was located at the end of a 2×0.7 m alleyway, which restricted access to one animal at a time. The extraction fan in the GEM was turned off when cattle were first introduced to the unit to reduce noise and maximize visitation. All GEM units were powered by 240 V mains power and were operated within a portion of a large shed (36×25 m).
The GEM water unit (used in Expt. 1) was designed and built by C-Lock Inc. and was used concurrently with the supplement delivering GEM device. Water was used as the attractant in place of pellets (Figure 1b). Water was supplied from a high-pressure source into a shallow stainless steel bowl in the shroud. Water was replenished automatically as long as an animal remained at the unit but there was no rationing or quantification of water as there was for pellets.
RC
Five open circuit RC were used in Expt. 1 and 10 RC used in Expt. 2. Chambers (3.6×2.4×2.4 m) were constructed of polycarbonate sheet (4 mm thickness) fixed to a hot-dipped galvanized frame (Hegarty et al., Reference Hegarty, Bird and Woodgate2012). The RC did not have a floor but were able to seal into a water-filled rebate in the concrete floor and then be lifted by pneumatic rams to allow cleaning. Within the polycarbonate box, a pen made of steel cattle panels (3×1.8×1.8 m) was bolted to the floor to confine the cattle. Cattle entered and exited the RC by a polycarbonate door fitted into the RC frame and a steel gate on the internal pen.
The daily feed allocation (chaff+supplement) was provided as a single meal immediately before sealing the RC. An air flow system (outside shed – RC – flow meter – high pressure fan) drew fresh air through each RC (∼1400 l/min), with the rate of flow though the exhaust line from each RC measured by an SCI mass flow meter (Model ST75V, Fluid Components International, San Marcos, CA, USA). A subsample of air from each RC (2 l/min) was continuously drawn from the exhaust line adjacent to the site of the flow meter, dried using a refrigerated drier (4°C) and passed through a multiplexer. The CO2 and methane concentrations in these dried samples of exhaust air from each RC and a dried sample of concurrent ambient air were determined consecutively throughout the 24 h measurement period, with the dried sample pumped into a Servomex 4100 analyzer (Servomex Group Limited, Crowborough, East Sussex, UK) fitted with GFx infrared sensors. Each sample took 60 s for purge and analysis so gases leaving each RC were measured every 12 min.
Sample drying, analytical and data processing software were configured by AZCO Holdings (Auckland, New Zealand). The gas analyzer was calibrated each morning using a standard mixed gas and recovery of methane through RC was checked by introducing a standard pulse of methane (99% purity) before and after each experiment, with all emission data corrected to 100% methane recovery. Animals were randomly rotated through RC, with each animal measured in a different RC in each period.
Predicted MY
MY and DMP were also predicted from the gross energy of the feed and the Intergovernmental Panel on Climate Change (IPCC) emission factor (IPCC, 2006) for comparison to values determined in experiments 1 and 2. Gross energy intake (GEI) was calculated from the chemical composition of the chaff and pellets in each experiment assuming a 19% loss of the apparently digestible energy (excreted in the urine and as methane; McDonald et al., Reference McDonald, Edwards, Greenhagh, Morgan, Sinclair and Wilkinson2011). ME (MJ/kg DM) was calculated using the prediction equations recommended by the Australian Fodder Industry Association (2014) laboratory methods manual for roughages other than silages (ME=0.203×DOMD (%)−3.001). Digestibility of the organic matter in the dry matter (DOMD) was estimated using the Pepsin-Cellulase method (Australian Fodder Industry Association, 2014).
Statistical analysis
Mixed model analyses were conducted for MY and DMP (covariate-adjusted for DMI) in Genstat (Payne et al., Reference Payne, Harding, Murray, Soutar, Baird, Glaser, Welham, Gilmour, Thompson and Webster2011), using the residual maximum likelihood procedure. Animal was fitted as a random effect, and measurement technique as a fixed effect (RC, GEM, GEM water when present). This simplified model was adopted after first testing for day and period effects. Including ‘day’ (of measurement) as a covariate showed no effect for DMP or MY (P=0.4 to 0.8), justifying the assumption (of no time-trend), which is necessary for the analysis of this systematic random design. Residual plots were used to check the validity of the underlying statistical assumptions of homogeneity of variances and normality. The estimated means for the measurement techniques were subjected to protected least significance difference testing (at the 5% level) in Expt. 1. With the prolonged multi-period design, there was the possibility of animals adapting differentially to each measurement technique over time (e.g. as they became more familiar with the GEM unit and with confinement in RC units). This was investigated in both experiments by fitting the period×technique interaction (for DMP and MY); 95% confidence intervals (CI) were calculated for the measurement techniques in each experiment, and used in the combined analysis of both experiments. RC and GEM supplement means from both experiments were pooled and a statistical hypothesis test was performed. All 95% CI were compared against the IPCC predicted emissions. Steers in Expt. 2 were ranked from the lowest and highest according to their averaged DMP and correlation between methods was calculated (using the Pearson coefficient). In Expt. 2, diurnal variation in GEM-derived DMP estimates was investigated using a spline model, which included animal as a fixed effect.
Results
Feed intake
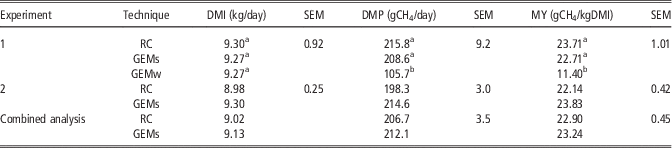
In Expt. 1, there was no difference (P>0.05) between DMI during the RC and GEM monitoring periods, based on intake averaged over these 3 days (Table 1). In Expt. 2, daily intake of the steers did not differ (R 2=0.88, P>0.05) between GEM and RC methods (9.3 and 9.3 kg/day, respectively), with refusals in the RC<5% of the feed offered.
Dry matter intake (DMI), daily methane production (DMP) and methane yield (MY) measured by open circuit respiration chambers (RC), by GreenFeed Emission Monitoring (GEM) units delivering supplement (GEMs) or delivering water (GEMw) as attractants

a,bValues within a column with different superscripts differ significantly at P<0.05.
Animal visitation and emission profile of GEM units
Expt. 1
Of the 40 available feed drops/day (in up to eight supplement sessions), the cattle averaged 22.4 drops/day providing a minimum monitoring time of 14.9 min/animal per day and a mean daily pellet consumption of 1230 g/day. Either because cattle were interrupted during a feeding period or because they did not stay with head fully inside the shroud for a constant 3 min, an average of 3.1 useful GEM visits/animal per day were made with an average visit duration 4.4 min/visit.
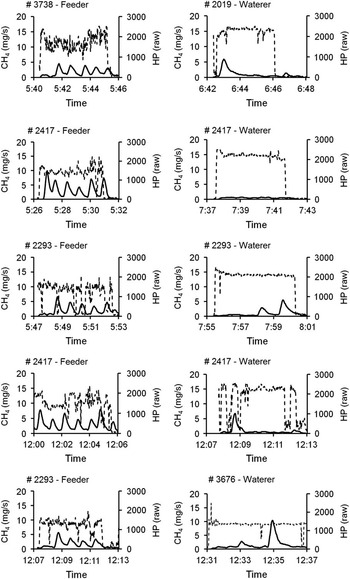
The amount of water consumed by cattle using the GEM water unit was not recorded. Differences in eructation pattern were apparent between cattle using a GEM water unit and a standard GEM unit (Figure 2). Animals visited the GEM water unit with similar frequency to the GEM unit (2.80 v. 3.46 visits/day, respectively), but the eructations were much less frequent, with 0.38 v. 1.31 (SD=0.08) eructations per min, being one eructation per 2.6 min instead of one eructation per 46 s as for the GEM unit. GEM water measures included a number of visits with no eructations, which were discarded from the analyses as were periods with <3 min of continuous monitoring data, lowering the number of useful GEM visits (1.52 visits per day SD=0.52) that contributed to the average DMP.
Short-term emissions profile of methane concentrations (solid lines) in exhaust air of cattle over 4 to 6 min monitored using the GreenFeed Emission Monitors (GEM) with pelleted supplement as an attractant (LHS: ‘Feeder’=GEM supplement) or water as an attractant (RHS: ‘Waterer’=GEM water). Head position (HP, dashed line) units are arbitrary, with a value over 1000 indicating the head is in a position suitable for data collection. Eructation events appear as a sharp peak in solid line, being less frequent and less regular from cattle when they attend the GEM water unit.

Expt. 2
An average of 4.6 useful GEM visits were made from the six scheduled potential visits/animal per day. Each steer consumed an average of 27.5 drops of pellets/day, giving a mean daily pellet consumption of 840 g/animal per day. Average GEM visit duration was 5 min (±0.2 min) totaling 230 min of data collected/day for the group.
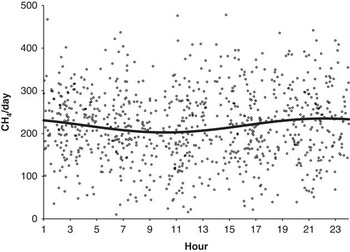
The spline model of short-term emission rates showed significant cyclic diurnal patterns for DMP estimated by the GEM (P<0.01) with a 14.9% difference between daily maximum and minimum emission rates. Visits to the GEM showed a uniform pattern over the daily period for all the 10 steers over the six periods (Figure 3). An analysis of the rate of methane production showed the model explained only 2.5% of the variation in DMP among all the individual useful GEM visits (Figure 3) but if all emission values within each 12 min period were averaged the spline through averaged values explained 89% of the variation.
Compilation of all individual methane production rate (gCH4/day) estimates from 10 steers collected from the GreenFeed Emission Monitors (GEM) unit during experiment 2. Each useful GEM visit (>3 min continuous data collection) is shown as a spot, with a spline curved fitted to indicate diurnal variation in mean emission rate. Number of visits in each consecutive 4 h period from midnight to midnight are 152, 152, 138, 106, 143 and 137 visits.

Methane production and yield
Expt. 1
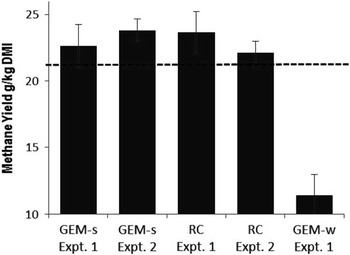
There was no difference in DMP or MY determined by the GEM and RC techniques (P>0.05; Table 1). Emissions measured from the GEM water unit were significantly lower than emissions measured by GEM and RC (P<0.05). Because of the small number of animals and the high variation between animals in Expt. 1, an alternative analysis of DMP was utilized based on the CI of the data. The 95% CI was calculated to compare measured MY v. MY predicted by IPCC (2006). Predicted MY (21.3 g CH4/kg DMI) calculated as 6.5% of the GEI was more than 1 SEM lower than MY measured by RC.
Expt. 2
Agreement between methods was assessed using 95% CI and Pearson’s correlation coefficients between DMP and MY rankings of individuals. Correlation coefficients were calculated for DMP and MY using individual rankings (periods were averaged to get one mean per individual per method). The strength of the relationship between methods was high for DMP (r=0.85) and moderate for MY (r=0.58) with no difference between measurement techniques (Figure 4) for MY. IPCC predicted MY (21.3 gCH4/kg DMI), however, was lower than that measured using RC (22.1 g CH4/kg DMI) and GEM supplement (23.8 g CH4/kg DMI).
Methane yield results (g/kg dry matter intake (DMI)) by method (GreenFeed Emission Monitors (GEM) dispensing supplement (GEMs) or water (GEMw) or respiration chamber (RC)) and by experiment with 95% confidence interval. Dotted line corresponds to the predicted methane yield based on IPCC, 2006.

Combined analysis of DMP and MY from Expt. 1 and Expt. 2
Combined data from Expts. 1 and 2 was used in a post-hoc comparison of GEM and RC techniques for determining DMP and MY. There were no differences in DMP or MY (P=0.282 and 0.596, respectively) within data pooled across experiments for these two measurement techniques. Average MYs over Expt. 1 and Expt. 2 were 23.24 and 22.9 g CH4/kg DMI, respectively, while the corresponding DMP was 212.2 and 206.7 g CH4/day, respectively (Table 1).
Discussion
Increasing demand to measure DMP and MY of large numbers of ruminants for genetic or mitigation studies, necessitates development of methods to measure animal emissions in their production environment. This has been attempted using the SF6 tracer technique (Woodward et al., Reference Woodward, Waghorn and Laboyrie2004; Deighton et al., Reference Deighton, Williams, Hanna, Eckard, Boland, Wales and Moate2014) and by short-term confinement in portable accumulation chambers for sheep (Goopy et al., Reference Goopy, Woodgate, Donaldson, Robinson and Hegarty2011), sampling methane concentration during milking for dairy cows (Garnsworthy et al., Reference Garnsworthy, Craigon, Hernandez-Medrano and Saunders2012b), during feeding (Huhtanen et al., Reference Huhtanen, Cabezas Garcia, Zimmerman and Zimmerman2013; Velazco et al., Reference Velazco, Bremner, De Barbieri and Hegarty2013), or when drinking water (McGinn et al., Reference McGinn, Turner, Tomkins, Charmley, Bishop-Hurley and Chen2010). The CV of DMP estimated from short-term emission measures (2 min to 2 h) is often higher than for RCs (Hegarty, Reference Hegarty2013), but emission estimates based on shorter measurement periods are highly correlated with DMP (Robinson et al., Reference Robinson, Goopy, Hegarty and Vercoe2011). Consequently there is scope to obtain measures of DMP from 2 min to 2 h emission measurements if multiple measurements can be obtained.
Diurnal patterns in methane emissions of grazing ruminants are known (Lockyer and Jarvis, Reference Lockyer and Jarvis1995) and match the bimodal diurnal grazing pattern (Goopy et al., Reference Goopy, Hegarty and Robinson2009) due to the rapid rise then decline in emissions post-feeding (Nolan et al., Reference Nolan, Hegarty, Hegarty, Godwin and Woodgate2010). Consequently, it can be anticipated that sampling emissions in a schedule that will account for diurnal variation (as achieved in Expt. 2, see Figure 3), would be important to accurately quantify DMP by multiple short-term emission measures. What has not been clearly defined is the optimum duration of measurement required; how the measurement may be compiled from subsets of data; and how these samplings must be spread within days, over days, weeks or seasons. This is now being addressed by the Animal Selection, Genetics and Genomics Network (Pickering et al., 2013) as they seek to standardize protocols to determine the methane phenotype of individual animals.
The agreement in DMP determined by GEM and RC techniques together with the low SE of fitted values for DMP and MY in this study, demonstrates that the GEM unit is sufficiently accurate to be used for emission quantification. This is consistent with other recent comparisons (Hammond et al., Reference Hammond, Humphries, Crompton, Kirton, Green and Reynolds2013; Hegarty, Reference Hegarty2013; Huhtanen et al., Reference Huhtanen, Cabezas Garcia, Zimmerman and Zimmerman2013) where a high level of agreement between GEM and other methods were observed (differences less than 8%, P>0.10). Huhtanen et al. (Reference Huhtanen, Cabezas Garcia, Zimmerman and Zimmerman2013) also found high repeatability (R=0.81) of DMP when RC measurements were made of dairy cows fed total mixed rations over 2 weeks. Under grazing conditions, Waghorn et al. (Reference Waghorn, Garnett, Pinares-Patiño and Zimmerman2013) reported a positive correlation (R 2=0.72) between DMP as measured by GEM, and the DMP estimated to arise from feed consumed to provide the ME requirements of the Holstein Friesian cows.
Emissions are potentially variable over seasons due to feed quality and availability as documented in Australia’s Tier 2 greenhouse gas inventory (DoE, 2014). It is possible that by sampling an animal for a short period of time, but repeating the sampling many times, short-term measures of enteric methane eructation could provide a more accurate estimate of the emission rate over weeks, months or season than would a single intensive 24 h emission measure in a RC.
Prediction equations developed using RC data show over 70% of the variation in DMP can be explained by DMI or DOMI (Kennedy and Charmley, Reference Kennedy and Charmley2012) but an inability to measure intake of large numbers of individuals (Cottle, Reference Cottle2013) is still the limiting factor to predicting DMP from DMI under commercial grazing conditions. The IPCC estimations for MY compared with GEM and RC (or any equation based on GEI and/or DMI) cannot predict the mitigation effect of dietary compounds (sulfates, nitrates, tannins), diet selection of grazing animals or genetic merit of the animals. The RC is able to identify some such mitigation effects but is expensive, time-consuming and subjects animals to an artificial environment in which feed intake is controlled (Pickering et al., Reference Pickering, de Haas, Basarab, Cammack, Hayes, Hegarty, Lassen, McEwan, Miller, Pinares-Patiño, Shackell, Vercoe and Oddy2013).
Unlike a RC, a GEM unit can potentially monitor enteric emissions over multiple short periods from in excess of 20 cattle able to access it, providing the ability to measure this population over longer periods (e.g. months) in their production environment while expressing largely natural diet selection and consumption. The prolonged measurement period (daily data for weeks or months) should allow for the detection of small treatment differences in emissions using GEM. Making measurements in the grazing environment would also allow changes in emissions due to diet selection or diurnal grazing pattern based on animal choice to be detected; in difference to RC systems, which constrain the ration available and the timing of feeding so diurnal variation observed. While the GEM can estimate DMP of animals in their production environment, accurate feed intake data are less likely to be available in such a situation than when DMP is being measured by RC, so GEM methane emission data are less likely to be used for MY calculation than is RC data. The possibility of the GEM-supplied supplement affecting grazing behavior, feed intake and DMP requires investigation.
The fact that data were collected for 4.95 min/visit on average, indicates that cattle stayed in position in the GEM until supplement delivery was complete (delivery of supplement took maximum of 3.33 min/visit in Expt. 1 and 5 min/session in Expt. 2). Uniform distribution of visits over the day would ideally sample the diurnal feeding cycle of grazing animals (Albright and Arave, Reference Albright and Arave1997) minimizing the risk of biasing the estimation of DMP. A very even distribution of sampling time over the 24 h by the herd was apparent throughout this study (Figure 3) indicating that scheduling supplement supply to occur at intervals gave GEM the capacity to adequately sample the daily emission profile of the herd. The weak diurnal variation in emissions apparent in Figure 3 suggests such sampling across the 24 h cycle would avoid biasing the DMP estimate.
Aside from the need to manage the monitoring schedule to avoid bias, the provision of supplement by the GEM unit risks affecting DMP by two means. First, the supplement itself could affect DMP by affecting the total fermentable energy entering the rumen. In Expt. 1, the average ME consumed as supplement (14.9 MJ/day) was 17% of the average daily ME intake; potentially affecting DMP by not only augmenting the fermentable ME intake, but also by providing nutrients that could enhance the fermentability of the chaff diet. To minimize that risk without compromising the duration of the data collection, ME consumed as supplement was reduced to 9% of the daily ME intake in Expt. 2 (by reducing ME content in the pellets and reducing the weight delivered per drop) and further reductions may be possible. A second means by which a supplement could affect emissions is by potentially affecting intake of the basal ration or pasture. Repeated accessing of the GEM could affect the grazing habits of the cattle being measured (Bowman and Sowell, Reference Bowman and Sowell1997), thereby biasing their DMP by increasing or decreasing the composition and/or quantity of basal pasture consumed. Data are required on these two possibilities to be sure that the supplement provided by GEM has minimum effect on the DMP of livestock.
To alleviate the possible problem of the supplement affecting DMP, and also because animals may choose to not access supplement, a GEM system using drinking water as the attractant was tested in Expt. 1. The observation that eructation pattern was different when water was used to attract animals (Figure 2) identifies the need to use different data screening of emission profiles from a water unit than from a supplement unit. There is also a need to optimize the rate of water supply through the GEM water unit to ensure that, with the different eructation pattern, cattle remain in the unit long enough to give a measurement period containing adequate eructation events. So while the GEM water prototype showed some weaknesses, the fact it does not introduce exogenous energy to bias DMP and the fact that all animals must drink, means further development appears warranted.
It is uncertain what proportion of a herd would voluntarily visit a GEM unit, but this study found that familiarizing animals for 3 weeks before commencing measurements minimized the risk of low recruitment. Based on observations in these and other GEM studies, an introductory protocol for high recruitment is likely to include: scheduling supplement delivery to be liberal (multiple sessions of six or more drops/session); use of pellets flavored with a taste or smell attractant (e.g. aniseed); turning off the GEM extraction fan to make the unit quieter and avoid frightening the animals; widening the alleyway to promote the visit of shy feeders; reducing the amount of supplement delivered to dominant animals based on their identity.
Since many researchers require MY measurement, there is also opportunity to deliver indigestible markers through the GEM and GEM water units, coupling this with fecal sampling to estimate fecal output and so DMI. Indigestible markers have previously been used to estimate intake in grazing sheep, giving rise to genetic parameters for DMI (Fogarty et al., Reference Fogarty, Lee, Ingham, Gaunt and Cummins2006). Recently, provision of markers in supplement dispensers to estimate feed intake has been patented (Patent 13/391,116).
In summary, the arithmetic mean of many short-term measurements of methane production rate from the GEM unit provided an estimate of DMP that did not differ from that determined by open circuit calorimetery of roughage-fed cattle. On an individual animal basis, ranking in the GEM and RC systems correlated highly (Expt. 2; R 2=0.71). This supports development of short-term emission rate monitoring as an approach to quantify emissions for both inventory and mitigation purposes. The ability of short-term emission measurement devices such as the GEM unit to estimate DMP in animals in their production environment creates opportunities for detecting emission changes arising from grazing behavior and diet selection, which are not possible in RCs. Validation of GEM-derived estimates of DMP in the grazing environment are still required. The possibility of coupling emission measures with digesta markers and fecal sampling may allow simultaneous estimation of DMI and so of MY during studies using GEM.
Acknowledgments
One of the authors (S.Z.) is employed by C-Lock Inc. who developed, manufacture and sells the GreenFeed Emission Monitoring units used in this study. Funding for the work reported here was provided by the Australian Government Department of Agriculture as part of the Climate Change Research Program, and by Meat and Livestock Australia.