Introduction
While the adage “form follows function” may serve as a fundamental architectural principle, the materials science community knows better. This paradigm of the Bauhaus design cannot be embraced for nanoporous metals produced by dealloying. Without a critical understanding of the nuanced structural characteristics of these unique materials, their optimization and exploitation for multifunctional applications cannot be adequately achieved. This is perhaps in contrast to other open-cellular structures, such as those fabricated using additive manufacturing techniques. Unlike those structures where structural elements are chosen and manipulated to achieve a targeted stiffness, specific weight, or strength, the resultant structure of dealloyed materials is dictated by their inherent dealloying and coarsening mechanisms.
In this article, we review the state of the art in the structural characterization of nanoporous metals fabricated by dealloying processes, focusing largely on nanoporous gold (NPG), and explore the significance of various aspects of structure—that of structural geometry and of microstructure. The former can be considered from both morphological and topological points of view, while the latter explores the internal crystallography and defect structure. We do not explicitly explore the mechanisms of structural evolution, a topic better explored by McCue et al. in this issue.Reference McCue, Karma and Erlebacher1 We do, however, address the implications from structural characterization on revealing active deformation mechanisms. Although the structure–property relationships important to nanoporous metals span a broad spectrum of complex and interdependent functionalities (see the Introductory article in this issue),Reference Weissmüller and Sieradzki2 we use mechanical behavior as a framework to exemplify the significance of certain structural aspects. For more details on the mechanical behavior of nanoporous metals, we refer the reader to the Jin et al. article in this issue.Reference Jin, Weissmüller and Farkas3
Key challenges for structural characterization
In order to establish adequate characteristics of structural geometry and microstructure of nanoporous metals, one must first understand the challenges unique to this material. The structural length scales of interest range from the crystalline defect structure at the smallest scales up to the structural geometry scale (e.g., the ligaments and pores). In NPG, these range from nanometers up to microns. Moreover, the concept of a representative volume element (RVE) establishes the smallest volume of material needed for investigation.
An RVE is the smallest volume over which a measurement can be made that will yield a value representative of the whole;Reference Hill4 it is difficult to experimentally identify rigorously. It is possible that an RVE can be defined for a given set of measurements, but it does not hold as an RVE for all possible measurements, thus certain properties may require substantially larger volumes for adequate assessment.
The methods available for characterizing the structure of nanoporous metals continue to develop, and approaches for analyzing experimental observations continue to improve. The field has come a long way from the original scanning electron microscope (SEM) micrographs of NPG at varying stages of coarsening published in a groundbreaking paper by Li and Sieradzki in 1992Reference Li and Sieradzki5 that introduced this unique material to the scientific community. Small-angle neutron scattering (SANS),Reference Corcoran, Wiesler, Sieradzki, Andricacos, Corcoran, Delplancke, Moffat and Searson6 transmission electron microscopy (TEM),Reference Parida, Kramer, Volkert, Rösner, Erlebacher and Weissmüller7 ion channeling,Reference Volkert, Lilleodden, Kramer and Wiessmüller8 electron backscatter diffraction (EBSD),Reference Petegem, Brandstetter, Maass, Hodge, El-Dasher, Biener and van Swygenhoven9,Reference Jin, Kurmanaeva, Schmauch, Rösner, Ivanisenko and Weissmüller10 and x-ray diffraction (XRD)Reference Petegem, Brandstetter, Maass, Hodge, El-Dasher, Biener and van Swygenhoven9,Reference Dotzler, Ingham, Illy, Wallwork, Ryan and Toney11 are incredibly useful techniques for studying structural characteristics such as ligament and pore dimensions, defect structures, and local orientations. Yet topological characterization requires a three-dimensional (3D) approach. Until recently, x-ray-Reference Chen, Chu, Yi, McNulty, Shen, Voorhees and Dunand12,Reference Chen-Wiegart, Wang, Chu, Liu, McNulty, Voorhees and Dunand13 and TEM-basedReference Rösner, Parida, Kramer, Volkert and Weissmüller14 tomographic techniques were used for evaluating 3D structures. More recently, destructive serial sectioning techniques using focused ion beams (FIB) have shown great promise for identifying 3D structures spanning nanometers to tens of microns in length.Reference Mangipudi, Radisch, Holzer and Volkert15,Reference Hu, Ziehmer, Wang and Lilleodden16 Through the use of correlation schemes for bridging multiple length scale tomographic investigationsReference Uchic, Holzer, Inkson, Principe and Munroe17 along with advances in ion probes for higher efficiency, lower damage, and higher volume reconstructions,Reference Burnett, Kelley, Winiarski, Contreras, Daly, Gholinia, Burke and Withers18 high-resolution 3D characterization of bulk nanoporous metals is achievable.
Key structural aspects
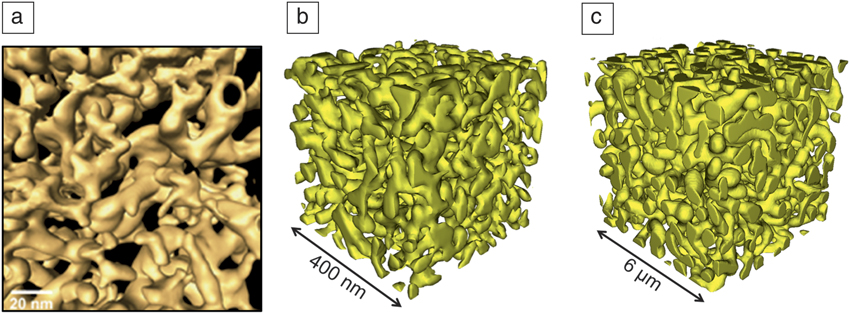
The dealloying process used to produce nanoporous gold structures results in a bicontinuous two-phase mixture of gold and void. There are many examples of bicontinuous structures in nature, such as those found following phase separation in block copolymers, spinodal decomposition, and spinodal ordering. In all cases, the structures produce an interconnected network structure, with a number of structural characteristics, some of which are easier to assess than others. Ideally, a 3D reconstruction of the network structure is obtained, for which algorithms must be developed and appropriately applied to generate metric and topological parameters. Examples of 3D tomographs of NPG are shown in Figure 1, for an as-dealloyed NPG foil using TEM,Reference Rösner, Parida, Kramer, Volkert and Weissmüller14 as well as for as-dealloyed and coarsened bulk NPG.Reference Hu, Ziehmer, Wang and Lilleodden16 Before experimental results from structural characterization can be further discussed, it is critical to first describe the types of structural characteristics important for nanoporous metals.
Three-dimensional tomographs of nanoporous gold. (a) High-angle annular dark-field scanning transmission electron microscopy tomograph of nanoporous gold prepared from a gold-silver alloy with a composition of Ag.75Au0.25 showing broad distributions in pore and ligament size, a convex surface, and significant microstructural anisotropy. Reprinted with permission from Reference Rösner, Parida, Kramer, Volkert and WeissmüllerReference 14. © 2007 Wiley. (b) A 3D reconstruction from a focused ion beam-based serial sectioning of an as-dealloyed bulk alloy of similar composition with a nominal ligament diameter of 26 nm;Reference Hu, Ziehmer, Wang and Lilleodden16 and (c) of the same dealloyed sample after significant coarsening leading to a nominal ligament diameter of 420 nm.Reference Hu, Ziehmer, Wang and Lilleodden16 (b–c) show less anisotropy than (a), but similar convex surface morphology.

Network morphology
An important class of bicontinuous structures studied extensively in the mathematics community are periodic minimal (surface-area minimizing) surfaces (e.g., Schwartz and Shoen’s G surfaces).Reference Brakke19 Given the large number of periodic surfaces, it is important to determine if the dealloying or subsequent coarsening process yields a bicontinuous two-phase structure similar to these other types of bicontinuous structures.
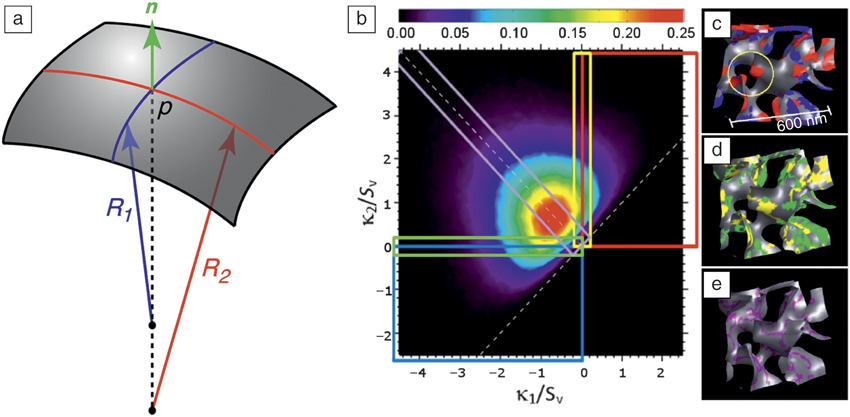
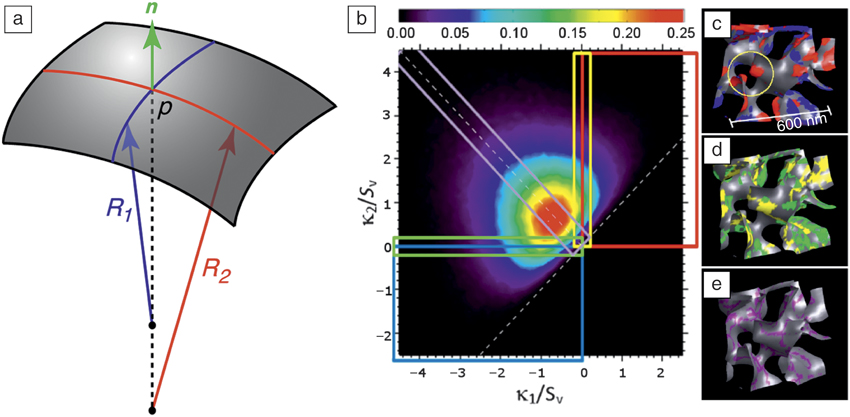
The morphology of a surface is linked to the principal radii of curvature of a small patch of interface, as in Figure 2a. The inverse of the principal radii of curvatures are the curvatures κ1 = 1/R 1, κ2 = 1/R 2. The shape of the patch can be described by the principal radii of curvature or combinations thereof. A particularly advantageous combination is the Gaussian curvature, K, and mean curvature, H:
 $$H = {1 \over 2}\left( {{\kappa _1} + {\kappa _2}} \right),$$
 $$K = {\kappa _1}{\kappa _2}.$$
(a) A patch of interface with normal n, and radii of curvature R 1 and R 2 at a point p. In this case, both curvatures are positive, and the normal points from the gold into the pore; if both curvatures are negative, the normal points from the pore into the gold. (b) Interfacial shape distribution of nanoporous gold; five rectangular regions correspond to particular curvatures shown in the same colors in (c–e). (c) Convex (red) and concave (blue) regions; the circle indicates fission or pinch-off of a ligament into two knobs. (d) Regions with cylindrical patches (yellow and green). (e) Regions with zero mean curvature (purple).Reference Chen, Chu, Yi, McNulty, Shen, Voorhees and Dunand12
The mean and Gaussian curvatures are invariants of the curvature tensor. The mean curvature can be directly connected to the chemical potential of gold atoms of the interface through the Gibbs–Thomson–Freundlich equation:Reference DeHoff20
 $${\rm{\mu }} = {{\rm{\mu }}_{\rm{o}}} + 2{V_m}{\rm{\gamma }}H,$$
where μ is the chemical potential, μo is the chemical potential at a flat interface, V m is the molar volume, and γ is the surface energy. The importance of the Gaussian curvature is now clear, since H = 0 for both a flat interface and a hyperbolic or saddle-shaped surface, where κ1= −κ2. For the flat surface, K = 0, and for the saddle-shaped surface,  $K = - \kappa _1^2$. A surface with one of the principal curvatures equal to 0 is cylindrical, and if κ1 = κ2 > 0 the patch is spherical. If, unlike in Figure 2a, both curvatures are negative, the normal points from the pore into the gold. An alternate combination of principal curvatures is helpful if one is interested in just the morphology of the surface and not the connection to thermodynamics.Reference Koenderink and Vandoorn21–Reference Shahani, Xiao, Skinner, Peters and Voorhees24
Using this description of a patch, or small region of interface, it is possible to construct the interface shape distribution (ISD), which is the probability of finding a patch of the interface with a given (κ1,κ2) or (H, K).Reference Mendoza, Savin, Thornton and Voorhees25 Specifically, I(κ1,κ2) is the fraction of interfacial area in the structure with the pair of curvatures κ1,κ2. This is directly related to the particle-size-distribution function for an array of spherical particles. In this case, only one parameter R = H is needed, since K is fixed, see Equations 1 and 2. The ISD for nanoporous gold has been measured by a number of groups.Reference Chen, Chu, Yi, McNulty, Shen, Voorhees and Dunand12,Reference Chen-Wiegart, Wang, Chu, Liu, McNulty, Voorhees and Dunand13,Reference Mangipudi, Epler and Volkert26–Reference Ziehmer, Hu, Wang and Lilleodden28 Shown in Figure 2b–e is an example for a nanoporous gold sample with a 50% volume fraction of gold. The peak of the ISD is along the dotted line H = 0 (Figure 2b), and the majority of the surface area is composed of patches that are saddle shaped. Larger magnitudes in H are parallel to this line, displaced to the right or left.
It is of interest to know whether the interface has an anisotropic morphology. This is straightforward to assess once the 3D shape of an object has been measured experimentally, since the orientation of the interface follows from the normals of the polygons that make up the mesh used to visualize the object. The interfacial normal distribution (IND) is the probability of finding a normal with a given orientation.Reference Kammer and Voorhees29,Reference Rohrer, Saylor, El Dasher, Adams, Rollett and Wynblatt30 While this provides the orientation distribution in the laboratory frame, it is possible to relate the normals measured in the laboratory frame to the crystallographic frame, if we assume that the NPG is a single crystal.Reference Chen-Wiegart, Wang, Chu, Liu, McNulty, Voorhees and Dunand13,Reference Rohrer, Saylor, El Dasher, Adams, Rollett and Wynblatt30 Since the temperatures at which the NPG structure are created are below the roughening temperature of gold,Reference Barnard31 the NPG interface can display facets.Reference Chen-Wiegart, Wang, Chu, Liu, McNulty, Voorhees and Dunand13
Topology
Topology is a morphology-independent measure of the shape of an object. In three dimensions, the surface average of the mean curvature has units of length, and thus can be dependent on the size scale of the object. However, the surface integral of the Gaussian curvature is length-independent, and thus is a simple number. This number is directly related to the genus, g, of the object by the Gauss–Bonnet theorem:Reference Pressley32
 $$g = 1 - {1 \over {4{\rm{\pi }}}}\mathop \smallint \limits_S^{} Kda,$$
where S is the surface. For a sphere K =1/R 2, and thus g = 0. For a sphere with an internal pore, however, g = −1.
It is possible to generalize our description beyond spheres to show that the genus is defined as the number of cuts that can be made upon a closed surface without separating it into two disconnected bodies. Thus, a cube, a sphere, and a pyramid are all topologically equivalent (g = 0) while a cube with a handle and a doughnut are equivalent (g = 1). Given the difficulty in identifying internal pores in nanoporous gold,Reference Erlebacher33 we ignore them and thus have equivalent terms, genus, and connectivity.
In a bicontinuous structure, topological singularities can occur, for example, interfacial energy driven pinching of ligaments, which decrease the genus. These singularities typically occur on time scales that are much shorter than the overall evolution of the structure itself, as a result of the divergence of the mean curvature and hence chemical potential at a pinching event.Reference Wong, Miksis, Voorhees and Davis34,Reference Aagesen, Johnson, Fife, Voorhees, Miksis, Poulsen, Lauridsen, Marone and Stampanoni35 At the very smallest scales just before pinch-off, other issues may be important, such as plastic flow of the ligament.Reference Kolluri and Demkowicz36 The genus of 3D bicontinuous structures with no internal pores corresponds to the first Betti number (β1) used in homology. The genus can be measured using the Gauss–Bonnet theorem, or through a polygonized mesh that is used to visualize the structure, since the genus is related to the Euler characteristic χ = 2(1 – g) = n – e + f, where n is the number of nodes, e is the number of edges, and f is the number of faces. This implies that the genus or connectivity can be calculated for faceted surfaces as well.
Internal microstructure
Having covered descriptions of network morphology and topology, both of which can be described as structural geometry characteristics, we now discuss the internal crystallographic structure of the NPG ligaments. While the microstructure, considered here to describe the internal structure of a material such as crystal orientation and defect distribution, is often the key structural characteristic of interest for bulk crystalline solids, it is often ignored in describing the structure of NPG. This is largely due to the assumption, supported in part by orientation imaging analyses,Reference Volkert, Lilleodden, Kramer and Wiessmüller8–Reference Jin, Kurmanaeva, Schmauch, Rösner, Ivanisenko and Weissmüller10 that the NPG structure preserves the underlying grain structure of its parent bulk alloy.
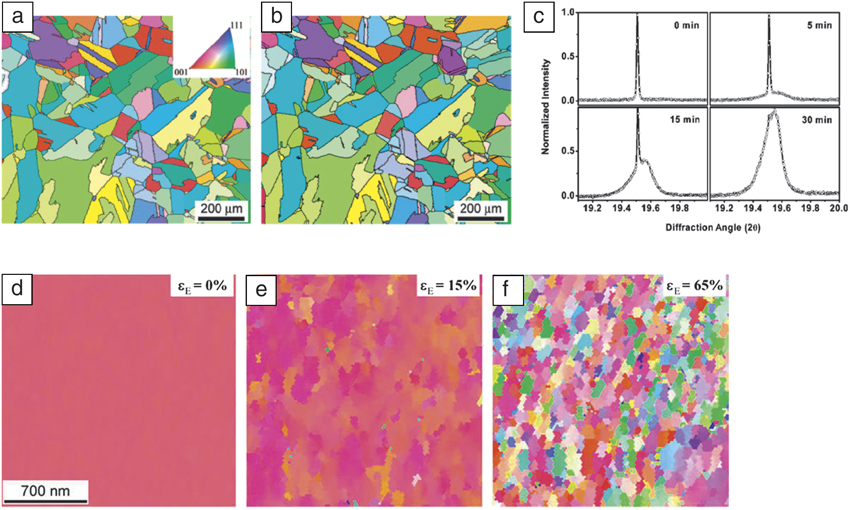
Given that the length scales of the ligament structure vary from nanometers up to a micron, whereas the parent alloys typically display a grain size of tens of microns, the RVEs of NPG are often considered single crystalline. Several groups have investigated the local misorientations induced in NPG via dealloying,Reference Petegem, Brandstetter, Maass, Hodge, El-Dasher, Biener and van Swygenhoven9 annealing,Reference Sun, Burger and Balk37 or plastic deformation.Reference Jin, Kurmanaeva, Schmauch, Rösner, Ivanisenko and Weissmüller10 While measurements of misorientations due to residual dislocations and elastic strains may be difficult to achieve with EBSD due to the lack of sufficient angular resolution, high-resolution XRD measurements have revealed small misorientations during dealloying,Reference Petegem, Brandstetter, Maass, Hodge, El-Dasher, Biener and van Swygenhoven9 as shown in Figure 3c. At significant plastic strains mosaic-like structures result while preserving the initial grain structure,Reference Jin, Kurmanaeva, Schmauch, Rösner, Ivanisenko and Weissmüller10 shown in Figure 3d–f, but annealing of thin-film NPG structures has led to significant reorientations, resulting in new grain boundaries.Reference Sun, Burger and Balk37 Clearly, consensus on the evolution of local crystallographic orientations in nanoporous metals is yet to be achieved.
(a–b) Electron backscatter diffraction (EBSD) inverse pole figure maps (1100 × 900 µm2, step size 2.5 µm) showing the grain structure and orientation (a) before and (b) after dealloying. (c) (311) diffraction peak as a function of dealloying time. The maximum intensity is normalized to 1. (d–f) EBSD inverse pole figure maps of a magnified region within a grain of the parent alloy of a similar NPG sample (d) prior to deformation, (e) at 15% compressive strain (ε), and (f) at 65% compressive strain, showing the development of a deformation-induced mosaic structure. (a–c) Reprinted with permission from Reference Petegem, Brandstetter, Maass, Hodge, El-Dasher, Biener and van SwygenhovenReference 9. © 2009 American Chemical Society. (d–e) Reprinted with permission from Reference Jin, Kurmanaeva, Schmauch, Rösner, Ivanisenko and WeissmüllerReference 10. © 2009 Elsevier.

Self-similarity? Limitations and consensus
An interesting aspect of nanoporous metals is their ability to coarsen while maintaining their bicontinuous structure. The consensus is that coarsening occurs via surface diffusion. A more contentious debate, however, is whether the coarsening is self-similar, the implications of which will be discussed later. A structure is self-similar when the evolution of the morphology and topology can be made time-independent under the scaling of a time-dependent quantity, such as the inverse of the surface area per volume,  $S_v^{ - 1}$, or the average ligament diameter, 〈D〉lig. During coarsening, both quantities are monotonically increasing functions of time. It is possible to show that for a system of coarsening spherical particles in the limit, t → ∞, where t is time, any reasonable initial particle-size distribution will assume a unique time-independent form when the particle sizes are scaled by the time-dependent average particle size.Reference Lifshitz and Slyozov38 In this self-similar limit, the average particle size is given by a temporal power law.
Experiments have shown that the time required to reach the self-similar regime can be considerable, in some cases, requiring more than a factor of five change in the length scale of the system.Reference Alkemper, Snyder, Akaiwa and Voorhees39,Reference Snyder, Alkemper and Voorhees40 Simulations indicate that the average particle size can actually decrease in the transient regime and require greater than a factor of ten change in the average particle size to reach self-similarity when starting with a distribution that is quite different from the self-similar form.Reference Chen and Voorhees41 Nanoporous metals can be created via dealloying using a variety of temperatures, compositions, and electrochemical conditions. This leads to a variety of possible structures, most of which are unlikely to be immediately formed in the self-similar regime. This makes it challenging to compare results from different experiments simply by scaling results by a time-dependent length, since it is first necessary to determine that the self-similar regime has been attained.
In terms of the ISD, the self-similar regime is reached when the probability of finding a patch of interface of a given value of κ1,κ2, can be written as  $P\left( {{\kappa _1},{\kappa _2},t} \right) = A(t)P({\tilde{\kappa }_1},{\tilde{\kappa }_2})$, where A(t) = kt n, k is a constant,
 ${\tilde{\kappa }_i} = {\kappa _i}B(t)$, with B(t) being a time-dependent length such as
 $S_v^{ - 1}$ or 〈D〉lig; these length scales increase as a temporal power law in the self-similar regime. However, as we discussed for identifying the RVE of a structure, a rigorous classification of self-similarity is difficult; it is possible for the system to not be self-similar, but still display well-defined temporal power laws for the characteristic length scale of the system.Reference Kammer and Voorhees29,Reference Marsh and Glicksman42,Reference Mendoza, Alkemper and Voorhees43
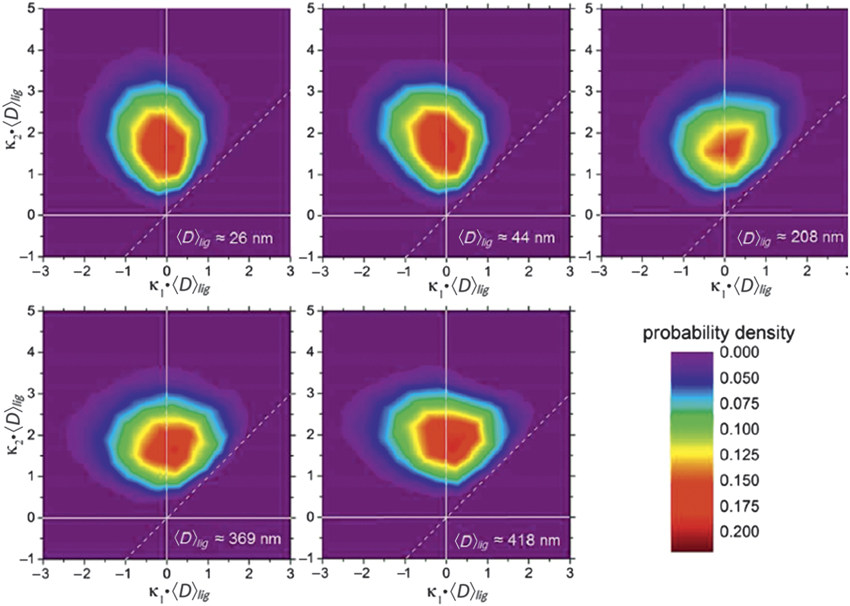
Various groups have assessed the self-similarity of NPG with ISDs. Early work by Y. Chen using x-ray nanotomography found a lack of self-similarity,Reference Chen-Wiegart, Wang, Chu, Liu, McNulty, Voorhees and Dunand13 but the small volumes of material evaluated in this study limit the validity of such a conclusion. More recent work shows that NPG is nearly self-similar,Reference Hu, Ziehmer, Wang and Lilleodden16,Reference Ziehmer, Hu, Wang and Lilleodden28 as demonstrated by the 3D reconstructions for the as-dealloyed and coarsened structures shown in Figure 1, and the evolution of principal curvatures shown in Figure 4. The hallmark of these experiments is the large sample size and the significant change in length scale—greater than a factor of 10—achieved during coarsening. The sample used in the study had a volume fraction of gold of approximately 30%, as compared to the ISD shown in Figure 2 for 50% volume fraction gold. The location of the peak implies that most of the interfacial area of the sample has cylindrical shapes and that there is a considerable surface area with patches that have a nearly spherical shape. These patches are often the consequence of pinching events, where an hourglass-shaped gold ligament splits and yields two spherical caps. The ISDs shown in Figure 4 are qualitatively similar to those shown by others,Reference Mangipudi, Epler and Volkert26,Reference Erlebacher and McCue27 also using similar gold volume fraction samples.
Interfacial shape distributions for a NPG sample undergoing coarsening at 300°C. The 2D probability density contour plots of the scaled (κ1, κ2) distribution core regions of five samples show some evolution from the very early to the later stages, but are otherwise almost symmetrical around κ1 = 0. Here, the curvatures are scaled by the cube of the mean diameter. The 〈D〉lig = 208 nm sample appears to be an outlier.Reference Ziehmer, Hu, Wang and Lilleodden28

The morphology of NPG is different from that of other bicontinuous structures. By comparing the ISD formed during coarsening by bulk diffusion following spinodal decomposition,Reference Kwon, Thornton and Voorhees44 with approximately the same volume fraction of gold, the 30% gold NPG structure shows much more interfacial area in the region κ1 > 0, κ2 > 0 than the spinodal structure displaying many more saddle-shaped surfaces, where κ1 > 0, κ2 > 0. The reason for this discrepancy is an active area of investigation.Reference Andrews and Thornton45
Nevertheless, a careful examination of the ISDs in Figure 4 show that they are not completely time-independent, and thus NPG is not rigorously self-similar. The shape of the ISDs shows broadening of κ1 and sharpening of κ2. A physical interpretation of these curvatures can be made, correlating their inverse values to structural length scales of the NPG network. The radius of curvature, R 1 = 1/ κ1 correlates extremely well to the average ligament radius, while the larger radius of curvature R 2 = 1/ κ2 might quantify the radii of interconnected tori serving as the functional structure of the network structure.Reference Ziehmer, Hu, Wang and Lilleodden28 Such a skeleton can be readily identified from skeletonizing the 3D tomograph.Reference Hu, Ziehmer, Wang and Lilleodden16
Self-similarity of bicontinuous structures can alternatively be assessed via the genus (or connectivity). Since the magnitude of the genus is a function of the sample size, it is necessary to normalize its value by the volume of the region considered, g v. During coarsening, the size scale of the system increases and thus the genus decays with time through topological singularities.Reference Erlebacher and McCue27,Reference Mendoza, Thornton, Savin and Voorhees46 In the self-similar regime, the decreasing genus can be made time independent by scaling with the cube of a characteristic length  ${\tilde{g}_v} = {g_v}S_v^{ - 3}$ or in terms of connectivity and ligament diameter:
 ${\tilde{C}_v} = {C_v}D_{lig}^3$. The scaled genus of the bicontinuous structure found following volume diffusion or interfacial mobility-limited coarsening in the self-similar limit has nearly the same values of
 ${\tilde{g}_v} \approx 0.14$. Experimentally,
 ${\tilde{C}_v}$ was found to be approximately 0.11.Reference Hu, Ziehmer, Wang and Lilleodden16 The importance of the characteristic length scale for the normalization, and the associated challenges with experimentally determining them, is still under debate. Furthermore, the relationship between the shape of the ISD, the diffusion path responsible for the evolution of the structure, and the value of the scaled genus during coarsening remains an active area of research.
Implications for functionality: Function follows form
The implications of the structure and possible self-similarity on the functionality of NPG are far reaching; function indeed follows form. The technological interest in nanoporous metals exploits various properties of this unique structure, specifically electrochemical-driven actuation and sensing properties,Reference Weissmüller and Sieradzki2,Reference Şeker, Shih and Stine47 biocompatibility-driven functions,Reference Şeker, Shih and Stine47 and the mechanical response.Reference Jin, Weissmüller and Farkas3 While the surface-area-to-volume ratio strongly governs the catalysis and actuation functions, the role of topological characteristics is perhaps easiest to demonstrate in relation to mechanical response.
The mechanics of porous structures are often discussed in terms of the Gibson–Ashby scaling laws, where the relative density of the solid phase is the sole microstructural parameter given by the aspect ratio of the ligaments (ρ):ρ ∼ (D/L)2, where D and L are the ligament diameter and length, respectively.Reference Gibson and Ashby48 Liu and Antoniou modified the Gibson–Ashby model to account for mass accumulation at the junctions between ligaments typically found in nanoporous metals.Reference Liu and Antoniou49 However, the applicability of any scaling law requires that the structure be self-similar. While this seems to be the case for NPG,Reference Hu, Ziehmer, Wang and Lilleodden16 a generalization for nanoporous metals cannot be made. Additionally, internal microstructure and finite size effects are known to strongly influence mechanical behavior. Hodge and co-workers introduced the ligament diameter explicitly into the Gibson–Ashby model of strength in order to capture the widely observed “smaller is stronger” size effect.Reference Hodge, Biener, Hayes, Bythrow, Volkert and Hamza50
More recently, the influence of the specific surface area and the scaled connectivity on mechanical behavior has been considered. Due to the known surface stress of gold, it is possible that the specific surface area, a strongly non-self-similar characteristic dependent on the detailed morphology and topology of the nanoporous metal of interest,Reference Detsi, De Jong, Zinchenko, Vuković, Vuković, Punzhin, Loos, ten Brinke, De Raedt, Onck and De Hosson51 could influence the elastic modulus of NPG. Such influences from surface stress have been found to be negligible for ligament diameters greater than 10 nm.Reference Elsner, Müller, Bargmann and Weissmüller52 In the case of network connectivity, however, several models have emerged, which propose that the scaled connectivity rather than the relative density should control the structural stiffness.Reference Hu, Ziehmer, Wang and Lilleodden16,Reference Mameka, Wang, Markmann, Lilleodden and Weissmüller53,Reference Liu, Ye and Jin54 Jin et al. Reference Liu, Ye and Jin54 argue that a loss of network connectivity with coarsening might explain the anomalous low strength and high compliance of coarsened structures at the macroscale. Yet, this is inconsistent with the observations of Hu et al.Reference Hu, Ziehmer, Wang and Lilleodden16 that the scaled network connectivity is sufficiently self-similar with coarsening.
The large spread in reported values for measured elastic modulus of NPG must point to either the variety in the structure of samples from many groups using a range of dealloying and coarsening procedures, or in the measurements, analyses, and assumptions made in characterizing the structure and structure–property relations. Structure dictates properties, but the ability to identify the critical structural parameters for a given property and then to accurately quantify those parameters is nontrivial. This is underscored by the lack of correlations between topological or morphological characteristics identified so far for the prediction of failure; in order to consider failure, a more accurate prediction of the stress distribution is needed. Here, the extreme values—rather than simply mean values—of structural geometry parameters become critical.
Conclusion
In closing, a general understanding of structural parameters drives our understanding of structural evolution, and in turn, allows the possibility to optimize materials for a broad spectrum of applications. In order to understand the relations between both morphological and topological parameters and mechanical response of nanoporous metals—materials with high porosity and intrinsic ductility—one must not only quantify the structure prior to deformation, but also to understand the evolution of structural parameters such as the effective density, network connectivity, and local misorientations during deformation. Finally, simply defining which structural parameters are salient to the function of interest is clearly a challenge for the case of nanoporous gold; the quantification of the critical microstructural and topological parameters for nanoporous metals more generally remains a wide and challenging area of research.
Acknowledgments
E.T.L. gratefully acknowledges financial support from the German Research Foundation (DFG) through the SFB 986 “Tailor-Made Multi-Scale Materials Systems-M3” Projects B4 and B8. P.W.V. gratefully acknowledges financial support from the US Department of Energy, Office of Science, Basic Energy Sciences, under Award DE-FG02-99ER45782-0019.

Erica T. Lilleodden heads the Department for Experimental Mechanics in the Institute for Materials Research, Materials Mechanics Division, at Helmholtz-Zentrum Geesthacht, Germany. She is also a professor in the Institute for Advanced Ceramics at the Hamburg University of Technology, Germany. She received her PhD degree in materials science and engineering from Stanford University in 2002. She was a postdoctoral fellow at Lawrence Berkeley Laboratory, and a Humboldt Fellow at Forschungszentrum Karlsruhe (now Karlsruhe Institute of Technology), Germany. Her current research focuses on the mechanisms of deformation and failure in structural materials, with a particular interest in the effects of microstructural and geometric length scales. Lilleodden can be reached by email at erica.lilleodden@hzg.de.

Peter W. Voorhees is the Frank C. Engelhart Professor of Materials Science and Engineering and also a professor of engineering sciences and applied mathematics at Northwestern University. He is co-director of the Northwestern–Argonne Institute of Science and Engineering and is co-director of the Center for Hierarchical Materials Design. He received his PhD degree in materials engineering from Rensselaer Polytechnic Institute. He has published more than 240 papers in the area of the thermodynamics and kinetics of phase transformations. Voorhees can be reached by email at p-voorhees@northwestern.edu.