I. INTRODUCTION
In the approximately 20 years since the concepts of strong localization and the photonic band gap were developed, a great deal of research has gone into the practical problem of achieving the desired structure and sufficiently large variation in the refractive index.Reference John1–Reference von Freymann, Ledermann, Thiel, Staude, Essig, Busch and Wegener8 In the visible to near infrared range, much of the fabrication effort has focused on either lithography from a solid substrate or self-assembly of colloidal particles. The latter potentially offers advantages of low cost and scalability and might lead to three-dimensional structures, either crystalline or random, that are not readily achieved by lithography. A major challenge of the self-assembly route, however, is achieving a large refractive index n since the materials that are amenable to handling in suspension often have low intrinsic refractive index or are porous. Constructing a material with a full photonic band gap requires n > 2 (if the diamond lattice can be achieved)Reference Ho, Chan and Soukoulis9 or n > 2.6 (for the more readily formed face-centered cubic lattice).Reference Biswas, Sigalas, Subramania and Ho10, Reference Busch and John11 Large n has been achieved by infiltration of a preassembled colloidal crystal by chemical precursors to form TiO2,Reference Imhof and Pine12 carbon,Reference Zakhidov, Baughman, Iqbal, Cui, Khayrullin, Dantas, Marti and Ralchenko13 silicon,Reference Blanco, Chomski, Grabtchak, Ibisate, John, Leonard, Lopez, Meseguer, Miguez, Mondia, Ozin, Toader and van Driel14 or SnS2.Reference Muller, Zentel, Maka, Romanov and Torres15 To form ordered structures or for application as tracers or pigments in paints, it is desirable to have controlled morphology and a narrow distribution of sizes. Moreover, particles with a core–shell morphology are also promising because they can be assembled in close-packed lattices that provide an optimal volume fraction of high-n material (on the order of 25 vol%).Reference Zhang, Sheng and Sheng16–Reference Busch and Soukoulis18 To date, uniform core–shell particles with a narrow distribution of sizes have been made with ZnS core and low-n silica shell,Reference Velikov and van Blaaderen19 or with a polymeric or silica core and a high-n shell of ZnS,Reference Breen, Dinsmore, Pink, Qadri and Ratna20–Reference Sossng, Yang, Wang and Hu26 ZnSe,Reference Peng, Dong and Li27 ZnO,Reference Agrawal, Gupta and Stamm28 anatase TiO2,Reference Agrawal, Pich, Zafeiropoulos and Stamm29 or amorphous TiO2.Reference Suh, Jang, Suh and Suslick30 The effective refractive index of the high-n material is typically inferred rather than measured, and its value is typically lower than the intrinsic material because of porosity. It is therefore important to include in the materials analysis a measurement of the optical properties of the individual particles.
Here, we describe sonochemical synthesis and characterization of colloidal spheres having a polystyrene (PS) core and a uniform and high-n shell of tin sulfide. Tin sulfide has a very large refractive index and is transparent in the near infrared, either in the form of SnS2 (n ≈ 3.0 for λ ∼ 1 μm)Reference Muller, Zentel, Maka, Romanov and Torres15, Reference Domingo, Itoga and Kannewur31–Reference Deopura, Ullal, Temelkuran and Fink33 or SnS (n ≥ 4.1 for λ ∼ 1 μm).Reference Lambros, Geraleas and Economou34 These compounds have substantially higher refractive index than ZnS, ZnSe, ZnO, and TiO2 (which have n = 2.6 or less) and are therefore attractive for the applications described above. Synthesis by sonochemistry is a very flexible technique that has been reviewed extensively.Reference Bang and Suslick35 For example, this method was used previously to form PS–ZnS core–shell spheres where the shell had n approximately 2.Reference Breen, Dinsmore, Pink, Qadri and Ratna20
We report angle-dependent light scattering data showing that the real part of the refractive index of the tin sulfide shell is n = 3.0 at wave length λ = 1064 nm. The imaginary part, arising from optical absorption, is 0.6. The core–shell spheres have a narrow distribution of sizes and are stable in suspension. The thickness of the tin sulfide shell can be varied between approximately 30 and 60 nm, though the shell morphology becomes irregular for thicker layers. The combination of colloidal stability and uniformity with low-n core and high-n shell makes these promising materials as tracer particles in scattering experiments or for future studies of strong localization of light and photonic band gaps.
II. EXPERIMENTAL METHODS
A. Sonochemical synthesis
The tin sulfide precipitation was carried out in aqueous solution with the colloidal spheres. Tin (II) chloride (98% or more purity) and thioacetamide (TAA, 99% or more purity) were purchased (Aldrich, Milwaukee, WI) and used without further purification. We began by mixing SnCl2 and 50 mL of filtered water (Milli-Q; Millipore Corp., Billerica, MA) in a 50-mL round bottom flask. The solution was agitated in a sonic bath for 30 s or until all the metal salt dissolved. We then added 1 mL of 5 wt% carboxylate-modified PS (PS-CO2) microspheres. The microspheres were used as received from Seradyn Inc. (Indianapolis, IN) or Interfacial Dynamics Corporation (Eugene, OR). Proprietary surfactant that might be in solution with the microspheres was found not to interfere with deposition. TAA was then added. Various concentrations of SnCl2 and TAA were used but always with a 2:1 molar ratio with typical amounts being 310 mg or (0.033 M) of SnCl2 and 246 mg (0.066 M) of TAA.
A 750-W 20-kHz ultrasonic processor (model #9810-24; Ace Glass, Vineland, NJ) was used to initiate the reaction. Ultrasonic irradiation was delivered by a 0.25-inch diameter titanium, tapered microtip probe. The sonic probe was immersed in the reaction solution, and the power was pulsed (0.5/0.5 s on/off) for up to 6 h at 20% of the total power (i.e., 150 W). To monitor film growth over time, aliquots of the reaction solution (0.50 mL each) were collected prior to sonication and then subsequently at intervals of approximately 40 min. The final product was washed several times with Milli-Q-filtered water.
B. Scanning and transmission electron microscopy
Particles were dried onto a transmission electron microscopy (TEM) grid for visualization of the core–shell morphology (JEOL 100CX, 100 kV, Tokyo, Japan). To visualize the surface morphology, the tin sulfide core–shell particles were also imaged with a scanning electron microscope after coating with a thin layer of gold (JEOL JSM-6400).
C. X-ray diffraction
The tin sulfide core–shell particles were dried onto a silicon wafer for x-ray diffraction (XRD). We used a Rigaku diffractometer (Tokyo, Japan) with Cu Kα x-rays having a wave length of 1.54 Å.
D. Light scattering
We used static light scattering (wave length: 1064 nm) from a dilute suspension to measure the refractive index of the tin sulfide shell. For the light scattering measurements, particles were suspended in cyclohexane (n ∼ 1.425) to reduce the total scattering and thereby suppress multiple scattering of light. To prevent the tin sulfide-coated spheres from aggregating in the cyclohexane, we added the surfactant dioctyl sulfosuccinate sodium salt (AOT, 99%; Aldrich, Milwaukee WI) to achieve a concentration of 0.5–1%.
A dilute suspension was placed in a small glass vial, which was itself placed in a larger glass vial filled with cyclohexane. The refractive index of cyclohexane matches that of the glass reasonably well, which minimizes reflections. Stray scattered light (e.g., from glass/air interface) was carefully blocked with beam absorbers and apertures. The glass vials were placed at the center of a goniometer. Laser radiation with wave length λ of 1064 nm was used to illuminate the sample solution. The scattered intensity from the sample was collected with a silicon photodiode (Thorlabs, Inc., Newton, NJ), which was scanned across a range of angles, approximately from 10° to 130°. The goniometer and the photodiode signal acquisition were controlled using LabVIEW (National Instruments, Austin, TX).
The suspension was sufficiently dilute to avoid multiple scattering of light and to avoid structural correlations of the scattering spheres. The intensity from a cell filled only with cyclohexane was subtracted from the data. The result is proportional to the differential cross section dσ/dθ of isolated spheres in the solvent. As described below, we used Mie scattering theory to fit to the measured cross section and obtain the dimensions and refractive indices of the particles.
III. RESULTS AND DISCUSSION
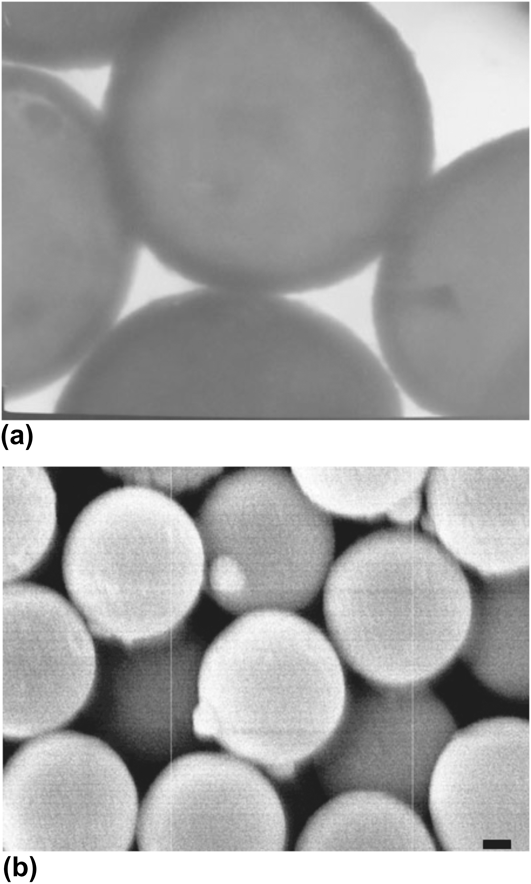
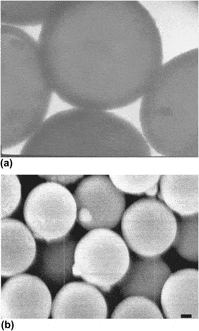
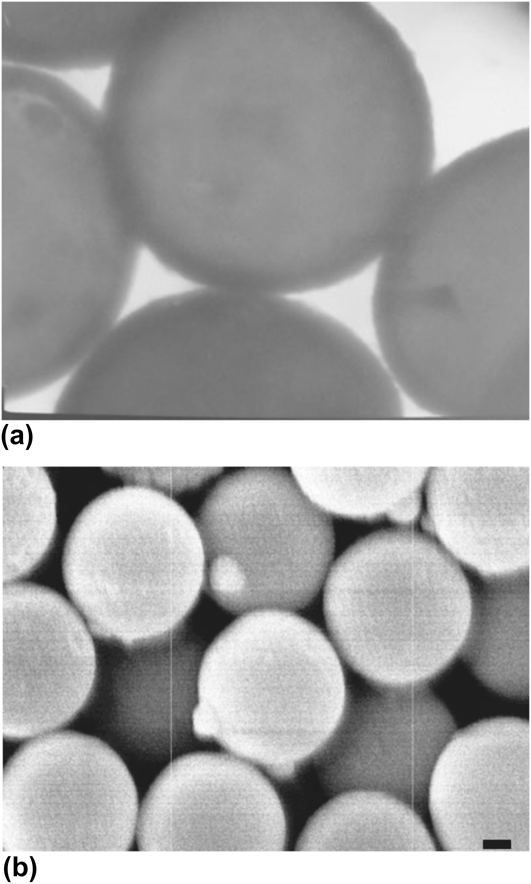
Electron microscopy images (Fig. 1) show a smooth tin sulfide shell with thickness ranging from 30 to 60 nm. Figure 1(a) shows a TEM image of 0.97-μm diameter PS spheres formed in a reaction with 0.033 M SnCl2, 0.066 M TAA, and reaction time of 3 h. The higher atomic number of tin leads to the contrast in the image and shows that the tin sulfide forms a shell at the surface. Images of the PS spheres prior to the reaction show only the gray interior regions with no dark shell (images not shown). Figure 1(b) shows a scanning electron microscope image of spheres coated with the same reaction conditions but after 90 min of reaction time. Both scanning electron microscopy (SEM) and TEM show smooth spherical particles.
Electron microscope images of of tin-sulfide-coated PS spheres. (a) TEM image, where the tin sulfide appears as a dark ring around the PS. The PS core diameter is 0.97 μm. (b) SEM image; scale bar represents 0.2 μm.
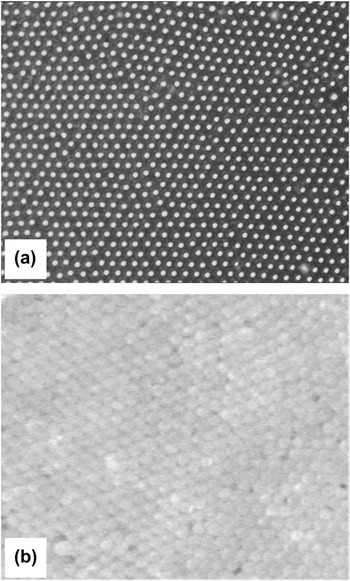
The particles have a sufficiently narrow distribution of sizes so that they can form ordered structures, as shown in Fig. 2. These structures were formed in aqueous suspension in the presence of an AC electric field (40 kHz, 10 V across approximately 0.8 cm), following the method reported by Lumsdon et al.Reference Lumsdon, Kaler and Velev36 We also formed crystallites by placing a substrate vertically into a particle suspension and allowing the solvent to dry, thereby sweeping the meniscus across the substrate (similar to Dimitrov and NagayamaReference Dimitrov and Nagayama37). We found, however, that the particles settled out of suspension too quickly for this method to work effectively. With the AC field, single-layer [Fig. 2(a)] and multilayer [Fig. 2(b)] structures were formed. In the multilayer structures, only the surface layer was visible owing to the strong scattering of light by the high-n shell.
(a) Optical image of a layer of tin-sulfide-coated PS spheres assembled on the surface of a glass coverslip. (b) Optical image of a multilayer polycrystalline structure. The particle diameter is approximately 1 μm.

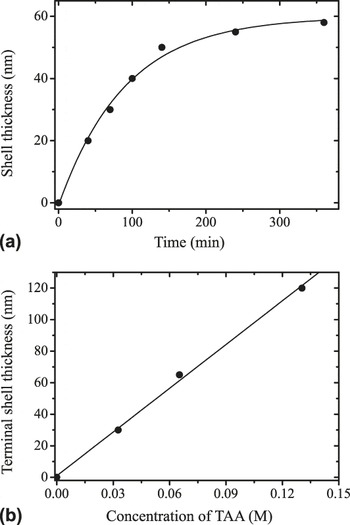
Figure 3(a) shows the thickness of the tin sulfide shell as a function of the duration of the sonication reaction. The reaction conditions were the same as for the particles of Fig. 1 (0.033 M SnCl2 and 0.066 M TAA, and 0.97-μm diameter PS spheres). The thickness was measured from TEM images. The data are in close agreement with an exponential growth curve having a characteristic (1/e) time of 90 min. After 3 h, the growth had effectively stopped at a terminal shell thickness of 60 nm. The terminal thickness depends linearly on the concentration of TAA and SnCl2, as shown in Fig. 3(b). In these experiments, the initial molar ratio of SnCl2:TAA was held at 2:1, but the total initial concentration was varied. The data agree well with a linear fit with slope of 870 nm per molar of TAA. The surface becomes rougher, however, when the shell thickness exceeds approximately 60 nm and some images showed small bumps of tin sulfide clusters on top of the shell. These clusters were rarely found in the formation of ZnS shells on PS spheres by a similar technique,Reference Breen, Dinsmore, Pink, Qadri and Ratna20 which we repeated in our lab for comparison. We speculate that the small clusters formed here because the SnCl2 only partially dissolved in solution and might therefore have created nucleation centers for the small clusters. By contrast, the zinc precursor (Zn(Ac)2) completely dissolved in solution, and the nucleation might have been restricted to the particles’ surfaces.
Thickness of the tin sulfide shell, as measured by TEM. (a) Thickness versus time for 0.033 M SnCl2, 0.066 M TAA, and 0.97-μm diameter PS spheres. The curve shows a fit to an exponential growth. (b) The terminal (long-time) thickness as a function of concentration of TAA, showing a linear dependence.

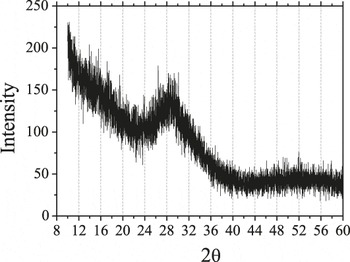
The XRD spectrum, shown in Fig. 4, provides some insight into the structure and composition of the shell. This sample was made under the same conditions as those of Fig. 1(b) (reaction time of 90 min). The spectrum shows a pronounced peak at approximately 29° and perhaps a weak secondary peak near 52°, both of which we attribute to the tin sulfide shell. The main peak was substantially broadened by the small size of the crystallites. We extract the average crystallite size (t) from the full width at half maximum (Δ) of the diffraction peak using Scherrer’s formula:  .Reference Cullity38 Here, K is the Scherrer constant, whose value falls in the range 0.87–1.0 (we assume the value of 0.9 as is commonly done); λ is the x-ray wave length (1.54 Å); θp is the peak position. This analysis yields an estimated average crystallite size of 2.1 nm. This small particulate size is consistent with the smooth appearance seen in SEM and TEM.
The measured XRD intensity as a function of scattering angle for the core–shell spheres.

To identify the material of the shell, we compare our spectrum to previously reported XRD patterns from hexagonal SnS2 and two different symmetries of SnS (orthorhombic and zincblende).Reference Chen, Shen, Tang, Lei, Zheng and Qian39, Reference Sanchez-Juarez, Tiburcio-Silver and Ortiz40 Chen et al. used a microwave-assisted process starting with thiourea and tin chloride precursors in ethylene glycol, with SnCl2 leading to orthorhombic SnS and SnCl4 leading to hexagonal SnS2. The large width of the main peak in our results (arising from the small domain size) makes an exact determination of the structure difficult. Nonetheless, the position of the main peak corresponds fairly closely to the strongest (100) peak of hexagonal SnS2, with perhaps some contribution from the weaker and broader (101) peak. It seems surprising, however, that using SnCl2 as a precursor would lead to SnS2 rather than SnS (which is in contrast to the results of the previous microwave-assisted processReference Chen, Shen, Tang, Lei, Zheng and Qian39). An alternative explanation is that the shell material is the zincblende structure of SnS, as reported previously from thermal decomposition of SnCl2 and elemental S.Reference Greyson, Barton and Odom41 The predominant (111) and (200) peaks of this zincblende structure appear at angles of approximately 26° and 31°,Reference Greyson, Barton and Odom41, Reference Gao, Shen, Sun and Shen42 close to the angle where we find our major peak. As we discuss below, the optical measurements of the refractive index are more consistent with the SnS structure.
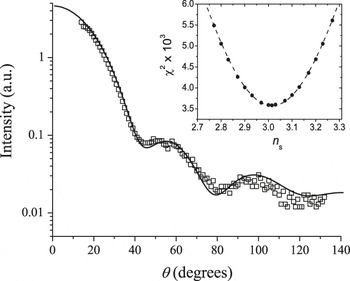
The light scattering data for the tin sulfide core–shell spheres suspended in cyclohexane are shown in Fig. 5. Multiple measurements were made using multiple samples, and consistent results were obtained. In brief, our method of analysis is to perform a fit of the measured scattering intensity versus angle to calculated differential cross section of the core–shell particles, dσ/dθ. Since dσ/dθ is a nontrivial function of sizes and refractive indices, we used the simplex fitting method with an algorithm known as amoeba,Reference Nelder and Mead43 which was implemented in the Interactive Data Language (IDL, ITT Visual Information Solutions, Boulder, CO). The values of dσ/dθ were computed using the numerical routine known as “bhcoat,” written in FORTRAN by Bohren and Huffman,Reference Bohren and Huffman44 which we implemented in IDL. To carry out the fit, we used eight adjustable parameters, of which five can be compared to known values to help assess the quality of the fit. Five of the fit parameters are the refractive indices of the solvent (n 0), of the core (n c), and of the shell (n s). The latter two are complex numbers, reflecting the presence of absorption; they, therefore, each contain both real and imaginary parts. The core radius (R c), shell radius (R s), and an arbitrary overall coefficient (related to concentration and detection efficiency) are the remaining fit parameters. The best fit was obtained with n s = 3.015 + 0.638i. We also obtained n 0 = 1.427, which compares well to the value of 1.425 measured using a visible light refractometer. For the PS core, we found n c = 1.52 + 0.168i. Previous measurements at this wave length (1064 nm) yielded a refractive index of PS equal to 1.575 + 0.001i Reference Ma, Lu, Brock, Jacobs, Yang and Hu45; the small difference might be due to penetration of solvent or reactant into our PS spheres. We further found R c = 500.1 nm and a shell thickness of 34.4 nm, both of which agree with our electron microscopy measurements within error. Since we know that the PS spheres have a polydispersity of radius, we then computed the average dσ/dθ for an approximately Gaussian distribution of R c values with a standard deviation of 1% (which is the manufacturer’s reported size polydispersity for the starting latex suspension). The result of this calculation agrees quite well with the experimental data, as shown in the plot of Fig. 5. We regard the agreement is satisfactory though still not perfect. The remaining differences might arise from a gradient in refractive index near the PS–tin sulfide boundary, and some roughness and/or polydispersity of the shell thickness. We note, however, that increasing or decreasing the refractive index of the shell leads to an inferior agreement of data and fitted curve. The inset of Fig. 5 shows the values of χ2 obtained from the fit when we held n 0, the real part of n c, R c, and R s constant, chose values of the real part of n s and allowed the algorithm to optimize values of the other fitting parameters. The value of χ2 has a clear minimum when the real part of n s = 3.0.
Plot of the measured intensity as a function of scattering angle, θ. The solid curve shows the results of the best fit with an added 1% variation of core size as described in the text. Inset: The values of χ2 from the fit, rescaled by 103.

Previous measurements of the index of refraction of polycrystalline SnS2 showed n ≈ 2.92 at a wave length of 1 μm.Reference Domingo, Itoga and Kannewur31 For SnS, the reported index is n > 4 at λ = 1 μm.Reference Lambros, Geraleas and Economou34 Our data are thus more consistent with a dense packing of SnS crystallites, which would be expected to yield an index somewhat below 4. Our measured value of the imaginary part of the refractive index is also more consistent with SnS, which has band gap absorption near λ = 1 μm. By contrast, SnS2 has an absorption edge in the green or blue part of the visible spectrum and should therefore have lower absorption at 1.064 μm.Reference Domingo, Itoga and Kannewur31, Reference Mandalidis, Kalomiros, Kambas and Anagnostopoulos32 Hence, our XRD and light scattering results are consistent with formation of SnS. The optical absorbance of this material can reasonably be expected to be less at longer wave lengths (e.g., 1.5 μm). Absorbance may be beneficial or harmful in photonic applications and further investigation of this point is needed; toward this end, the present method for measuring the complex n may be useful. For cases where absorbance should be low, however, we note that it could perhaps be further reduced by thermal processing under controlled atmosphere to remove remaining reactants.
IV. CONCLUSION
In summary, we have presented a straightforward method to prepare colloidal microspheres with a polymeric core and a shell of tin sulfide, most likely SnS. The particles have a narrow distribution of sizes and are stable in suspension, hence able to form ordered arrays. We measured the refractive index of the shell and found a real part equal to 3.0 and an imaginary part equal to 0.6. To our knowledge, this represents the highest value of refractive index yet attained for smooth colloidal spheres, and it may be sufficient to create a complete band gap in the near infrared with a face-centered cubic packing of spheres. Our experiments were done with core particles of PS with diameters of 0.5–1.0 μm, but we see no reason why the method cannot be extended to much smaller particles. In addition to their potential application in photonic crystals, these materials might also be useful where strongly scattering particles are needed as tracers, or for microsphere-based optical resonators.
ACKNOWLEDGMENT
We gratefully acknowledge funding by the NSF-supported Materials Research Science and Engineering Center on Polymers at UMass (DME-0213695). ADD is a Cottrell Scholar of the Research Corporation.