Contaminated environmental surfaces can potentially contribute to cross transmission of pathogens.Reference Weber, Rutala, Miller, Huslage and Sickbert-Bennett 1 , Reference Hayden, Bonten, Blom, Lyle, Vijver and Weinstein 2 The improvement of environmental cleaning within hospital settings has been shown to decrease the number of pathogens in the hospital environment.Reference Munoz-Price, Birnbach and Lubarsky 3 – Reference Datta, Piatt and Yokoe 5 Several objective methods are used to evaluate the quality of cleaning, including aerobic colony counts (ACC), the adenosine triphosphate bioluminescence assay (ATP), and the fluorescent marker method.Reference Carling and Huang 6 – Reference Rutala and Weber 8 The ATP method detects the bacterial load and other residual bioburden,Reference Sherlock, O’Connell, Creamer and Humphreys 9 , Reference Moore, Smyth, Singleton and Wilson 10 whereas the ACC method measures the actual bacterial load. However, methods of measuring residual bioburden are costly or are too time-consuming to be used frequently. The fluorescent marker method does not measure the actual cleanliness of surfaces, it indicates the physical removal of an applied substance through visualization of the residual substance after cleaning using ultraviolet (UV) light.Reference Carling, Parry and Von Beheren 11 The fluorescent marker method has been used in numerous hospitals, and audit and feedback with this method can improve terminal cleaning on hospital wards.Reference Carling, Parry and Rupp 12 – Reference Gillespie, Wright and Snook 15 However, few data are available regarding the interpretation of the residual level of fluorescent gel as it indicates the cleanliness of a surfaceReference Carling, Parry and Von Beheren 11 , Reference Luick, Thompson, Loock, Vetter, Cook and Guerrero 16 , Reference Boyce, Havill, Havill, Mangione, Dumigan and Moore 17 because these determinations can be complicated and difficult. In this study, we aimed to use targeted high-touch test surfaces to compare the results of the fluorescent marker method with results obtained using the quantitative ATP bioluminescence assay and ACC methods.
Methods
This study was conducted using a prospective stratified sampling of medical wards, surgical wards, and intensive care units (ICUs) in a 2,323-bed academic medical center. Among 84 total wards, 28 (33.3%) were randomly selected. For each ward, the same 10 high-touch surfaces were sampled randomly after terminal cleaning once per month between July 2016 and September 2016. Terminal cleaning was performed with 500–600 ppm sodium hypochlorite according to the manufacturer’s instructions (6% Bleach, Yuxiang Technology, Hsinchu County, Taiwan). The housekeeping staff was blinded to the cleaning assessment in each investigation.
Sampling process
In the general ward, 10 high-touch surfaces were assessed: nursing call buttons, bed-rail controllers, attendant control panels, intravenous (IV) poles, bedside table handles, overbed tables, chairs, room light switches, room door knobs, and bathroom door knobs. In the ICUs, 10 high-touch surfaces were assessed: electrocardiogram lead machines, bed-rail controllers, attendant control panels, IV pump panels, suction controllers, vital-sign monitor panels, respiratory ventilator controllers, overbed tables, wardrobe knobs, and nursing carts. All high-touch surfaces were tested after terminal cleaning using the fluorescent marker method, the ATP assay, and the ACC method. All tests were conducted by the same well-trained infection control nurse.
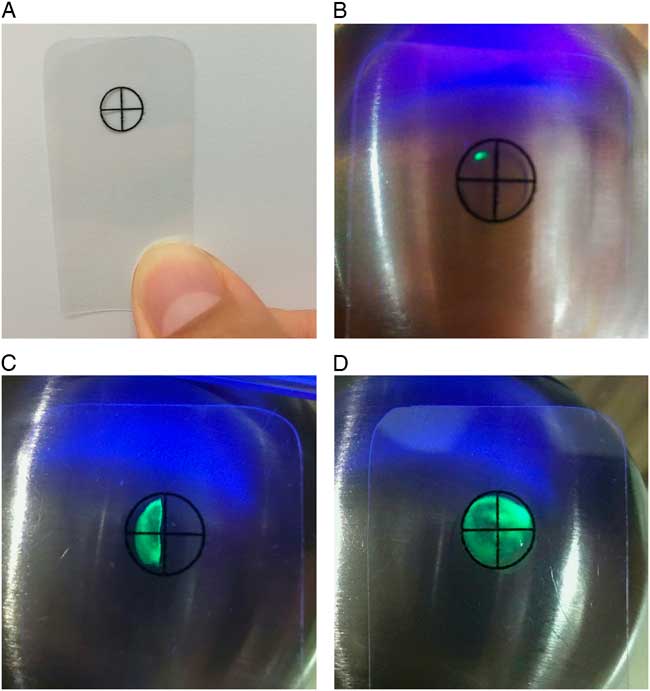
After patients were discharged, each high-touch surface was tagged with a 0.8-cm–diameter fluorescent marker (GlitterBug, Brevis, Salt Lake City, UT) prior to terminal cleaning. Allowing 10 minutes for the surfaces to dry after terminal cleaning, each high-touch surface was examined under a UV light, and a transparent plastic sheet with a circle image was used to assess the level of residual fluorescent gel (Fig. 1). Each high-touch surface with the same 100 cm2 area adjacent to the fluorescent marker was entirely swabbed using a close zigzag pattern: the area was swabbed in one direction and then swabbed in the opposite direction, and the swabs were rotated as the sample was collected. Simultaneously, a swab for the ATP assay (3M Clean-Trace System; 3M, St. Paul, MN) and a premoistened sterile culture swab for the ACC method (BBL CultureSwab; Becton Dickinson, Franklin Lakes, NJ) were applied. The ATP swab was activated in accordance with the manufacturer’s instructions, and the reading (in relative light units, RLU) was recorded. Each culture swab was suspended in 1 mL sterile saline then vortexed for 10 seconds, and 0.2 mL was spread onto a tryptic soy agar (Creative Microbiologicals, Taipei County, Taiwan). After 48 hours of incubation at 35°C, the total numbers of colonies on the agar were calculated for all samples. The benchmark cutoffs for the clean criteria for the ATP test were <250 RLU and <500 RLU,Reference Sherlock, O’Connell, Creamer and Humphreys 9 , Reference Moore, Smyth, Singleton and Wilson 10 and the cutoffs for the clean criteria for the ACC testReference Rutala and Weber 8 , Reference Sherlock, O’Connell, Creamer and Humphreys 9 were <5 colony-forming units (CFU)/100 cm2 , <100 CFU/100 cm2, and <250 CFU/100 cm2. For fluorescent marker method, the interpretation of each high-touch surface was recorded using the plastic-circle visualization tool as follows: (1) totally clean if <1 quarter circle of residual gel was visualized; (2) partially clean if between 1–3 quarter circles of residual gel were visualized; and (3) not clean if >3 quarter circles of residual gel were visualized.
Interpretation of the fluorescent marker method using a quartering technique. (A) A transparent plastic sheet with a circle image was used to assist the recording of the level of residual fluorescent gel. (B) Totally clean if <1 quarter circle of residual gel was visualized. (C) Partially clean if 1–3 quarter circles of residual gel were visualized. (D) Not clean if >3 quarter circles of residual gel were visualized.

Statistical analysis
All results were entered into an Excel database (Microsoft, Redmond, WA) and were analyzed using SAS version 9.4 software (SAS Institute, Cary, NC). The range of ATP values and ACC values were analyzed using descriptive statistics. The χ2 analysis and ANOVA test were used for comparisons of proportions or means as appropriate. Sensitivity, specificity, positive predictive value (PPV), and negative predictive value (NPV) were calculated using the ACC method as the standard. Two-sided P values <.05 were considered statistically significant.
Results
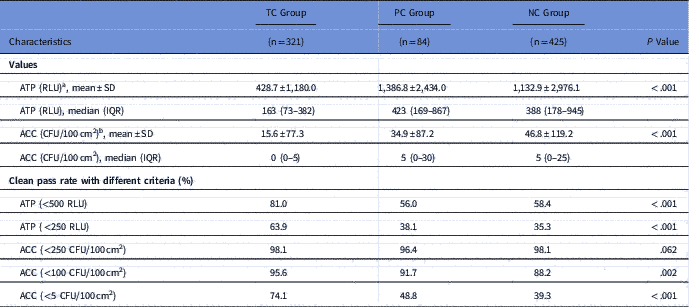
In total, 830 high-touch surfaces from 83 rooms were examined. Using the fluorescent marker method, 321 surfaces (38.7%) were assessed to be totally clean (TC group); 84 surfaces (10.1%) were partially clean (PC group); and 425 surfaces (51.2%) were not clean (NC group). The areas deemed totally clean using the fluorescent marker method (ie, the TC group) had significantly lower ATP and ACC values (mean ± SD, 428.7 ± 1180.0 RLU [ATP] and 15.6 ± 77.3 CFU/100 cm2 [ACC]) than the PC group (1,386.8 ± 2434.0 RLU [ATP] and 34.9 ± 87.2 CFU/100 cm2 [ACC]) and the NC group (1,132.9 ± 2976.1 RLU [ATP] and 46.8 ± 119.2 CFU/100 cm2 [ACC]). Overall, 75% of the surfaces deemed totally clean (TC group had <382 RLU by the ATP method and <5 CFU/100 cm2 by the ACC method. No matter what criteria were used, the TC group had significantly higher ATP and ACC clean rates than the PC and NC groups (Table 1).
Values and Clean Passing Rates (%) of the ATP and ACC Methods on 830 Surfaces According to the Fluorescent Marker Results: Totally Clean (TC Group), Partially Clean (PC Group), and Not Clean (NC Group) After Terminal Cleaning

NOTE. ATP, adenosine triphosphate bioluminescence assay; RLU, relative light units; SD, standard deviation; IQR, interquartile range; ACC, aerobic colony counts; CFU, colony forming units.
a TC group versus PC group significance at P<.003; TC group versus NC group significance at P<.001.
b TC group versus NC group significance at P<.001.
The rates of meeting or exceeding the criteria for clean (ie, passing the assessment) for the 830 high-touch surfaces were as follows for the methods tested: the fluorescent marker method (totally clean, 38.7%), ATP method (cutoff, <250 RLU, 46,.6%), and the ACC method (cutoff, <100 CFU/100 cm2, 91.4%). Compared with the ACC method, the fluorescent marker method (χ2=11.8; P<.001) and ATP method (χ2=16.1; P<.001) had significantly lower rates of passing the terminal cleaning assessment. The passing rate for the fluorescent marker method was significantly lower than that for the ATP method (χ2=64.5; P<.001). Discordant results for passing the cleaning assessment between the fluorescent marker method and the ATP method compared with the ACC method were recorded for 466 surfaces (56.1) and 406 surfaces (48.9%) of the 830 high-touch surfaces tested, respectively (Table 2). Also, 452 surfaces (54.5%) met the criteria for clean using the ACC method, but 389 surfaces (46.9%) did not meet the respective criteria for clean using the fluorescent marker and ATP methods.
Concordance and Discordance on 830 Surfaces Between the ACC, ATP, and Fluorescent Marker Methods to Determine the Effectiveness of Terminal CleaningFootnote a

NOTE. ATP, adenosine triphosphate bioluminescence assay; ACC, aerobic colony counts; RLU, relative light units; CFU, colony-forming units.
a The clean criteria of ACC method was <100 CFU/100 cm2; the clean criteria of fluorescent marker was totally clean; the clean criteria of ATP method were <250 RLU.
b Discordant clean/not clean indicates the front method characterized the surface as clean, and the back method characterized the surface as not clean.
c Discordant not clean/clean indicates the front method characterized the surface as not clean, and the back method characterized the surface as clean.
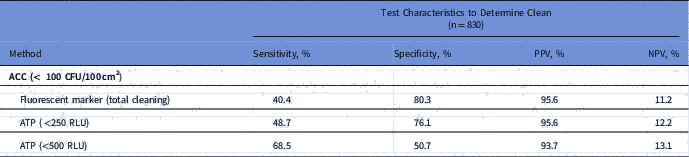
The test characteristics of the fluorescent marker and ATP methods for determining the effectiveness of terminal cleaning using the ACC method as a standard are shown in Table 3. The fluorescent marker had the lowest sensitivity (40.4%) but the highest specificity (80.3%) to detect a clean surface with low microbial contamination. Comparing 2 benchmark clean criteria of ATP test, the ATP test with a cutoff of <500 RLU had better sensitivity than the ATP test with a cutoff of <250 RLU. The sensitivity and specificity of the ATP test with a cutoff of <500 RLU were more balanced. The PPVs and NPVs of the results for the fluorescent marker method and the ATP method (2 clean criteria) were similar.
Characteristics of ACC, ATP, and Fluorescent Marker Methods for Determining the Effectiveness of Terminal Cleaning

NOTE. ACC, aerobic colony count; ATP, adenosine triphosphate bioluminescence assay; PPV, positive predictive value; NPV, negative predictive value; CFU, colony-forming units; RLU, relative light units.
Discussion
Although the fluorescent marker method did not provide data on the bioburden of environmental surfaces, our findings indicate that the surfaces with <1 quarter circle of residual fluorescent marker had significantly less bioburden debris. Fluorescent markers are designed to indicate physical cleaning actions by housekeeping staff. However, the amount of residual marker remaining after cleaning varied, and the visual assessment of the amount of gel remaining on a surface cannot be interpreted as if it were a quantitative result of residual bioburden on a surface. Luick et alReference Luick, Thompson, Loock, Vetter, Cook and Guerrero 16 suggested that only surface that was totally wiped off should be considered clean, whereas Carling et alReference Carling, Parry and Von Beheren 11 suggested that surfaces with only a small amount of residual fluorescent solution could be considered clean. Boyce et alReference Boyce, Havill, Havill, Mangione, Dumigan and Moore 17 considered totally wiped off or partially wiped off to be cleaned. We showed that only 10.1% of the high-touch surfaces we tested had 1–3 quarter circles of residual fluorescent gel. The fluorescent gel could be wiped from a wet surface easily, and the targeted surfaces were easily divided into totally clean or not clean. Our classification using quarter circles provided a practical method to evaluate the cleanliness of fluorescent markers.
Like other studies,Reference Sherlock, O’Connell, Creamer and Humphreys 9 , Reference Luick, Thompson, Loock, Vetter, Cook and Guerrero 16 – Reference Snyder, Holyoak, Leary, Sullivan, Davis and Wright 18 we showed that the passing rates using the fluorescent marker and ATP methods were only modestly concordant with those using the ACC method. We used the ACC method as a standard of comparison with the other 2 methods because it measures the amount of pathogens.Reference Luick, Thompson, Loock, Vetter, Cook and Guerrero 16 If the cutoff value of the cleaning assessment method was lenient (ie, the benchmark criteria of ACC <250 CFU/100 cm2), the passing rate of the assessment method could not accurately reflect dynamic change. The goal of terminal cleaning is not sterilization; rather, varied cutoff values have been adopted for the ATP and ACC methods with the different equipment and systems and manufacturers to indicate a level of clean that will minimize cross transmission among hospital environments.Reference Smith, Beam and Sayles 19 , Reference Huang, Chen and Chen 20 We detected variations in the results of sampling from the same high-touch surfaces using the quantitative ATP and ACC methods (in spite of using strict or lenient cutoff values), which indicates that these methods are less reliable than the fluorescent marker method. Also, ATP values cannot be directly equated to the level of residual bacteria on surfaces, but the cutoff values of ATP indicating failure (ie, not clean) have been shown to correlate with the failure cutoffs for bacterial load. The test characteristics of the fluorescent marker and the ATP methods were similar. Nonmicrobial methods are more likely to incorrectly define a surface as not clean (ie, failing the assessment) when there is low microbial contamination than they are to incorrectly define a surface as clean (ie, pass the assessment).Reference Snyder, Holyoak, Leary, Sullivan, Davis and Wright 18 Although the fluorescent marker and ATP methods might not be sensitive enough to accurately measure small amounts of remaining bacteria load on surfaces, we found that they provided better specificity, with >75% unclean surfaces measured by the fluorescent marker or ATP methods showing a quantifiable bioburden.
Our study has several limitations. First, there were sampling-area limitations when measuring high-touch surfaces using the 3 methods at the same time. To avoid overestimation of ATP values by residual fluorescence, the sampling areas cannot overlap between the fluorescent marker and the ATP methods. Although the housekeeping staff completed the terminal cleaning, they may not have done the physical cleaning actions well. This explains was why the passing rate using the fluorescent marker method was lower than those of the other 2 methods and why the results differed between assessment methods. Even though a surface was found to be not clean or to be partially clean using the fluorescent marker criteria, this did not mean that the adjacent 100-cm2 area had not been physically wiped.Reference Boyce, Havill, Havill, Mangione, Dumigan and Moore 17 Second, we did not take high-touch surfaces samples before cleaning, so we could not determine the cleanliness before cleaning and the variations after cleaning. The sampling of cleanliness before terminal cleaning raises the possibility of sampling bias that may have affected the outcomes obtained after terminal cleaning, which may have led to an overestimation of the efficacy of cleaning.Reference Moore, Smyth, Singleton and Wilson 10 , Reference Boyce, Havill, Havill, Mangione, Dumigan and Moore 17 Thus, we evaluated the clean status after terminal cleaning and compared the results of targeting surfaces among the fluorescent marker, ATP assay, and ACC methods.
In conclusion, our evaluation demonstrates that the fluorescent marker method is a rapid and simple technique for evaluating cleanliness at hospitals. Strengthening a consistent and thorough wiping of high-touch surfaces may improve cleanliness. Further studies are necessary to establish the appropriate passing (ie, clean) rate of terminal cleaning association with reduced transmission of healthcare-associated pathogens and infections.
Acknowledgments
The funding organization was not involved in designing or conducting the study and did not take part in data collection, management, analysis, or interpretation of results. The Centers of Disease Control was not involved in the preparation or approval of this manuscript.
Financial support
This project was funded by the Centers for Disease Control, ROC (Taiwan) (grant no. MOHW105-CDC-C-114-112108).
Conflicts of interest
All authors report no conflicts of interest relevant to this article.