I. INTRODUCTION
The abundance of sunlight makes it a highly attractive source of green energy. Within the area of photovoltaic (PV) technologies, silicon is the dominant technology due to its mature manufacturing methods and moderate processing costs. Reference Shaheen, Ginley and Jabbour1 Recently, hybrid perovskite photovoltaics have attracted great interest due to their outstanding efficiency, a composition that is based on inexpensive materials and their ease of fabrication. Reference Liu and Kelly2–Reference Eperon, Stranks, Menelaou, Johnston, Herz and Snaith7 As a consequence of these promising characteristics, hybrid perovskites are showing strong potential to drive the next wave of widespread PV adoption; both in areas currently dominated by silicon and in innovative applications such as building integrated PV.
The term ‘perovskite’ can be used to describe a crystalline material with the general chemical formula ABX3. Hybrid perovskites are so named because the A cation is organic, with common examples in the area of solar cell research including methylammonium (CH3NH3 +) and formamidinium (HC(NH2)2 +). Reference Lee, Teuscher, Miyasaka, Murakami and Snaith6,Reference Eperon, Stranks, Menelaou, Johnston, Herz and Snaith7 These materials typically employ Pb as the B cation, with halides such as Cl, I, and Br used as the X anion. Since 2009 organo-lead halide perovskites have become pioneer materials in the development of next-generation PV, Reference Pellet, Gao, Gregori, Yang, Nazeeruddin, Maier and Gratzel8–Reference Noel, Stranks, Abate, Wehrenfennig, Guarnera, Haghighirad, Sadhanala, Eperon, Pathak, Johnston, Petrozza, Herz and Snaith11 with initial power conversion efficiencies (PCEs) now standing at 22% for laboratory scale devices. 12 Among the challenges facing the scale-up of perovskite PV, the toxicity of the semiconductors has been raised as a potential issue owing to the presence of lead. Reference Landrigan13,Reference Flora, Gupta and Tiwari14 Specifically, beyond the hazards present during solar cell fabrication and end-of-life recycling, the ability to deploy such cells in real world applications may be prohibited by the potential risk for lead seepage that occurs due to encapsulation failure (the solubility of organo-lead halide perovskites in water has been well-documented). Reference Babayigit, Ethirajan, Muller and Conings15 To overcome this, research into reduced lead or lead-free perovskites has gained traction over the past few years and amongst the possible substitute metals tin has showed reasonable promise. Reference Noel, Stranks, Abate, Wehrenfennig, Guarnera, Haghighirad, Sadhanala, Eperon, Pathak, Johnston, Petrozza, Herz and Snaith11,Reference Ogomi, Morita, Tsukamoto, Saitho, Fujikawa, Shen, Toyoda, Yoshino, Pandey, Ma and Hayase16,Reference Hao, Stoumpos, Cao, Chang and Kanatzidis17 Notable highlights include the demonstration of CH3NH3SnI3 solar cells with an initial PCE above 6%, Reference Noel, Stranks, Abate, Wehrenfennig, Guarnera, Haghighirad, Sadhanala, Eperon, Pathak, Johnston, Petrozza, Herz and Snaith11 however the efficient photovoltaic functionality of Sn rich phases in mixed Sn/Pb perovskites has been questioned. Reference Ogomi, Morita, Tsukamoto, Saitho, Fujikawa, Shen, Toyoda, Yoshino, Pandey, Ma and Hayase16 Additional issues that include semiconductor oxidation and the mitigation of hysteresis effects in devices continues to drive the development of reduced lead perovskites with the ultimate goal of matching the performance characteristics of the original lead-based semiconductors. Another study considered other metals that match the requirements on electron valency and size tolerance within the perovskite lattice. Reference Travis, Glover, Bronstein, Scanlon and Palgrave18 To reduce the use of lead, Park et al. have introduced bismuth as substitute for lead. Reference Park, Philippe, Zhang, Rensmo, Boschloo and Johansson19 Bismuth has much lower toxicity than lead and they found that caesium-bismuth perovskite showed a PCE of 1.09%, however, Cs is still considered mildy toxic. They also reported methylammonium Bi-perovskite which to which they assigned a MA3Bi2I9 structure and measured a PCE of 0.12%. Slavney et al. studied a double-perovskite structure Cs2Ag+Bi3+Br6 finding lattice a unit-cell axis of 11.25 Å is roughly double than that of (MA)PbBr3, however they did not test any photovoltaic devices. Reference Slavney, Hu, Lindenberg and Karunadasa20
Herein we explore the use of bismuth as a low toxicity alternative to lead in hybrid perovskite semiconductors. Alongside a control sample of CH3NH3PbI3−x Cl x we investigate a range of perovskites with the composition CH3NH3(Pb y Bi1−y )I3−x Cl x where y varies between 0 and 1 and x is small, with such samples prepared from a range of precursors (including BiCl3 and BiI3) and precursor blend ratios. Our study places particular focus on the crystallinity and phase purity of each perovskite, with scanning electron microscopy (SEM), energy-dispersive X-ray spectroscopy (EDS), and grazing incidence wide angle X-ray scattering (GIWAXS) measurements used to characterize their nanoscale structure and composition. Although their initial performance in solar cell devices is not promising, our structural data helps us to understand why this is the case. In general our results provide important insight into the processability of bismuth perovskites, thereby helping to refine the choice of materials and processing methods used for developing high performance hybrid perovskites with low toxicity.
The presentation of our results proceeds as follows. We first consider the linear UV–Vis absorption spectra of each perovskite sample, before discussing composition and microstructure characteristics in depth via SEM, EDS, and GIWAXS analysis. This data is used to build a preliminary model regarding the formation process for bismuth perovskites, in addition to providing insight into the ability for binary-metal compositions (i.e., Pb/Bi mixtures) to form crystalline semiconductor structures of high phase purity. Lastly, the results from an initial solar cell device study are presented. Our study concludes by considering engineering strategies for improving bismuth perovskite film quality.
II. RESULTS AND DISCUSSION
The general route for preparing hybrid perovskites films involves the coordination of an organic cation within a metal-halide lattice structure. This process can take place in solution, or via thermal annealing of a precursor film with an appropriate starting stoichiometry (i.e., relative concentrations of organic and inorganic material). To synthesize organo-bismuth halide perovskites, CH3NH3I (methylammonium iodide, hereafter referred to as MAI), BiI3 and BiCl3 were used as precursor materials to form CH3NH3BiI3 and CH3NH3BiI3−x Cl x . The role of starting stoichiometry for the pure tri-iodide perovskite CH3NH3BiI3 was investigated by considering 1:1 or 3:1 mol% mixtures of MAI and BiI3 respectively. Finally, The precursors for CH3NH3BiI3−x Cl x and CH3NH3PbI3−x Cl x were mixed to form three mixed metal cation perovskites with nominal compositions CH3NH3(Pb0.25Bi0.75)I3−x Cl x , CH3NH3(Pb0.5Bi0.5)I3−x Cl x and CH3NH3(Pb0.75Bi0.25)I3−x Cl x . A total of seven perovskite samples are considered in this study, with full preparation details provided in the experimental methods.
A. UV–Vis absorption
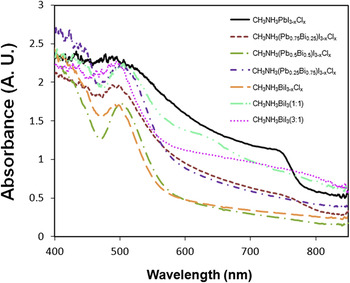
Figure 1 shows the UV–Vis absorption spectra for each perovskite film, where it can be seen that each sample exhibits a relatively strong absorption peak centered around 500 nm. For our control sample CH3NH3PbI3−x Cl x , its optical absorption extend to long wave length >750 nm where there is a distinct edge which when extrapolated meets the x-axis at approximately 820 nm, equating to a band gap of 1.51 eV in reasonable agreement with earlier reports. Reference Lee, Teuscher, Miyasaka, Murakami and Snaith6,Reference Colella, Mosconi, Fedeli, Listorti, Gazza, Orlandi, Ferro, Besagni, Rizzo, Calestani, Gigli, De Angelis and Mosca21 This is close to the value reported for CH3NH3PbI3, Reference Kulkarni, Baikie, Boix, Yantara, Mathews and Mhaisalkar22,Reference Bi, Shao, Yuan, Xiao, Wang, Gao and Huang23 again suggesting the low/trace levels of Cl in this perovskite. Among the mixed metal perovskites only CH3NH3(Pb0.75Bi0.25)I3−x Cl x showed a weaker absorption shoulder in the near-IR region of the light spectrum, at a wave length similar to that observed for the control sample (>750 nm). We tentatively attribute this feature to the presence of pure lead perovskite phases within the sample, given the 3× difference in lead molar content compared to bismuth in the precursor. Further increases in bismuth content within the sample, from Pb0.75Bi0.25 to Pb0.25Bi0.75, results in the eventual disappearance of this feature. For the pure bismuth perovskites, CH3NH3BiI3 (1:1) prepared from a 1:1 precursor stoichiometry shows a weak absorption edge at approximately 645 nm, whereas CH3NH3BiI3 (3:1) prepared from a 3:1 precursor stoichiometry and CH3NH3BiI3−x Cl x do not. For CH3NH3BiI3−x Cl x we estimate an optical band gap of 2.1 eV via extrapolation of the absorption edge beyond 510 nm. Note however that this method does not readily extend to every perovskite considered here, as the slow and incomplete drop-off in absorption (likely an indication of pronounced light scatter) will introduce unintended artifacts. Reference Tian and Scheblykin24
Absorbance spectra of CH3NH3PbI3−x Cl x , CH3NH3BiI3−x Cl x , CH3NH3BiI3 (1:1), CH3NH3BiI3 (3:1), CH3NH3(Pb0.25Bi0.75)I3−x Cl x , CH3NH3(Pb0.5Bi0.5)I3−x Cl x and CH3NH3(Pb0.75Bi0.25)I3−x Cl x films prepared on glass substrates. Precursor samples were annealed at 90 °C for 90 min to form each perovskite.

B. SEM/EDS characterization
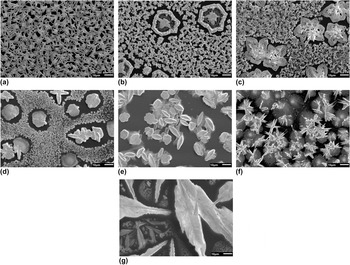
To study in detail the microstructure of each perovskite film, in addition to confirming their composition, we recorded a series of SEM images and EDS chemical surveys. Figure 2 shows representative SEM images for each perovskite. From Fig. 2(a), which corresponds to our control sample, it can be seen that CH3NH3PbI3−x Cl x consists of a relatively dense distribution of elongated crystals, each having a characteristic length between 3 and 10 µm. Quantitative analysis of this image suggests a surface coverage of 74%. For the mixed metal perovskites, shown here in Figs. 2(b)–2(d), two distinct structure types are present; a compact distribution of micron-sized crystallites that cover a sizable fraction of the substrate, and dispersed structures with a size between 20 and 30 µm. Note that these relatively large features are often surrounded by a region void of any material, suggesting that mass transport and/or substrate de-wetting has taken place during their formation. Reference Ondarçuhu and Aimé25 In general, these structures are present in greater number when the relative concentration of Bi in the sample increases. Although this might suggest the presence of separate perovskite phases in the sample (i.e., regions of pure CH3NH3PbI3−x Cl x that are spatially distinct from regions of pure CH3NH3BiI3−x Cl x ), EDS mapping indicates that the distribution of Bi throughout the sample is reasonably uniform (data presented in the Supplementary Material). As a consequence we suggest that the formation of either crystallite structure is not determined primarily by metal content, and is instead governed by factors that include halide composition, the dynamics of precursor conversion and the local presence of defects/impurities in the sample that act as possible nucleation sites for crystal formation.
SEM images of (a) CH3NH3PbI3−x Cl x , (b) CH3NH3(Pb0.75Bi0.25)I3−x Cl x , (c) CH3NH3(Pb0.5Bi0.5)I3−x Cl x , (d) CH3NH3(Pb0.25Bi0.75)I3−x Cl x , (e) CH3NH3BiI3−x Cl x , (f) CH3NH3BiI3 (1:1), and (g) CH3NH3BiI3 (3:1) films prepared on silicon substrates. Scale bar corresponds to 10 µm.

The SEM image for CH3NH3BiI3−x Cl x is shown in Fig. 2(e). Here it can be seen that multiple ‘flower’ shaped features are present, many of which appear to sit edge on from the substrate surface. These features are often surrounded by regions of what appears to be less structured material, however their total surface coverage is low (c. 50%). In Fig. 3(f) the film corresponding to CH3NH3BiI3 (1:1) shows a mixture of short needle like crystals protruding from central points (about 10 µm long) sitting on top of round unstructured regions that are between 10 and 35 µm in diameter. For this sample the total surface coverage is much higher than for CH3NH3BiI3−x Cl x . The CH3NH3BiI3 (3:1) perovskite film is principally characterized by large crystals (>50 µm in length) alongside local regions containing smaller structures as shown in Fig. 2(g). Connectivity between these regions is however poor, with many areas of the substrate containing no material whatsoever.
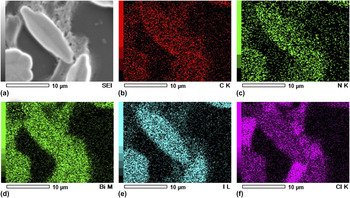
SEM image of (a) CH3NH3BiI3−x Cl x and corresponding EDS analysis with elemental mapping of (b) carbon, (c) nitrogen, (d) bismuth, (e) iodine, and (f) chlorine.

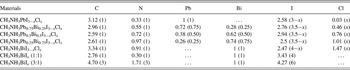
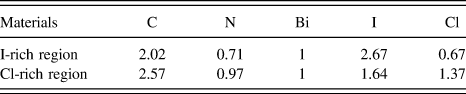
Having established that the bismuth perovskite films are comprised of multiple crystal structures with characteristically distinct sizes, we proceed to discuss their chemical composition as determined by EDS mapping. Table I summarizes the results of these measurements, where values correspond to the stoichiometric ratio of each element. Corresponding images are presented in the Supplementary Material Figs. S1–S7. As reported previously, Cl was almost completely absent in the CH3NH3PbI3−x Cl x film, Reference Zhao and Zhu26 indicating its removal from the sample during processing (i.e., via sublimation with excess MAI) Reference Yu, Wang, Xie, Li, Chen and Zhao27–Reference Zhang, Zhang, Yin, Jiang, Liu, Meng, Zhao and Wang29 or its preferential location at the substrate interface. As the ratio of Bi is increased in the mixed metal perovskite the Cl content rises from 0.46 (25% Bi) up to 1.47 (100% Bi). Spatially averaged EDS data for CH3NH3BiI3−x Cl x indicates a halide ratio of approximately 2.5:1.5I:Cl, however this result masks important local variations that will be discussed later. In line with the choice of starting precursor stoichiometries, CH3NH3BiI3 (3:1) shows the highest concentration of iodine. Although carbon was found to exist in a 1:1 ratio with nitrogen during elemental analysis of MAI, its relative concentration in each film is increased. We attribute this enhanced carbon content to a combination of sample contamination by carbon caused by electron beam exposure in the SEM and residual levels of trapped solvent.
The stoichiometric ratio of elements as determined by EDS for the CH3NH3PbI3−x Cl x , mixed metal perovskites, CH3NH3BiI x Cl y , and CH3NH3BiI x films as determined by EDS. The numbers in parenthesize correspond to the target stoichiometric ratio determined by the composition of the precursor solutions used.

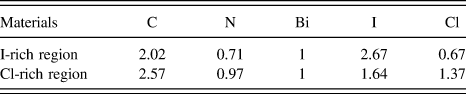
To identify the origin(s) for the different crystal structures present in the mixed Pb/Bi perovskite films, we note that EDS maps show a generally homogenous distribution of these specific elements throughout each sample. Cl and I are also similarly distributed in both the large and small structures. In contrast, from Fig. 3 noticeable differences in the distribution of the halides in the CH3NH3BiI3−x Cl x film are determined, where I closely maps to the large flower shaped structures present and Cl maps to the thin layer than lies beneath. It appears therefore that in these films there are two different stoichiometries which we subsequently refer to as I-rich and Cl-rich. To determine their molar ratio in each region we conducted a series of point EDS chemical surveys.
As summarized in Table II, in the I-rich regions bismuth preferentially binds to iodine when forming crystalline structures. Unlike in the lead-halide perovskite, a significant amount of chlorine is present in the film, suggesting that its removal during perovskite formation is less efficient when bismuth is present. In the I-rich regions the Bi:Cl:I ratio 1:0.67:2.67. Within the Cl-rich regions the Bi:Cl:I ratio is 1:1.37:1.64. These ratios indicate that the bismuth to halide ratio in both cases is almost 1:3, as one would expect for an ABX3 perovskite.
The EDS point analysis for the CH3NH3BiI x Cl y film highlighting the distribution of iodine and chlorine rich regions areas.
C. GIWAXS characterization
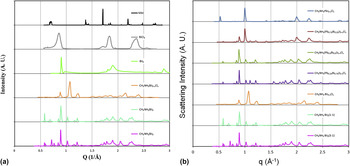
Given the difference in ionic radii for lead, bismuth, chlorine, and iodine, we suggest that the various structures imaged using SEM will also have different crystal lattice parameters. To test this hypothesis, and to also verify the presence of crystallites with a perovskite unit cell structure, samples were measured using GIWAXS. Radially integrated 1D X-ray scattering patterns from each sample are shown in Fig. 4, alongside patterns from films prepared using the precursor materials MAI, BiCl3, and BiI3. Immediately it can be seen that the diffraction pattern of each perovskite is not a simple linear combination of its precursor ingredients, thereby confirming the precursor components have combined to form new crystalline phases. The GIWAXS data for CH3NH3BiI3−x Cl x shown in Fig. 4(a) demonstrates minimal evidence for X-ray scattering from MAI and BiCl3, supporting the idea that the perovskite has a stoichiometry close to its target value. Nevertheless the presence of X-ray scattering peaks other than those attributable to the perovskite suggests more than one crystalline phase has been formed. For CH3NH3BiI3 (1:1) and CH3NH3BiI3 (3:1), there are clear indications that unreacted BiI3 is present within the film as well as unreacted MAI. This result implies that for these blends the precursors do not undergo complete conversion possibly because they are not stoichiometrically well matched. Despite the different mixing ratios used the X-ray scatter pattern from both these new crystal phases are very similar. This is in stark contrast to the different structures observed using SEM (see Fig. 3), demonstrating a strong sensitivity of sample microstructure to precursor composition. This sensitivity to composition has been noted by others. Reference Colella, Mosconi, Fedeli, Listorti, Gazza, Orlandi, Ferro, Besagni, Rizzo, Calestani, Gigli, De Angelis and Mosca21,Reference Yu, Wang, Xie, Li, Chen and Zhao27
(a) The 1D radially integrated GIWAXS patterns of MAI, BiCl3, BiI3, CH3NH3BiI3−x Cl x , CH3NH3BiI3 (1:1), and CH3NH3BiI3 (3:1) on the silicon substrates and (b) The 1D radially integrated GIWAXS patterns of CH3NH3PbI3−x Cl x , CH3NH3(Pb0.75Bi0.25)I3−x Cl x , CH3NH3(Pb0.5Bi0.5)I3−x Cl x , CH3NH3(Pb0.25Bi0.75)I3−x Cl x , CH3NH3BiI3−x Cl x , CH3NH3BiI3 (1:1), and CH3NH3BiI3 (3:1) films prepared on silicon substrates.

The X-ray scattering from CH3NH3PbI3−x Cl x is similar to previously published data, Reference Colella, Mosconi, Fedeli, Listorti, Gazza, Orlandi, Ferro, Besagni, Rizzo, Calestani, Gigli, De Angelis and Mosca21,Reference Tan, Moore, Saliba, Sai, Estroff, Hanrath, Snaith and Wiesner30,Reference Park, Philippe, Gustafsson, Sveinbjornsson, Hagfeldt, Johansson and Boschloo31 allowing us attribute the scattering peaks at q = 0.99 to 1.00 Å−1, q = 1.41 to 1.42 Å−1, and q = 1.99 to 2.00 Å−1 to X-ray scatter from the (002) and (110), (112) and (200), and (004) and (220) features of tetragonal CH3NH3PbI3−x Cl x respectively. For this system the corresponding lattice parameters are a = b = 8.85 Å and c = 12.69 Å, close to the values reported for the pure tri-iodide perovskite. Reference Baikie, Fang, Kadro, Schreyer, Wei, Mhaisalkar, Graetzel and White32–Reference Stoumpos, Malliakas and Kanatzidis34 The GIWAXS pattern for CH3NH3(Pb0.75Bi0.25)I3−x Cl x is broadly similar to CH3NH3PbI3−x Cl x , albeit with the addition of new scattering peaks at q = 0.89 Å−1, q = 1.21 Å−1 and peaks of relatively weak intensity between 1.50 Å−1 and 2.00 Å−1. This is consistent with the UV–Vis data presented in Fig. 1 that indicated a similar absorption onset for the two samples. For CH3NH3(Pb0.5Bi0.5)I3−x Cl x , the relative intensity of the peaks at 0.89 Å−1 and 1.21 Å−1 is higher, however the peaks corresponding to the (110) and (220) reflections from CH3NH3PbI3−x Cl x are found to undergo both a reduction in relative intensity alongside a small shift (c. 1%) to higher q values. This not only implies a reduction in Pb-rich perovskite content within the sample, consistent with the sample preparation conditions and UV–Vis/EDS data discussed earlier, but also a contraction in the unit cell size that may result from compressive strain. Further reductions in Pb content within the sample (i.e., CH3NH3(Pb0.25Bi0.75)I3−x Cl x ), results in an X-ray scattering pattern that is consistent with the observed trend.
In agreement with the SEM data presented in Fig. 2, the presence of X-ray scattering peaks that can be partly attributed to CH3NH3PbI3−x Cl x in the mixed metal samples suggests the formation of distinct crystal phases rather than the formation of an alloy. We suggest that prior to mixing precursor solutions for CH3NH3PbI3−x Cl x and CH3NH3BiI3−x Cl x , the partial formation of metal halide complexes has already taken place that favors the eventual formation of crystals containing either (but not both) metals. Interestingly, the observed peaks in the CH3NH3PbI3−x Cl x GIWAXS pattern at 0.89 Å−1 and 1.90 Å−1 match those from BiI3, despite the fact that BiI3 was not present as precursor material. It appears therefore that for these mixed Pb/Bi samples significant halide ion exchange has taken place during sample processing that results in the formation of BiI3. Furthermore, from Fig. 4(b) it can also be seen that the mixed Pb/Bi samples follow a trend that more closely resembles a transition from CH3NH3PbI3 to CH3NH3BiI3, rather than to CH3NH3BiI3−x Cl x , even though the precursors for CH3NH3BiI3−x Cl x were used for mixing, further indicating that halide exchange occurs. Reference Yoon, Stamplecoskie and Kamat35
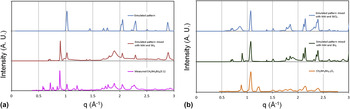
To better understand the origin of each new feature observed in our GIWAXS measurements, X-ray scattering patterns of single phase powder samples were simulated the using CrystalDiffract 6 software package. 36 Crystal structures (.cif files) for CH3NH3PbI3 and BiI3 were taken from a previous report. Reference Stoumpos, Malliakas and Kanatzidis34 The CH3NH3PbI3 scattering pattern measured was in good agreement with the previously reported structure. Crystal structures for bismuth perovskites have not been widely reported; therefore we started from a generic ABX3 structure file (A = methylammonium, B = Bi, and X = halide) and iteratively adjusted the lattice parameters until it matched the experimental data. The fitted lattice parameters for CH3NH3BiI3 (prepared from both the 1:1 and 3:1 precursor mixtures) correspond to a tetragonal structure. Figure 5 shows the simulated GIWAXS pattern of a perovskite with unit cell dimensions a = b = 8.67 Å and c = 12.41 Å and a mixture of this simulated pattern BiI3 and MAI. This mixture is compared to the measured data for CH3NH3BiI3 and as shown, there is reasonable agreement between the mixture and the experimentally measured data. Specifically, the simulated ABX3 pattern shows two peaks at the q = 1.01 Å−1 and 1.02 Å−1, corresponding to the (002) and (110) reflections respectively. The experimental pattern for CH3NH3BiI3 also shows a peak at the q = 1.02 Å−1, alongside a shoulder at q = 1.01 Å−1.
The GIWAXS patterns from (a) the simulated ABX3 (tetragonal a = b = 8.67 Å and c = 12.41 Å), simulated mixture of ABX3, MAI, and BiI3, and the experimentally observed pattern from CH3NH3BiI3 (3:1) and (b) the simulated ABX3 (tetragonal a = b = 8.67 Å and c = 12.41 Å), simulated mixture of ABX3, MAI, BiCl3, and BiI3, and the experimentally observed pattern from CH3NH3BiI3−x Cl x .

The mixture and the experimental pattern both show several peaks between q = 1.5–2.3 Å−1. Therefore, the relatively intense peaks observed can be modeled using a mixture of a generic ABX3 crystal lattice, MAI and BiI3, allowing us to conclude that CH3NH3BiI3 forms a perovskite structure. However, between q = 0.5 Å−1 and 1 Å−1 there are several weak features that cannot be readily identified, alongside a peak showed at q = 1.21 Å−1 that is present in the GIWAXS data for every bismuth containing perovskite. These features are tentatively attributed to the presence of unreacted BiCl3 and other impurities.
We also adapted our model to simulate the X-ray scattering pattern for CH3NH3BiI3−x Cl x , based on a generic ABX3 structure, and combined it with data for MAI, BiI3, and BiCl3. The results are presented in Fig. 5(b). To match the experimental data the best fit lattice parameters used in the simulated ABX3 structure were a = b = 8.29 Å and c = 11.89 Å. Weak X-ray scattering features at q = 1.21, 1.64, and 2.04 Å−1 were not well matched by our model suggesting the presence of unidentified residual phases that are in addition to the perovskite, MAI, BiI3 and BiCl3.
D. Solar cell performance
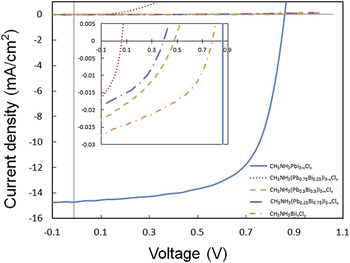
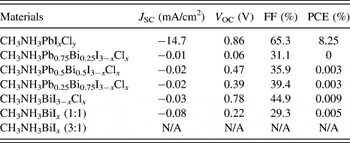
Our measurements on methylammonium bismuth- and methylammonium mixed Pb/Bi-perovskite films have evidenced systems with limited phase purity (relative to our control sample for CH3NH3PbI3−x Cl x ), in addition to the presence of crystalline structures that have incomplete surface coverage and a range of length-scales. To determine whether such films exhibit any photovoltaic functionality, we fabricated a series of inverted architecture solar cell devices according to the structure ITO/PEDOT:PSS/Perovskite/PCBM/Ca/Al. Light J–V curves and tabulated metrics for each device are shown in Fig. 6 and Table III respectively. Here it can be seen that as expected the control devices based on CH3NH3PbI3−x Cl x exhibited the best solar cell performance by a considerable margin, recording average efficiencies of 8.25% (J SC = −14.7 mA/cm2, V OC = 0.86 V, FF = 65.3%). This result is similar to our previous work using the same materials and processing routes. Reference Barrows, Pearson, Kwak, Dunbar, Buckley and Lidzey37 In comparison, and in agreement with Park et al. Reference Park, Philippe, Zhang, Rensmo, Boschloo and Johansson19 PCE values for the Bi containing devices were very low. Mixed Pb/Bi perovskite solar cells exhibited J SC and V OC below 0.03 mA/cm2 and 0.5 V respectively. For the CH3NH3BrI3−x Cl x solar cells [data shown in Fig. 6(b)] a maximum PCE of 0.009% was determined (J SC of −0.03 mA/cm2, V OC = 0.78 V, FF = 44.8%). Although its performance was poor, the J–V curve shows the distinctive shape for a photovoltaic device; furthermore a V OC of 0.78 V was high compared to the other Bi containing perovskite solar cells. Lastly, for CH3NH3BrI3, a relatively high J SC of 0.08 mA/cm2 was measured when the perovskite was prepared from a 1:1 mixture of precursor materials. This was offset however by a low V OC value of 0.22 V. CH3NH3BrI3 prepared from a 3:1 precursor mixture did not show any measureable photovoltaic effect.
J–V curves for solar cell devices based on CH3NH3PbI3−x Cl x , CH3NH3(Pb0.25Bi0.75)I3−x Cl x , CH3NH3(Pb0.5Bi0.5)I3−x Cl x , CH3NH3(Pb0.75Bi0.25)I3−x Cl x , and CH3NH3BiI3−x Cl x .

Photovoltaic performance parameters of the devices produced for this study.

Despite the disappointing device efficiencies reported for the Bi perovskite solar cells it is still noteworthy that these materials can produce a measurable photovoltaic effect. From our SEM, EDS, and GIWAXS data some of the reasons why the performance of these devices are poor can be understood. The material characterization data suggests that both the mixed Pb/Bi and the 100% bismuth based perovskite films contain a significant amount of impurity phases from compounds including BiI3 and MAI. It is assumed that these are responsible for the dramatically reduced J SC, V OC, and FF values relative to our control device as they may act to increase the internal resistance of the devices. In addition, the inhomogeneous surface coverage of these perovskites will also limit photocurrent efficiency due a reduced effective active area. Given the promising V OC value for CH3NH3BrI3−x Cl x , we believe sufficient incentive exists to continue our studies into this material with a focus on the optimization of the semiconductor phase purity and microstructure. By eliminating impurities from the material as well as maximizing its coverage on a substrate layer (potentially via a refined precursor conversion process), it should be possible to realize hybrid perovskite solar cells with improved quantum efficiencies and PCEs, thereby providing a potential low-toxicity alternative to lead-based perovskites for solar cell applications.
III. CONCLUSIONS
In this work, we studied bismuth as a substitute metal cation for lead in hybrid perovskite semiconductors. We show that significant halide ion exchange takes place during sample processing and conclude that CH3NH3BiI3 and CH3NH3BiI3−x Cl x adopt a tetragonal perovskite structure with unit cell parameters a = b = 8.67 Å and c = 12.41 Å and a = b = 8.29 Å and c = 11.89 Å respectively. Composition and structural analysis of these perovskites evidence the presence of large (>20 µm lateral size) crystallites, alongside regions of smaller crystallites and apparently amorphous material. GIWAXS measurements confirm the inhomogeneous phase composition of these samples, which in combination with their poor surface coverage provides a clear explanation for their inefficient photovoltaic behavior in a solar cell device. The promising V OC for CH3NH3BrI3−x Cl x solar cells (0.78 V) however suggests that efficient solar cells can be realized, with optimization of the perovskite precursor conversion process being an obvious focus for future studies.
IV. EXPERIMENTAL METHODS
A. Material preparation
Perovskite precursors were made from methylamine (33 wt% in ethanol, Sigma-Aldrich Company Ltd., Dorset, United Kingdom), hydriodic acid (57 wt% in water, Acros Organics, Morris Plains, New Jersey), PbCl2 (Acros Organics), BiI3 (Sigma-Aldrich Company Ltd.), BiCl3 (Acros Organics), and anhydrous DMF (Sigma-Aldrich Company Ltd.). These materials were used as purchased without any further purification.
B. Synthesis of methylammonium iodide (MAI)
24 mL of methylamine solution and 10 mL of hydriodic acid were stirred in 100 mL of ethanol for 2 h under nitrogen. The solvent was dried in a vacuum rotary evaporator. Yellow-white solid was formed and then washed with acetone. The product was dried in vacuum oven overnight at 40 °C. The white crystallized powder of methylammonium iodide was successfully produced as determined by elemental analysis. Anal. Calcd for CH3NH3I: C, 7.55; H, 3.81; N, 8.8; I, 79.82. Found: C, 7.67; H, 3.63; N, 8.71; I, 79.80. Elemental analysis was performed using a Perkin Elmer (Billerica, Massachusetts) 2400 series II CHN analyser.
C. Methylammonium lead iodide chloride (CH3NH3PbI3−x Cl x ) precursor
The procedure used to prepare the lead perovskite precursor solution was previously reported by A.T. Barrows et al. In brief, 419.4 mg of MAI (2.63 mmol) and 244.6 mg of PbCl2 (0.88 mmol) were dissolved in 1 mL of DMF with a solid concentration of 664 mg/mL.
D. Methylammonium bismuth iodide chloride (CH3NH3BiI3−x Cl x ) precursor
The CH3NH3BiI3−x Cl x was prepared by dissolving 419.4 mg of MAI (2.63 mmol) and 277.3 mg of BiCl3 (0.88 mmol) in 1 mL of DMF resulting in a total solid concentration of 696.7 mg/mL.
E. Methylammonium bismuth iodide [CH3NH3BiI3 (1:1)] precursor
Similarly, the MABiI x was prepared using 139.8 mg of MAI (0.88 mmol) and 518.6 mg of BiI3 (0.88 mmol) dissolved in 1 mL of DMF. The resulting total solid concentration was 658.4 mg/mL.
F. Methylammonium bismuth iodide [CH3NH3BiI3 (3:1)] precursor
419.4 mg of MAI (2.63 mmol) and 518.6 mg of BiI3 (0.88 mmol) were dissolved in 1 mL of DMF with a solid concentration of 938 mg/mL.
All precursor solutions were heated to and kept at 70 °C overnight to ensure that any solids were fully dissolved. These were subsequently cooled to room temperature and then filtered (0.45 µm PTFE) before use.
G. Mixed metal methylammonium lead bismuth iodide chloride precursors
Three mixed metal precursor solutions were made by mixing the prepared CH3NH3PbI3−x Cl x and CH3NH3BiI3−x Cl x solutions in different ratios. The CH3NH3Pb0.75Bi0.25I x Cl y was made up of 0.75 mL of CH3NH3PbI3−x Cl x and 0.25 mL of CH3NH3BiI3−x Cl x . The CH3NH3Pb0.5Bi0.5I x Cl y was made from 0.50 mL of CH3NH3PbI3−x Cl x and 0.50 mL of CH3NH3BiI3−x Cl x . Finally, the CH3NH3Pb0.25Bi0.75I x Cl y was made from 0.25 mL of CH3NH3PbI3−x Cl x and 0.75 mL of CH3NH3BiI3−x Cl x .
H. Substrates for thin films
To produce thin solid films from each of the precursor solutions they were spin coated onto a solid substrate. Nominally identical samples were prepared on different types of substrate for the different characterization techniques used. For the SEM, EDS, and GIWAXS characterization approximately 15 × 15 mm pieces of Si wafer were used as the substrates. For the UV–Vis absorption spectroscopy 25 × 25 mm pieces of glass were used. Finally for the device fabrication and testing glass substrates prepatterned with ITO electrodes as purchased from Ossila Ltd. (Sheffield, United Kingdom) were used.
I. SEM, EDS, and GIWAXS characterization
Pieces of silicon wafers were cleaned with acetone and isopropyl alcohol (IPA) in the ultrasonic bath for 10 min each and then exposed to an oxygen plasma for 10 min to remove any organic residues. The perovskite layer was spin coated on the silicon wafer at 5000 rpm then thermally annealed at 90 °C for 90 min. The films were fabricated in air. SEM images and EDS analysis were obtained using JEOL Ltd. (Tokyo, Japan) JSM6010LA microscope (10 kV, Multi-segment BSED detector). GIWAXS analysis was performed at beamline I07 at the Diamond Light Source (Harwell Science and Innovation Campus, Didcot, United Kingdom) using 10 keV X-rays, a Pilatus 2M detector, and a sample-detector distance of ∼40 cm.
J. UV–Vis absorption spectroscopy
Glass substrates were cleaned in Helmanex solution, IPA and deionized water in an ultrasonic bath for 10 min for each rinse respectively. The films were fabricated by spin coating (WS-400BZ-6NPP/lite, Laurell Technologies Corporation, North Wales, Pennsylvania) on the glass substrates. The films were thermally annealed at 90 °C for 90 min. UV–Vis absorption spectra were measured using an Ocean Optics (Dunedin, Florida) USB2000+ spectrometer and DT-MINI-2-GS combined deuterium–halogen light source.
K. Device fabrication and characterization
The planar heterojunction architecture used in this work is a relatively easy and fast way to fabricate perovskite solar cells. The perovskite layer is sandwiched between PEDOT:PSS and fullerene layers which act as hole and electron transporting layers, respectively. An advantage of this system is the relative ease with which the thickness of films produced using spin-coating is controlled. Pre-patterned ITO glass substrates (20 Ω/sq) were purchased from Ossila Ltd. The substrates were washed for 10 min each in Helmanex solution, IPA, and deionized water in an ultrasonic bath to remove any dirt on the ITO substrates. After washing, the substrates are blown dry using clean dry nitrogen. PEDOT:PSS (Heraeus Clevios™ P VP AI 4083, Ossila Ltd.) filtered through a 0.45 µm PVDF filter was then spin-coated at 5000 rpm (ACL = 255) for 30 s on the substrates resulting in a thin film of ∼40 nm thickness. The PEDOT:PSS coated ITO substrates were then annealed on a hot plate at 130 °C for 15–30 min. The perovskite precursor was subsequently deposited on top of the PEDOT:PSS layer by spin coating at 5000 rpm for 30 s. A small strip of the perovskite film on the edge of substrates was wiped off with a cotton bud to leave an area of the ITO electrodes exposed for contacting. The perovskite coated films were annealed on a hot plate for 90 min at 90 °C. Phenyl-C61-butyric acid methyl ester (PCBM) solution from Ossila Ltd. (50 mg/mL in chlorobenzene filtered through a 0.45 µm PTFE filter) was heated to 70 °C for 12 h before use. It was then spin-coated on top of the perovskite layers in an oxygen and moisture free glovebox. Again some of the ITO electrode was exposed by wiping off a strip of the PCBM on the edge of substrates using a cotton bud. Calcium and aluminum were deposited onto the PCBM layer through a mask to form cathodes in a vacuum evaporator. The thicknesses of the calcium and aluminum layers were nominally 5 and 100 nm respectively. The devices were then encapsulated with glass using UV-epoxy (Ossila Ltd.) cured under UV light for 30 min. The current density–voltage (J–V) characteristics of devices were measured using a Newport Corporation (Stratford, Connecticut) 92251A-1000 solar simulator in ambient conditions under simulated AM 1.5 sunlight at an intensity of 100 mW/cm2 as determined using an NREL calibrated silicon photovoltaic reference cell. The devices were masked with an aperture (0.025 cm2) to define the active area during the J–V measurement to minimize any edge effects. The PCE was subsequently calculated from the J–V data and the known illumination intensity.
Author contributions
CKK prepared the materials and conducted the SEM and device characterization. ADFD, ATB, and AJP conducted the GIWAXS measurements which were modeled by CKK. All authors contributed to the understanding and interpretation of the results and were involved in the writing process.
Supplementary Material
To view supplementary material for this article, please visit https://doi.org/10.1557/jmr.2016.499.
ACKNOWLEDGMENTS
We gratefully acknowledge funding from the EPSRC through research grants EP/M025020/1 “High resolution mapping of performance and degradation mechanisms in printable photovoltaic devices” and EP/J017361/1 “Supergen Supersolar Hub.” We thank Diamond Light Source for access to beamline I07 (SI11676-1) that contributed to the results presented here and we acknowledge Jonathan Rawle and Jonathan Griffin for their assistance during the GIWAXS experiments.