


Introduction
Etching techniques previously described by Muguruma (1961), Kuroiwa and Hamilton (1963), Levi and others (1965), and Kuroiwa (1969) for the observation of non-basal dislocations have failed to identify clearly the emergence sites of glide dislocations in the basal plane of ice. Such dislocations emerge on the prism planes of the crystal and the associated etch pits which result have been indistinct. They have been observed, however, by X-ray techniques (Webb and Hayes, 1967; Fukuda and Higashi, 1973; Jones and Gilra, 1973) in carefully prepared single crystals of ice of low dislocation density. These techniques cannot be applied readily to ordinary polycrystalline ice because of the limitations imposed by the resolution of the method and by the presence of grain boundaries and variation in crystallographic orientations among grains.
Previous studies of the etch pits which result from non-basal dislocations in ice were reviewed by Sinha (1977) in an attempt to clarify the mechanism of etching and replicating. It seemed, however, that the etching technique would require further development before it could be used to reveal the presence of glide dislocations in the basal plane. A more selective process was developed by varying the conditions of etching, i.e. the concentration of the etchant, its thickness, temperature, and drying time. The earlier work concentrated on etch pits on the basal plane resulting from the emergence of non-basal dislocations. The present report is concerned with using the technique for the detection of glide dislocations on the basal plane and applying it to some of the micro-deformational processes in polycrystalline ice.
Experimental Procedure
The ice surface was first prepared to a mirror finish by microtoming in the following way: Thick sections (up to 2 cm) of the required orientations were cut with a band saw. Each was mounted on a clear glass plate by freezing a few drops of water at the edge, making certain that no water entered the space between the glass and the specimen. This can be achieved if the water has been precooled to about 0°C. The exposed surface of the section was then microtomed to a mirror finish in three stages. First, 1 500 μm was microtomed off the surface, 10 μm at a time, to remove the cutting marks introduced by the band saw. This was followed by removal of 500 μm in 5 μm layers, cleaning the microtome blade with soft tissue after every pass. Finally, the surface was finished by removing another 100 μm in 1–2 μm layers, ensuring that the blade was clean before each pass. The quality of the surface was examined visually, using both reflected light from a distant source, and an optical microscope. This procedure was used to prepare mirror-finished surfaces up to 8 by 12 cm2 in size. On several occasions both surfaces were finished in this way to provide a thin section 0.4 mm thick for analysis with transmitted polarized light.
The prepared surface was then coated with a solution of Formvar (polyvinyl formal) in ethylene dichloride and allowed to dry under controlled conditions of humidity and temperature. This was achieved by keeping the specimens in a plastic enclosure containing crushed ice and provided with an adjustable opening through which a gentle flow of air could pass. The box was transparent so that the specimen could be observed without disturbing the environment inside.
Replicas were removed by peeling, melting the ice in water and allowing the film to float, and sublimating the ice, the method being determined by the particular experiment under consideration. They were carefully mounted on large glass slides with the replicated surfaces facing upwards and observed through an optical microscope. Selected areas were prepared for examination with a scanning electron microscope by vacuum deposition of a layer of carbon followed by a plating of gold.
Correspondence of Etch Pits to Dislocations
As the surface free energy is affected by the environmental conditions to which the surface is exposed, the method provides a control on the rate of preferential dissolution of water molecules from ice to the surrounding medium. By a proper choice of conditions, etching occurs not only at the point of emergence of dislocations on the surface but also along the dislocation line, resulting in replicas in the form of whiskers of uniform diameter.
An example of a forest of basal plane dislocations intersecting the {1120} surface is shown in Figure 1. The whiskers were as long as 60 μm and their diameter, after correction for the coatings of carbon and gold (about 2 by 0.06 μm), about 0,15 μm .
Neglecting the core energy, the diameter of the whiskers can be estimated from (Sinha, 1977)

where γ is the surface free energy of ice with respect to the etchant, b is the Burgers vector, r 0 is an inner cut-off radius inside which the approximation of linear elasticity theory does not apply, K is a function (Teutonico, 1970) of the elastic constants, orientation of the dislocation line, and Burgers vector, and R is the average outer extent of the strain field, given by

where d is the average density of dislocations emerging at the surface.
Scanning electron micrograph of a forest of basal-plane dislocations represented by the corresponding whiskers on {1120} surface.

Using Kb 2 = 9.85 × 10⁻¹⁰ J m-1 for edge dislocations on the basal plane (Tyson, 1971), b = 4.523 × 10⁻¹⁰ m, r 0 = 5b, and assuming γ = 0.02 J m-2 (ice–water interface energy in the range —30 to —40°C (Hobbs, 1974)), then whisker diameter is estimated to be 0.1 μm for dislocation densities in the range 106 to 107 cm-2. The diameter for the corresponding screw dislocations is about 0.07 μm. These agree well with experimental observations, considering the limitations in estimating γ and neglecting core energy. It was not possible clearly to differentiate between the two types of dislocations, but differences in the diameter of whiskers have been observed in replicas.
Characteristics of ETCH Pits
Figure 2 shows the relation of the whiskers to the prepared {1110} surface. The replicated whiskers were deliberately broken in this case to show the elongated etch features at the surface level. Moreover, this allowed determination of the density of basal dislocations. The density of dislocations in laboratory-grown columnar-grained ice varied from (0.5-5) × 107 cm-2, whereas the density of non-basal defects was found to be (1–4) × 106 cm-2.
The technique by which whiskers are produced has been used successfully for both basal and non-basal dislocations in ice and hence the ambiguity sometimes associated with the correspondence between etch pits and dislocations has been removed. However, it was found to be unnecessary to produce whiskers to determine the approximate crystallographic orientation from etch pits. The long direction of pits on surfaces normal to the basal plane were observed to be parallel to the <0001> axis. An example of elongated etch pits on the {1120} surface is shown in Figure 3 where the large pits, produced by evaporation using the Higuchi (1958) method, clearly give the direction of the crystallographic symmetry axis at the surface. These elongated etch pits have been useful for approximate determination of the <0001> direction of individual grains in horizontal cross-sections of columnar-grained ice for which the <0001> axis tends to be in this plane. Individual etch pits on surfaces other than the basal and prismatic, surfaces are asymmetric, resulting in complex etch features. Discussion of these features is outside the scope of this paper.
Broken whiskers un {1110} surface and the elongated surface-level etch features parallel to <0001>.

Scanning electron micrograph of large evaporation and minute dislocation etch pits on {1120} surface. Elongated dislocation pits are parallel to <0001> direction.

Movement of Basal Dislocations
The etching technique has been used to study the mobility of dislocations in metals (Gilman and Johnston, [c 1957]). Grooves or tracks have been observed to form if the dislocations move slowly during the etching process. The method has been used by Kuroiwa and Hamilton (1963) and by Levi and others (1965) to detect the mobility of non-basal dislocations in ice. As the etchant is also used for making the replica for ice, the conditions influencing etching rate, drying time, and the velocity of dislocations determine the characteristics of the etch tracks.
The etching technique was used to study dislocation movements under low stresses (about 0. 1 MN m-2 or less) (Sinha, 1977). More particularly, the method was used in examining the movement or track of non-basal dislocations under uniform and non-uniform stress fields. Figure 4a shows results of the application of this technique in the identification of the movement of dislocations in the basal plane. The passage of mobile dislocations can be seen in the form of etch tracks parallel to the traces of the (0001) plane on the {1120} prismatic surface. Figure 4a also indicates the loading sequence. Striations or elongated etch pits parallel to <0001> were obtained before any load was applied to indicate the direction of the c-axis. Etch tracks due to stress were produced later, as shown by their corrugated appearance when observed at an oblique angle. The minimum spacing between adjacent slip tracks was observed to be about 0.1 μm , which could give a measure of the spacings between fine slips (Conrad, 1961).
a (left) Stress-induced glide of basal dislocations revealed by the etch tracks on {1120} surface parallel to (0001) plane. b (right) Formation of whiskers by stationary dislocations.

Tape-like features in previously deformed ice.

There were indications that all the dislocations were not mobilized by an applied stress. Whiskers were also found at stationary dislocations (Fig. 4b). Other tape-like features such as that shown in Figure 5 were observed occasionally in deformed ice. Their thickness was comparable to the diameter of the whiskers, their width parallel to the <0001> axis. They can be thought of as a closely-spaced bundle of dislocations lying in different basal planes, but more study is needed to explain them fully.
Slip Bands
Pile-up of dislocations in slip bands is common if they are blocked in any way (Bueren, 1960; McLean, 1957). Figure 6a illustrates a pile-up in (0001) planes in a grain of previously deformed polycrystalline ice. Individual dislocations are associated with whiskers; the long direction at the base gives the direction of the <0001> axis. Whiskers often obstructed the view when the slip planes were closely spaced and linear dislocation densities were high. Observations indicate that it was sufficient for visual analysis to develop only the centrally depressed, elongated etch pits by careful choice of the etching conditions (Fig. 6b).
Individual etch pits could be identified and their spacings measured, except at the head of the pile-up when the linear density of dislocations in a slip plane was low (Fig. 6b). For high densities, the merging of adjacent etch pits prevented such identification. Moreover, a coarse slip band could consist of lamellae due to intensified fine slip (Conrad, 1961) and could be etched as deeply as a grain boundary. An example of a row of slip planes in a grain of columnar-grained ice is illustrated in Figure 7 which shows the variation in the linear densities of dislocations in different planes, giving an indication of the non-uniformity in the resolved shear stress inside the grain. This also emphasizes the role of the grain boundary as a barrier and, particularly, the effect of shear-stress concentration produced by a change in direction of a grain boundary. It also shows the saw-toothed structure that can develop at the grain boundary as a result of stress concentration at the head of a pile-up.
a (left) Dislocation whiskers in parallel rows of pile-ups. b (right) Centrally depressed etch pits in a pile-up.

Scanning electron micrograph of a cross-section of deformed S-2 ice showing a jagged grain boundary, ABC; slip bands having different dislocation densities; and the stress concentration effect of the change in the direction of the grain boundary at B which generated the deeply etched slip plane.

a (left) Pile-up against internal barrier and kinking in a slip band. b (right) General view of etch features in a favourably oriented grain of S-2 ice.

Pile-up of dislocations can also take place against interior barriers (Fig. 8a). Internal pile-up was commonly observed even in a single slip plane, and several examples are contained in Figure 8b which also shows: typical examples of curvature or sharp changes of curvature in slip planes, cell formation, development of tilt boundaries, and pile-up against these boundaries. Some features could have been developed during re-arrangement in the distribution of dislocations during recovery.
Sub-Boundaries
Grains in polycrystalline ice which have been deformed under the action of moderately high stresses (or high strain-rates) often show a vein-like distribution of dislocations (Fig. 9a) during the early stages of creep, in addition to pile-up and internal void formation. These veining patterns were observed in both basal and prismatic surfaces corresponding to non-basal and basal dislocations, respectively. Figure 9b shows these features in the grain; the upper right corresponds to the basal plane, the lower right to the prismatic surface. The example represents a small area inside a large polycrystalline ice specimen deformed under a compressive load of 2.2 MN m-2 to a total strain of 3 × 10⁻⁴ at — 10°C.
a (left) Veining in the distribution of basal dislocations in deformed polycrystalline ice. b (right) Optical micrograph of vein structures in both basal (e.g. lower right) and non-basal (e.g. upper right) dislocation distribution and their associations with the common grain boundary and triple point. Compressive load of 2.2 MN m 2 was applied in the vertical direction of the photograph; total strain was 3 × 10⁻⁴ at — 10°C. c (centre) Association of vein structure BD, in the grain at the upper left-hand corner, to the pile-up EB, in the neighbouring grain, against the common grain boundary ABC.

The photograph shows some association of the veins in three neighbouring grains and the role of the common triple point. Etch pits forming the vein features caused by the non-basal dislocations were asymmetric, probably because of the obliquity of the <0001> orientation with respect to the surface (Kuroiwa and Hamilton, 1963; Sinha, 1977). As these asymmetric pits are large (about 30 μm in diameter), there is strong reason to believe that they are associated with grown-in, non-basal dislocations forming the sub-boundaries, but further confirmation is required (Sinha, 1977). The illustration also shows slip bands in one grain near the top left-hand corner, and the association of bands with the triple point. Thus, both slip bands and veining patterns can develop simultaneously in different grains within a specimen. They have also been observed developing together in the same grain.
Vein structures, also, have been observed in association with the steps in the grain boundary and with the pile-up of dislocations in the neighbouring grain against the common boundary (Fig. 9c). Application of the etching technique after a long recovery period still shows the vein structures, indicating that these boundaries are effective traps for dislocations. With continued deformation, the veining patterns have been observed to evolve into fragmentation or polygonization boundaries. Such features have also been seen in other crystalline materials (McLean, 1957).
Deformation Features under Low Stresses
Creep in polycrystalline ice subjected to stresses less than 1.0 MN m-2 (or low strain-rates) showed extensive grain-boundary migration (Fig. 10a) and the formation of small-angle boundaries (Fig. 10b) during the initial period of creep. The examples are from a specimen deformed under a load of 0.6 MN m-2 to a strain of about 2.5 × 10⁻³ at —10°C. The migration of grain boundaries is the result of a complex interaction in the grain-boundary region (Stevens, 1966; Bell and Langdon, 1969; Raj and Ashby, 1971; Cannon and Nix, 1973). Formation of steps in the deformed grain boundaries was strongly dependent on the crystallographic orientation of the neighbouring grains and the orientation of the boundary with respect to the applied load. There was no evidence of the formation of dislocation pile-ups, which were so readily formed at higher stresses or higher strain-rates.
a (left) Migration of grain boundary under low stresses; the striations indicate the <0001> directions, b (right) Formation of small-angle till boundaries under low stresses and their association with the deformed groin boundary.

Variation of Dislocation Structures With Depth and Time
A great advantage in the proposed technique is its flexibility for three-dimensional mapping. Variation in structural detail throughout the crystal can be examined by repeated applications of microtoming, etching, and replicating. Figure 11 illustrates this, as well as changes which occur with time,
The first replica (Fig. 11a) shows etch features in S-2 ice about three hours after load was removed. The specimen was then wrapped in a plastic film and stored at — 10°C. Microtoming and etching were repeated 16 d (Fig. 11b) and 133 d (Fig. 11c) after the test; the second and third photographs show these areas about 0.5 mm and 3 mm, respectively, below the original sectional surface.
Striations produced by the emergence of basal dislocations at the surface indicate the random orientation of the <0001> axis of the various grains, as expected in horizontal planes in S-2 ice. The apparently isolated small grain near the centre of the first photograph is part of a larger grain at the top left-hand corner, as is evident in its increase in size in the second photograph and the continuity in the third. This is also evident in the direction of striations in the two parts of this grain.
The photographs show clearly that dislocations in slip planes are pinned down strongly, and it is possible to detect a previous straining for a long time after removal of the load.
Etching features in deformed S-2 ice at various depths and lapse of times. a (left) 3 h after the test. b (right) 16 d after and 0.5 mm below “a”. c (centre) 133 d after and 3 mm below “a”.
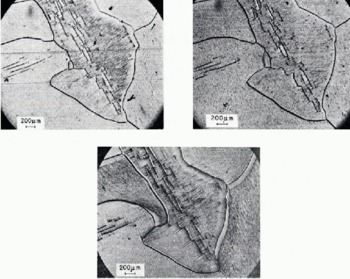
This has application in the identification of in situ strain and, possibly, the range of corresponding stresses or mode of loading experienced by an ice cover subjected to natural conditions. The illustrations also show that the density of slip lines can vary from one area to another in the same grain, and that the slip lines can propagate from one grain to another, though with a change in direction depending on the orientation of the slip planes in the neighbouring grains.
Conclusion
The technique of forming whisker replicas of basal dislocations has made the identification of line defects in ice more direct than was previously possible. Preparation of the surface by microtoming permits application of the technique to large areas and allows flexibility in repeated applications of the technique with the same crystal. Examples of those etching features which can be shown include glide of dislocations, formation of pile-ups against barriers and vein-like structures, grain-boundary migration, and the formation of small angle boundaries. These features demonstrate that the technique allows observation of some of the micro-deformational processes in ice.
The ability to replicate minute changes in the microstructure of ice opens up further possibilities for the application of the technique; for example, examination of grain-boundary sliding, dislocation multiplications, voids, and cracks in polycrystalline ice produced during creep. These studies will be reported in future publications.
Acknowledgements
The author gratefully acknowledges many helpful discussions with V. R. Parameswaran, the assistance of D. Wright in carrying out the tests, and E. G. Quinn in preparing scanning electron micrographs.
This paper is a contribution from the Division of Building Research, National Research Council of Canada and is published with the approval of the Director of the Division.
Discussion
S. J. JONES: Have you measured, or is it possible to measure, any dislocation velocities by your method?
N. K. SINHA: In principle, it should be possible to detect or measure the dislocation velocity by the etching action of the replicating solution, but since the tracks are about 0.25 μm wide, the resolution of optical microscopes could result in technical difficulties.
G. NOLL: Ice crystals, which have been deformed in several tests, showed in the second test the same (or very similar) deformation behaviour as in the first test, if the crystal has been annealed for only a few hours between the tests. (Temperature of tests and annealing —3 to — 10°C.) Could you observe what happened to the dislocations created in the first test and especially to those piled up in front of obstacles? Are only newly-created dislocations mobile in a second deformation?
SINHA: The subject is under investigation at the moment but I have not come to any definite conclusion. As far as the pile-ups are concerned, it was observed that the dislocations are strongly pinned down, and annealing at —10°C for times up to 4 months did not remove them, as has been shown and described in the text.
W. B. KAMB: Regarding the dislocation tracks: were they formed by dislocations that moved during the etching and replicating process, or do they represent a wake of crystal damage behind a moving dislocation ?
SINHA: The tracks illustrated were produced by the moving dislocations under the action of the etchant, while the specimen was under load.



