Introduction
Internationally, systems of social assistance (or welfare) have undergone significant restructuring over the past two decades. Traditional approaches, often characterised as ‘passive’ programmes of entitlement, have increasingly been replaced with ‘active’ labour market policies that contain an explicit welfare-to-work orientation (OECD, 2005, 2006). As major reform legislation was passed initially in the US and subsequently in countries as diverse as the UK, Sweden, France, Germany, Israel and Australia, a new emphasis on the supply-side of the labour market emerged. Welfare programmes were redesigned to improve the attitudes and motivation of the unemployed, and benefits were increasingly conditional upon job search and/or a demonstrated willingness to improve employability, with an overall goal of rapid labour market entry (Lodemel and Trickey, Reference Lodomel and Trickey2001; OECD, 2006; Taylor-Gooby, Reference Taylor-Gooby2005).
In keeping with other industrialised countries, Canada embraced this shift. In 1995, the Canada Assistance Plan (CAP), the federal cost-sharing legislation that had governed transfers to the provinces for social assistance programmes since 1976, was replaced with the Canada Health and Social Transfer (CHST), a block transfer with fewer conditions – and less money – attached.
CAP, perhaps the most progressive social assistance legislation in Canadian history, had specified that entitlement to benefits was to be based solely on a determination of need (or ‘at risk’ of being in need) with no qualifications or conditions attached. Basing eligibility on ‘need’ prohibited the imposition of other conflicting requirements by the provinces (Moscovitch, Reference Moscovitch1996) and ensured that ‘work-in-exchange-for-welfare’ remained ineligible for federal financial support.
CAP was never fully embraced by the federal bureaucracy, in part because the 50/50 cost-sharing arrangements with the provinces placed no upper limits on Ottawa's potential financial liability. As the political climate changed into the 1980s, Canada reduced social programmes and began to reframe them as ‘active’ rather than ‘passive’ supports (Pal, Reference Pal1983). Successive Conservative and Liberal federal governments attempted to establish a leaner welfare state. Transfers to the provinces were the main form of federal social spending and the chief target for cutbacks as financial pressures mounted.
Several provinces began to experiment with welfare-to-work programmes at this time. A 1985 federal-provincial agreement allowed the provinces to develop a variety of local pilot programmes, including work-for-welfare schemes penalising non-participants, with full federal cooperation and generous federal funding (Pulkingham and Ternowetsky, Reference Pulkingham, Ternowetsky, Broad and Antony1999; Bashevkin, Reference Bashevkin2002).
The adoption of CHST in 1995 was formalised over a decade of incremental change during which time the foundations of Canada's welfare state settlement had been gradually eroded. CHST embodied the emerging international consensus around market-based selectivity, social contracts and rights and responsibilities. The emphasis was now on compulsion rather than voluntarism, sanctions rather than incentives and individualised obligations rather than collective rights. The introduction of CHST was variously labelled as a ‘watershed in the history of Canadian social policy’ (Battle and Torjman, Reference Battle and Torjman1995: 1) and the death of the post-war Canadian welfare state (Evans, Reference Evans and Sayeed1995; Pulkingham and Ternowetsky, Reference Pulkingham, Ternowetsky, Broad and Antony1999; Shewell, Reference Shewell, Dixon and Hyde2001; Shragge, Reference Shragge1997). In the first year of CHST, the provinces received Can $2.5 billion less money than under the previous system (Battle and Torjman, Reference Battle and Torjman1995), and the following year a further $2 billion was cut.
As ‘compensation’ for the money removed from welfare under CHST, the provinces were granted significantly greater flexibility in their options for ongoing welfare programming. Armed with greater autonomy and discretion, provinces moved rapidly to introduce new ways of providing assistance (Herd, Reference Herd2002; Lightman et al., Reference Lightman, Mitchell and Herd2005). In practice, this often led to the creation of ‘work-first’ programmes built upon principles of compulsory participation and enforced by financial sanctions for non-participation (Morel, Reference Morel2002). Longer-term opportunities for skills development and training were limited and replaced with an emphasis upon the ‘shortest route’ to paid employment.
Despite these far-reaching reforms and in contrast to the extensive research that has taken place in other countries, there has been relatively little research on the outcomes of those leaving welfare in Canada, especially over the longer term. This article contributes to the knowledge in this area by exploring the post-welfare labour market experiences of people who were on social assistance in Canada in 1996, one year after the introduction of CHST, with its formal sanction of provincial welfare-to-work initiatives. The findings add to the established body of knowledge concerning welfare-to-work policy in post-industrial welfare states by providing more detailed insights into the Canadian experience.
To this end, we utilise the longitudinal micro-data files of the Survey of Labour and Income Dynamics (SLID) from Statistics Canada, which enable a given panel of recipients to be tracked over a five-year period (1996 to 2001). As we have noted, this period is particularly significant as it lies at the heart of a fundamental change in social assistance policy and practice in Canada. We examine the mixing of work and welfare within this panel, the transition from welfare to work, and selected labour market indicators – primarily hours of work and wages – that social assistance recipients face as they enter the world of paid work.
‘Work-first’ welfare reform
While there is no single model of ‘active’ welfare-to-work policy, a number of common elements are evident, including making benefits conditional upon job search and/or a demonstrated willingness to improve employability (OECD, 2002). Among countries such as Canada, the United States, Great Britain, Australia and others, this has manifested itself in a solidifying convention around ‘work-first’ approaches, which place priority on rapid labour force attachment through mandatory participation in job search and related activities (Daguerre, Reference Daguerre2004). Less emphasis is placed on longer-term and higher-cost human capital interventions, such as education and skills training (Gray, Reference Gray2003; Human Resources Development Canada, 2000). The focus is on the initial transition into employment (Peck and Theodore, Reference Peck and Theodore2000). Underlying this is a ‘stepping stone’ philosophy, which holds that welfare recipients are more likely to secure good jobs if they are already working: the view that ‘any job is a good job’.
Coincident with the emergence of ‘work-first’ as a focus for social assistance reform has been the rise in market income inequality ‘driven by rises in the top of the distribution and very substantial falls at the bottom’ (Frenette et al., Reference Frenette, Green and Picot2004: 28) and the associated increase in ‘precarious’ or ‘non-standard work’. The latter can include low pay; risks of regular unemployment; temporary, contract or contingent work; involuntary part-time or under-employment; or low-earning ‘own-account’ self-employment (Vosko, Reference Vosko2005).
Precarious work, and the low earnings or irregular hours that define it, are concerns not solely because of the immediate economic vulnerability that may accompany them. Such jobs may also not allow for the exercise of existing skills and capacities, or the development of the human capital that would permit individuals to access better jobs. That is, precarious work may be linked to more permanent exclusion. The available evidence suggests that low-paid workers tend to remain low paid and that the risks of unemployment are higher among those with less education and fewer skills (Jackson, Reference Jackson2003).
The literature on social exclusion shows that unemployment, particularly long-term unemployment, is a key causal factor (OECD, 1999; Figueiredo and de Haan, Reference Figueiredo and de Haan1998). Employment is therefore seen as a principal element of ‘social inclusion’, a crucial route to the development of individual capabilities and participation in the larger society. While the significance of employment as a source of inclusion cannot be denied, clearly the conditions of employment are the key link in the chain that leads from employment to inclusion. Low pay or very long or short hours can create or exacerbate exclusion in other dimensions of life. Those at risk of precarious employment and longer-term exclusion include people moving from social assistance to the paid labour force.
Post-welfare transitions
In many countries, notably the US and UK, there is an extensive programme evaluation literature that assesses the impacts of welfare reform, with a particular emphasis on the employment and income of welfare ‘leavers’ (Bivand et al., Reference Bivand, Britton, Morrin and Simmonds2004; Blank, Reference Blank2002; Cancian et al., Reference Cancian, Haveman, Meyer and Wolfe2002; Evans et al., Reference Evans, Harkness and Ortiz2004; Harker, Reference Harker2006; National Audit Office, 2007; Urban Institute, 2005). The research shows, for example, that while many welfare leavers find employment, jobs are typically low paid and poor quality, job retention is low, and job progression lower still.
More specifically, there is also a significant body of research focusing on what is referred to as ‘cycling’ – the process of repeatedly moving off and back onto assistance. Although there is significant variation across studies as to how many welfare leavers return, there is little doubt that cycling represents a major policy challenge. Historically, US research indicates that between 17 per cent and 37 per cent of former welfare recipients return within a year of exit, while 33–60 per cent return within five years (Bane and Ellwood, Reference Bane and Ellwood1986; Meyer and Cancian, Reference Meyer and Cancian1996). In a detailed review of leavers’ studies, Acs and Loprest (Reference Acs and Loprest2001) reported a median return rate of 27 per cent within the first year after exit. Other studies have suggested between 20 per cent and 35 per cent of welfare leavers return within the first few months and many more over the next few years (Cancian et al., Reference Cancian, Haveman, Meyer and Wolfe2002; Hamilton, Reference Hamilton2002; Urban Institute, 2005). In the UK, meanwhile, studies have found that as many as half of those who leave welfare return within one year (Ashworth et al., Reference Ashworth, Middleton and Walker1997a, Reference Ashworth, Walker, Jenkins, Shaw and Gregg1997b). Bivand et al. (Reference Bivand, Britton, Morrin and Simmonds2004) found that 35 per cent of all those on New Deal for Young People (18–24) were classed as returners, while on New Deal 25+ the figure was 32 per cent.
As these data demonstrate, studies which track movement on and off the caseload over longer periods find that while levels of cycling vary over time, many of those destined to return do so relatively quickly. Indeed, a number of studies have found that 20–35 per cent of welfare leavers return within the first few months of exit (Cancian et al., Reference Cancian, Haveman, Meyer and Wolfe2002; Hamilton, Reference Hamilton2002). Typically, studies show that returns to welfare increase over the first four quarters after exit. However, some report relatively high returns even in the first post-exit quarter, with returns closely bunched in the second through third quarters (Loprest, Reference Loprest2002).
Unsurprisingly, the existing research shows that people who return to welfare are more disadvantaged and less employable than those who do not return. In the US, compared with those who keep their jobs, those who return to welfare are much more likely to be in poor health, to have low levels of education, to have limited work experience and to have young children (Urban Institute, 2005). Nationally, as many as 55 per cent of the caseload have less than a high school education, while 33 per cent read at only third to fourth grade level (US DHHS, 2002). Studies have found that as many as 40 per cent of recipients have had no work experience prior to their first enrolment in welfare. In addition, a range of studies have confirmed the significant correlation between returns to assistance and issues such as domestic violence, lack of transportation, substance abuse, poor physical health, mental health problems and children's health problems (Acs and Loprest, Reference Acs and Loprest2001; Cancian et al., Reference Cancian, Haveman, Meyer and Wolfe2002; Nam, Reference Nam2005).
The concept of multiple barriers to employment has also been the subject of research in the UK. Berthoud (Reference Berthoud2003), for example, assessed the importance of multiple barriers as a predictor of joblessness for working-age people and found that the additive impact of six specific disadvantages placed some individuals at very high risk of being jobless.Footnote 1
A review of the two largest New Deal programmes found that these multiple levels of disadvantage were strongly evident in the characteristics of those who returned to welfare (Bivand et al., Reference Bivand, Britton, Morrin and Simmonds2004). Similarly, a study of lone parents in the UK found that those who returned to welfare had longer durations out of work, lower education levels, more ill health, younger children and a higher percentage had three or more children than those that entered and remained in work, and lower wages and weekly earnings (Evans et al., Reference Evans, Harkness and Ortiz2004). Overall, Evans et al. (Reference Evans, Harkness and Ortiz2004) found evidence of a ‘low pay–no pay’ cycle for single parents, with low-paying jobs having only a small probability of being ‘stepping stones’ and a far greater likelihood of contributing to cycling between low pay and no pay. This echoes previous work which characterised this phenomenon as the ‘low pay–no pay’ cycle and ‘blind alleys, not stepping stones’ (Stewart, Reference Stewart1999; McKnight, Reference McKnight, Hills, Grand and Piachaud2002).
Cycling in Canada
Little is known in Canada about the long-term economic circumstances of social assistance recipients and the characteristics of their employment once they leave the system. Likewise, little is known about those who stay behind. In a number of studies, data were collected at a single point in time and thus little is known about how former social assistance recipients’ employment circumstances and social assistance receipt change over the longer term.
A number of Canadian studies in the 1990s explored the issue of welfare dynamics (Barrett and Cragg, Reference Barrett and Cragg1998; Christophides et al., Reference Christophides, Stengos and Swindinsky1998; Duclos et al., Reference Duclos, Fortin, Lacroix, Roberge, Chaykowski and Powell1999). Most utilise provincial social assistance administrative files to track individuals through their welfare spells and provide useful information on the length of spells and how these vary with individual characteristics, such as family type and number of children. Such studies, however, typically do not track individuals after exit, and reveal nothing about re-entry rates.
A small number of studies provide greater insight in this regard (City of Toronto, 2002; Ford et al., Reference Ford, Gyarmati, Foley, Tattrie and Jimenez2003; Frenette and Picot, Reference Frenette and Picot2003; Lightman et al., Reference Lightman, Mitchell and Herd2005; Michalopoulos et al., Reference Michalopoulos, Tattrie, Miller, Robins, Morris, Gyarmati, Redcross, Foley and Ford2002; Mitchell et al., Reference Mitchell, Lightman and Herd2005). Analysing national trends in Canada, Frenette and Picot (Reference Frenette and Picot2003) found that over the five years following exit, 52 per cent of leavers had returned to the system at some point. Significantly, however, this re-entry was sporadic: only 13 per cent returned to welfare within one year. Five years after leaving welfare, 29 per cent had returned for at least one year. In terms of income, the authors found that on average family incomes rose after leaving welfare, but, for approximately one-third of leavers, income declined (Frenette and Picot, Reference Frenette and Picot2003). After five years, those who had fared worst originally upon leaving welfare increased their incomes ‘substantially’, but this only returned them to the very low incomes they had received earlier while on welfare.
The final report of the Self-Sufficiency Project (SSP), a study measuring the impact of financial incentives in welfare exits in New Brunswick and British Columbia, reported that approximately 60 per cent of study participants were not working after five years (Michalopoulos et al., Reference Michalopoulos, Tattrie, Miller, Robins, Morris, Gyarmati, Redcross, Foley and Ford2002). The study focused on about 6,000 single parents who had received social assistance for at least one year between November 1992 and March 1995. One half of the study participants were randomly assigned to the programme group whereby they received an earnings supplement if they left social assistance and worked at least 30 hours per week. The control group received no such work incentives. Initially, programme group individuals had much higher levels of employment, including full-time employment, and earnings and lower social assistance receipt. However, these differences all but disappeared by 54 months.
A survey of individuals who had left social assistance in Ontario found that less than a year after leaving assistance 20 per cent of those who had left assistance for employment had lost their jobs and 27 per cent were unemployed (Ontario Ministry of Community and Social Services, 1998). A similar survey of welfare leavers conducted by the City of Toronto in 2001 found that less than a year after leaving assistance approximately two-thirds of respondents were working. Of those who left welfare for employment-related reasons, 84 per cent were employed at the time of the survey. There was a higher incidence of temporary and part-time employment, in comparison to the overall Ontario adult labour force. Average hourly wages were low – about two-thirds of the average among Ontario adults aged 25 and over – and average weekly earnings were 60 per cent of the Ontario average. Significantly, many former recipients continued to experience financial difficulties and economic hardships post-welfare. Approximately 16 per cent had returned to assistance at the time of the survey, less than a year after leaving (City of Toronto, 2002; Lightman et al., Reference Lightman, Mitchell and Herd2005).
Research questions
In this article, we attempt to answer a number of specific research questions concerning the welfare-to-work transition among people who were in receipt of social assistance in Canada at some time during 1996. We begin by examining the sample characteristics, comparing those in receipt of assistance in 1996 to those in the overall population not in receipt. We describe changes over time in family composition or educational level, both of which are potentially important determinants of personal mobility. We then study mobility on and off assistance over time, looking at the numbers that were and were not able to leave social assistance during the life of the panel. Also relevant are the numbers that mixed earnings and social assistance during this period. In answering these questions, we examine in some detail changes in both family incomes and in the employment characteristics of the panel over the five-year period (weeks and hours worked, wage levels and so on).
Comparing social assistance recipients and non-recipients, 1996–2001
The sample for this research was drawn from panel 2 of the ongoing Survey of Labour and Income Dynamics (SLID) of Statistics Canada that entered the sample in 1996 and remained in the survey through 2001. Our sample of social assistance recipients (n = 1,825,396 or 6.8 per cent of the total estimated population) was restricted to cases where respondents were either the head or spouse of a census family in 1996, were under age 65 throughout the panel, the census family received social assistance in 1996 in any amountFootnote 2 and respondents were in the SLID sample in both 1996 and 2001.
Demographics
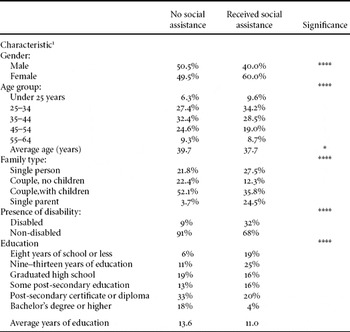
Table 1 contains a number of demographic characteristics for the population of adult social assistance recipients in 1996, compared to non-social assistance recipients. Recipients, compared to non-recipients, tend to be younger, are more likely to be female single parents and to have a disability. They are also more likely to have a limited education: approximately 44 per cent had less than a completed high school education, compared with 17 per cent of the non-recipients.
Population demographics: adult social assistance recipients versus non-recipients, Canada

Notes: 1Differences were tested with t-tests and chi-square statistics with bootstrap variance estimation techniques using the BOOTVAR program and bootstrap weights supplied by Statistics Canada.
*p < .05.
****p < .0001.
Changes in characteristics, such as marital status or education over the course of the panel, are potentially important dimensions of the post-welfare experience (Frenette and Picot, Reference Frenette and Picot2003). Although not reported in the tables,Footnote 3 in our sample stability was the norm for both single-person families and couple families: 81 per cent and 83 per cent respectively of those who began the period in either of these two categories (in 1996) had the same family type at the end of the panel. By contrast, only 58 per cent of those who began as a lone parent in 1996 had remained a lone parent by 2001. Just over one quarter (26 per cent) had become part of a couple family, while 17 per cent had become single-person families.Footnote 4
Another important characteristic that may change over time is education. Social assistance recipients were significantly more likely than non-recipients to engage in formal educational upgrading: approximately one-third of the former group upgraded their education over the course of the panel, by 0.4 years on average, compared to just one-quarter of the non-recipients, who upgraded by half that rate.Footnote 5
However, the beneficiaries of tended to be those with higher formal education to start with, and thus the benefits appear not to have flowed to those with the greatest deficits in human capital. Recipients who participated in formal education had an average of 12.1 years of education, compared with 10.6 years among those who did not participate. Over half (58 per cent) of those recipients who participated in some form of education upgrading already had at least some post-secondary education or a post-secondary certificate/diploma, while only 32 per cent of those who did not upgrade had achieved these levels.
Mobility on and off assistance
The research problem, as originally conceived, was to examine the employment characteristics of people whose families left social assistance and entered the labour market. However, an examination of the data revealed a picture that was more complex: rather than immediate and complete breaks with the social assistance system, it may be more accurate to think in terms of gradual transitions from social assistance, reversals and the mixing of the worlds of work and welfare.
By definition, all respondents in our data set were in families that received at least some social assistance in 1996. In 1997, in principle the first full year in which a member of this population could ‘exit’ social assistance, 18 per cent, or nearly one in five, did so, leaving 82 per cent who received some social assistance in both years.Footnote 6 The proportion of respondents whose families received social assistance continued to decline throughout the five years, so that by the final year of the panel 48 per cent of respondents reported receiving any social assistance. Indeed, by year 4 of the panel, less than half the original group (49 per cent) were still in receipt of benefits.
A more complex picture emerges when year-to-year transitions are examined. This is important because it gives us detailed information on the cycling onto and off social assistance each year.
Of the 1.8 million adults originally on social assistance in 1996, nearly 825,000 (nearly 46 per cent) were on assistance in both 1996 and 2001, but only about 40 per cent, were on social assistance continuously, each year of the panel. A further 9 per cent left assistance and returned at least once during the five years of the panel, and were on the system in both the first and last year. Thus, just under one in ten of the social assistance caseload in 1996 could be expected to leave and return, at least once, during a subsequent five-year period, while being on the system in both the first and last years. The fact that over a third of the sample (38 per cent) was on assistance continuously throughout the time period suggests that there is a clearly identifiable permanently excluded ‘underclass’, although whether this constitutes a ‘substantial’ or a ‘significant’ portion of the caseload remains debatable.
There were relatively few cases of multiple transitions on and off assistance. Some 11 per cent of those who received social assistance in 1996 had at least one subsequent return to social assistance following a year with no social assistance income, and only 0.6 per cent had two or more later returns. Conversely, 60 per cent had at least one exit from social assistance (defined as a full year with no social assistance income) and 4.4 per cent had two or more such exits.
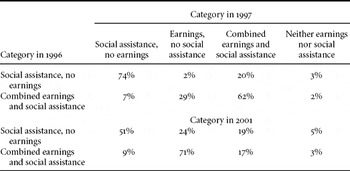
Using a fourfold categorisation of social assistance (yes/no) and earnings (yes/no), Table 2 shows one- and five-year movements among these categories for those people who were in families that received social assistance in 1996. Among the group who received social assistance, with no earnings in 1996, nearly three quarters (74 per cent) were in the same category a year later. By 2001, this figure had dropped to 51 per cent.Footnote 7 In other words, just over half the original population remained on social assistance five years later, while the remaining 48 per cent secured some or most of their income from earnings.
One year and five year transitions. Canada, adult social assistance recipients in 1996

Notes: p < 0.0001. Differences were tested with chi-square statistics with bootstrap variance estimation techniques using the BOOTVAR program and bootstrap weights supplied by Statistics Canada.
Of those in receipt of social assistance without earnings in 1996, fully 20 per cent had incomes from combined earnings and social assistance a year later. That fraction remained relatively constant in 2001. However, those who had earnings and no assistance grew from 2 per cent in 1997 to nearly one-quarter by 2001.Footnote 8
Over one-half of those with social assistance income in 1996 had at least some earnings as well. Among this group, the transitions were even more dramatic: after one year 29 per cent had no social assistance income, and after five years fully 71 per cent received their incomes from labour market earnings without social assistance.
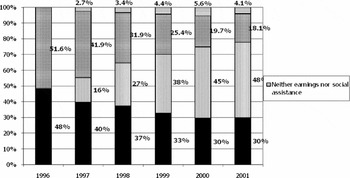
There are clear and consistent trends over time in people's movements from social assistance to the paid labour market. Figure 1 shows that in the initial year of the panel a slight majority (52 per cent) of social assistance recipients reported receiving income from both earnings and social assistance, with the remaining 48 per cent reporting social assistance income but no earnings. In each succeeding year of the panel, the proportion of those with social assistance but no earnings fell steadily until it reached 30 per cent in 2001. The number who made the break entirely to the paid labour market, with no social assistance income, grew from 16 per cent after one year (1997) to nearly one-half (48 per cent) by 2001. The group combining work and social assistance income declined over time, from the 53 per cent observed in 1996 to 18 per cent in 2001, implying perhaps a transitional state en route to an earnings-only status.
Earnings and social assistance 1996–2001, Canada, social assistance recipients in 1996.

Hours of work, work experience, wages and earnings
In this section, we explore key aspects of the employment of social assistance recipients, to see if employment among former recipients allows them, over time, to come closer to the mainstream of the labour market. As we have seen, many social assistance recipients enter the paid labour market with significant handicaps in terms of human capital. In most respects – paid jobs held, hours worked, wage and earnings levels – there was steady improvement in the employment situation of the social assistance recipients over the five years from 1996 to 2001. At the same time, there are indications of difficulties within this group in escaping the instability and precariousness increasingly associated with the Canadian labour market, improving their relative position, closing the gap with the non-recipients and entering the core labour market (Johnson and Morissette, Reference Johnson and Morissette2005; Saunders, Reference Saunders2003).
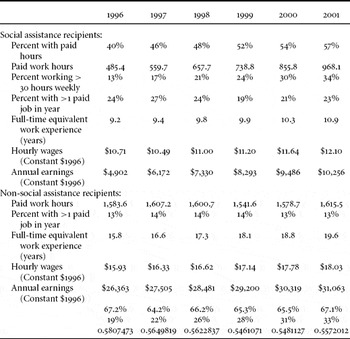
Among those on assistance in 1996, there was a consistent increase in the number reporting at least some work hours in each year, up from 40 per cent of the sample in 1996 to 57 per cent in 2001. The proportion who worked more than 30 hours per week – essentially the threshold for full-time work – grew substantially from 13 per cent in 1996 to 34 per cent in 2001; the proportion working part-time only (fewer than 30 hours) fell from 27 per cent to 23 per cent. Some evidence of employment instability, however, appears in the share of the total panel holding two or more different jobs during the year, which rose by half – from 8 per cent in 1996 to 12 per cent by 2001.Footnote 9
Table 3 shows the patterns of total paid work hours, full-time equivalent work experience, hourly wages and annual earnings of social assistance recipients compared with the non-recipients. At the beginning of the panel, social assistance recipients were working less than one-third of the annual hours of the non-recipients (485 versus 1,584). By the conclusion of the panel, the fraction had risen to 60 per cent (968 versus 1,615).Footnote 10
Job characteristics, social assistance recipients versus non-recipients, Canada 1996–2001

Hourly wages tend to be low among this population, with only modest wage progression among former recipients (Lightman et al., Reference Lightman, Mitchell and Herd2005; Mitchell et al., Reference Mitchell, Lightman and Herd2007). Recipients began the panel in 1996 with real hourly wages of $10.71; that declined slightly in 1997, rising steadily thereafter to reach $12.10 in 2001, for a real wage gain of 13 per cent (all dollar figures are adjusted for inflation to 1996 dollars). However, over the same period the adult non-recipients also experienced real wage gains, rising from $15.93 in 1996 to $18.03 in 2001, for a real wage gain slightly greater than 13 per cent. Thus, the ratio of the real wages of recipients and non-recipients remained essentially unchanged over this five-year period.
Among the recipients who worked in 1996, reported total earnings were $4,902 in 1996, rising to $10,256 in 2001, an increase of just over 100 per cent. Non-recipients reported earnings of $26,363 in 1996, rising to $31,063 in 2001, an increase of 18 per cent; all figures are in real (1996) dollars. While the annual earnings of the recipients were less than 20 per cent of those of the non-recipients in 1996, they grew rapidly, so that by 2001 recipients’ earnings were one-third those of the non-recipients – still low in relative terms, but growing rapidly. As the relative hourly wages of the social assistance recipients did not grow, their relative earnings gains were due entirely to the additional hours worked.
The gap in accumulated work experience actually continued to widen over the period. The social assistance recipients began the period with 9.2 years of accumulated work experience, approximately 58 per cent of the 15.8 years of non-recipients. Despite the near doubling of work hours among recipients, over-representation of part-time workers and the unemployed meant the group ended in 2001 with only 10.9 years of full-time work experience, approximately 55 per cent of the years among non-recipients.
Discussion and conclusion
Welfare-to-work policy in Canada, and indeed among many western industrialised countries, evolved in the 1980s and 1990s in response to rapidly restructuring labour markets with a shift from ‘passive’ welfare-to-work measures to more ‘active’ approaches. While measures adopted under the banner of ‘active labour market policy’ vary considerably, Canada, like other western economies, moved quickly towards ‘work-first’ approaches, with a greater priority placed upon rapid labour force attachment through mandatory participation in job search and related activities.
Implicit in this approach is the assumption that human capital development within the labour market through direct job experience will contribute to subsequent upward labour market mobility. To a large extent, this belief is predicated on a post-war model of the roles of the labour market and social policy, with a sharp demarcation between the world of welfare and the world of work (Dean, Reference Dean2003). However, such a demarcation, if it was ever relevant, is no longer accurate in a world of globalised production and flexible labour markets. Our data have shown that (only) 38 per cent of those on assistance in 1996 remained in that status for each of the succeeding five years.
Smooth and sustained transitions from welfare to work, as envisioned by work-first models, are not the norm in practice. Instead, the research suggests that, for many, it is more accurate to think about gradual transitions, with periodic returns and mixing of welfare and work. This is particularly true once work-first programmes remove the most readily employable from the caseload.
Our findings show that those leaving social assistance in Canada, as elsewhere, enter a world of precarious and low-paid work. Welfare cycling is significant. Their job characteristics are significantly worse than non-social assistance recipients: they earn lower wages, work fewer hours, and consequently have lower annual earnings. Over time the gap between the social assistance recipients and non-recipients narrowed, in terms of hours worked and annual earnings, but remained significant, even at the end of six years.
Relative hourly wage gains were effectively zero, with recipients beginning and ending the panel earning approximately the same proportion of the hourly wages of non-recipients. Achieving benefits from human capital accumulation depends on closing the gap with the rest of the labour market, but the reverse appears to have happened. The gap in accumulated work experience actually widened over time, and gains in formal education flowed to those already relatively advantaged.
The results suggest that there is substantial difficulty in moving from the periphery to the core labour market for those exiting social assistance. And at the end of six years, most social assistance recipients had not made substantial strides towards the mainstream.
Welfare-to-work policies that emphasise rapid labour market entry assume that more secure positions in the labour market will follow from the human capital that is built as a consequence of additional work experience. Our results suggest limitations to this approach among people leaving social assistance. Where further education is made available to people on social assistance in Canada, it tends to be limited to basic skills and high school equivalency. It may be the case that the deficits in human capital are too great to overcome without more substantial formal investments.
As the limits of work-first models have become increasingly evident internationally through the last decade, the attention of policy-makers internationally has shifted to emphasise the need for more and better jobs, especially for those currently disadvantaged in the labour market and disproportionately affected by unemployment (OECD, 2006, 2008). One result is the emergence of ‘mixed models’ that focus on employment but also recognise the need for significant pre- and post-employment investments to prevent subsequent returns to welfare (Herd, Reference Herd2006). So, for example, there is growing awareness of the need for retention and advancement supports that help former welfare recipients retain employment and advance to better jobs once in the labour market (Holzer and Martinson, Reference Holzer and Martinson2005; Lewis et al., Reference Lewis, Corden, Dillon, Hill, Kellard, Sainsbury and Thornton2005; Meadows, Reference Meadows2008; National Audit Office, 2007; Riccio et al., Reference Riccio, Bewley, Campbell-Barr, Dorsett, Hamilton, Hoggart, Marsh, Miller, Ray and Vegeris2008).
Central to this new approach is the need for more individualised and flexible supports, something which stands in stark contrast to the philosophy and practice of work-first reforms. Fundamentally, this means recognising that there is no ‘one size fits all’: effective interventions must be personalised and must take into account the starting point of each individual, and through personalised assessments identify individually tailored and integrated supports (Hirst et al., Reference Hirst, Tarling, Lefaucheux, Short, Rinne, McGregor, Glass, Evans and Simm2006; IPPR, 2008; Meadows, Reference Meadows2008; Walker and Greenberg, Reference Walker, Greenberg, Cebulla, Ashworth, Greenberg and Walker2005).
To some extent, such trends have also played out across Canada. A number of federal–provincial labour market agreements have not only provided significant new resources, but also opportunities to align employment services and to increase access for individuals living on low incomes. At the same time, many provinces have re-examined the ‘pure’ work-first strategies adopted after the introduction of CHST. In Ontario, for example, the election of a new provincial government in 2003 led to an acknowledgement that the work-first approach was failing to help people into sustained employment (Matthews, Reference Matthews2004). The report stressed the need to remove barriers and disincentives to work and to introduce a wide range of individual supports. The provincial government has subsequently taken some concrete steps towards this new vision, including eliminating punitive rules such as deferred eligibility to those who quit their job or were fired. Most significantly, this turnaround is evidenced by the introduction in 2008 of a $1.4 billion Poverty Reduction Strategy, which included a commitment to a wide-ranging review of social assistance rules and practices. Such changes are leading to more and different employment services and new delivery models (see, for example, City of Toronto, 2008).
That said, the opportunities for longer-term training and skills development remain limited. In practice, for those without significant human capital deficits, who have recent work experience and face no obvious employment disadvantage, the provision of temporary financial supports is likely sufficient. For many of these individuals work-first reforms at best apply additional pressure in support of the goals they will achieve anyway. At worst, they act as a grossly ineffective labour market adjustment mechanism, as people are pushed to accept the first available job, when a better match is likely possible, given more time.
For those who are more ‘distant’ and require greater supports, this means access to a broad array of job preparation and placement options, combined with seamless in-work benefits and supports. For some, the individualised path away from welfare will include education and training which moves beyond a focus on basic education and soft skills training to post-secondary education and specific skills training. For others, this means better recognition of physical and mental health, housing, childcare and other barriers that need to be addressed before they can realistically engage with the labour market in anything other than a marginal way.
Finally, for those who have fared least well under work-first reforms, the most marginalised, there needs to be greater understanding that the labour market is an unlikely – and unsuitable – destination, and greater financial security, stability and support are necessary to assist them.