Introduction
In the past decade, there has been increasing interest in investigating neuropsychological profiles in anorexia nervosa (AN) (Roberts, Tchanturia, Stahl, Southgate, & Treasure, Reference Roberts, Tchanturia, Stahl, Southgate and Treasure2007; Tchanturia, Campbell, Morris, & Treasure, Reference Tchanturia, Campbell, Morris and Treasure2005). These profiles have been studied using neuropsychological paradigms reporting weak central coherence (Lopez, Tchanturia, Stahl, & Treasure, Reference Lopez, Tchanturia, Stahl and Treasure2008) and poor set-shifting (Roberts, Tchanturia, & Treasure, Reference Roberts, Tchanturia and Treasure2010). In particular, set-shifting, a major component of cognitive flexibility (Tchanturia et al., Reference Tchanturia, Campbell, Morris and Treasure2005), involves the ability to disengage from an irrelevant task set and actively engage with a relevant task set. Assessing this component of cognitive flexibility is important in AN as it has been implicated as a possible maintaining factor and an endophenotype in AN (Holliday, Tchanturia, Landau, Collier, & Treasure, Reference Holliday, Tchanturia, Landau, Collier and Treasure2005; Roberts et al., Reference Roberts, Tchanturia and Treasure2010; Tenconi et al., Reference Tenconi, Santonastaso, Degortes, Bosello, Titton, Mapelli and Favaro2010).
Present research on cognitive flexibility in AN primarily consists of experimental/performance measures using various tests including the Brixton Spatial Anticipation Test (Holliday et al., Reference Holliday, Tchanturia, Landau, Collier and Treasure2005; Roberts et al., Reference Roberts, Tchanturia, Stahl, Southgate and Treasure2007, Reference Roberts, Tchanturia and Treasure2010; Tchanturia et al., Reference Tchanturia, Brecelj, Sanchez, Morris, Rabe-Hesketh and Treasure2004). However, no published research in eating disorders has investigated whether self-report and experimental measures are equivalent.
It is generally accepted that experimental testing provides the most accurate profile; however, it can also be argued that self-report measures are more ecologically valid assessments compared with laboratory-based measures. Furthermore, as experimental measures are costly to implement in research and clinical units, should self-report and experimental measures be equivalent, the former could be a time- and cost-effective alternative. Previous research has also reported that clinicians tend to overestimate the correspondence between cognitive self-report and experimental measures (Spencer, Drag, Walker, & Bieliauskas, Reference Spencer, Drag, Walker and Bieliauskas2010). With these points in mind, it was of interest to investigate the correspondence between cognitive self-report and experimental measures.
Studies have reported poor correspondence between self-reports and neuropsychological cognitive tests in disorders such as in substance abuse (Horner, Harvey, & Denier, Reference Horner, Harvey and Denier1999), euthymic bipolar disorder (Martinez-Aran et al., Reference Martinez-Aran, Vieta, Colom, Torrent, Reinares, Goikolea and Sanchez-Moreno2005), and schizophrenia (Medalia, Thysen, & Freilich, Reference Medalia, Thysen and Freilich2008). This lack of correlation often relates to measures of depression, anxiety, and post traumatic stress disorder (PTSD) (Burdick, Endick, & Goldberg, Reference Burdick, Endick and Goldberg2005; Errico, Nixon, Parsons, & Tassey, Reference Errico, Nixon, Parsons and Tassey1990; Farrin, Hull, Unwin, Wykes, & David, Reference Farrin, Hull, Unwin, Wykes and David2003; Horner et al., Reference Horner, Harvey and Denier1999). Affective distress and mood for instance have been found to impact self-report due to negative self-concepts (Binder, Storzbach, Anger, Campbell, Rohlman, et al., Reference Binder, Storzbach, Anger, Campbell and Rohlman1999; Chamelian & Feinstein, Reference Chamelian and Feinstein2006). Similarly, the level of insight into illness may also bias cognitive self-reporting (Moritz, Ferahli, & Naber, Reference Moritz, Ferahli and Naber2004) as a link between impaired set-shifting and poor insight has been found in AN (Konstantakopoulos, Tchanturia, Surguladze, & David, Reference Konstantakopoulos, Tchanturia, Surguladze and David2011). It is therefore important to determine whether self-reporting corresponds with results of cognitive performance.
Based on the above, the aim of this investigation was to assess the correspondence between the self-report and experimental measures. In line with previous research, it was predicted that AN patients would perform poorly on the set-shifting task and self-report low levels of cognitive flexibility, whereas the healthy controls (HCs) would perform well on the task and self-report high levels of flexibility.
Method
In line with the ethical standards laid down in the 1964 Declaration of Helsinki, this study had received approval from the ethical committee of the South London and Maudsley (SLaM) NHS Foundation Trust. All participants gave their informed consent before their inclusion in the study.
The sample consisted of 99 participants: 46 patients with AN and 53 HCs. All participants were female, aged between 18 and 55 years and spoke English as their first language. Individuals with AN were recruited from an Eating Disorders inpatient unit (South London and Maudsley NHS Foundation Trust) and were diagnosed by experienced clinicians (according to DSM-IV diagnostic criteria). In the AN group, 58.5% had Anorexia Nervosa – Restricting Type and 41.5% had the Binge-Purge subtype. The mean duration of illness for this group was 11.9 years. HCs were recruited via advertisements in the local community.
The exclusion criteria included history of neurological problems and past or present psychiatric morbidity, with the exception of AN in the clinical sample. HCs were pre-screened and 4 were excluded (3 for abnormal eating behaviors; 1 for PTSD). These participants were not included in the data analysis.
Self-report Measures
The Cognitive Flexibility Scale (CFS) (Martin & Rubin, Reference Martin and Rubin1995) was used to measure cognitive flexibility. The scale consists of 12 items (6-point Likert scale: 1 = strongly disagree to 6 = strongly agree) and measures three components of cognitive flexibility: (1) awareness of options, (2) willingness to be flexible, and (3) self-efficacy in being flexible. Total scores on the CFS range from 0 to 72, where 72 signifies superior cognitive flexibility. This measure has high internal reliability and construct and concurrent validity (Martin & Rubin, Reference Martin and Rubin1995).
The Eating Disorder Examination Questionnaire (EDE-Q) (Fairburn & Beglin, Reference Fairburn and Beglin1994) was used to assess patterns of disturbed eating behavior and the Hospital Anxiety and Depression Scale (HADS; Zigmond & Snaith, Reference Zigmond and Snaith1983) assessed current anxiety and depression. Both questionnaires have good internal consistency (Luce & Crowther, Reference Luce and Crowther1999; Mykletun, Stordal, & Dahl, Reference Mykletun, Stordal and Dahl2001).
Performance Assessment
The Brixton Spatial Anticipation Test (Burgess & Shallice, Reference Burgess and Shallice1997) is a test of concept formation and assesses the ability to recognize a rule that accounts for pattern variations from item to item (Lezak, Howieson, & Loring, Reference Lezak, Howieson and Loring2004). Participants must predict the movement of a blue circle which changes location after each response across a 5 × 2 grid. There are 56 trials in total and no time limit for completion. The number of incorrect predictions is used as a measure of set-shifting ability: the lower the total numbers of errors, the higher the set shifting ability.
In this study, a semi-computerized version of the Brixton Test was used: trials were presented on a computer screen while the experimenter recorded responses and pressed a computer key to move on to the next trial. The original instructions and scoring sheets (Burgess & Shallice, Reference Burgess and Shallice1997) were used.
Statistical Methods
An analysis of outliers, which was established as scores deviating by ±3 standard deviations (SD) (Tabachnick & Fidell, Reference Tabachnick and Fidell2007), led to the exclusion of 5 participants (5.05%) from the initial data set of 46 AN and 53 HC. In the AN group, one participant was excluded due to the CFS score. In the HC group, one participant was excluded due to the CFS score and 3 were excluded due to Brixton Test scores. The final data set, therefore, consisted of 45 AN and 49 HCs.
There was also data missing for the HADS questionnaire (AN = 7; HC = 3). The analyses involving the HADS depression and anxiety subscales were therefore performed using the data of 38 AN and 46 HCs.
Assumptions of normal distribution were explored using the Kolmogorov-Smirnov test: Brixton error scores (both groups) and CFS scores (AN group) were not normally distributed therefore a log transformation was applied to all data. All subsequent analyses were conducted on log transformed data such as t tests, Pearson's correlations, multivariate analysis of covariance (MANCOVA). The alpha level was set at .05 for all analyses.
Results
Demographic Data
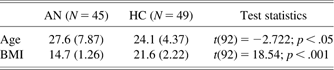
The participants’ mean age and Body Mass Index (BMI) are presented in Table 1. There were between-group differences in age [t(92) = −2.72, p < .05] and, as expected, in BMI [t (92) = 18.54; p < .001]. The AN group had a higher mean age (AN = 27.6; HC = 24.1) and lower BMI (AN = 14.7; HC = 21.6) compared with HCs.
Demographic characteristics of the AN and HC groups

Note. AN = anorexia nervosa; HC = health control; BMI = body mass index.
Self-report and Experimental Data
Between-group analyses on the CFS and Brixton Test scores are presented in Table 2. There were between group differences in the CFS total scores (t(92) = 8.26; p < .001) and the Brixton Test total number of errors (t(92) = −2.35; p < .05). The AN group had lower scores on the CFS (AN = 45.4; HC = 58.8) and a greater number of errors on the Brixton Test (AN = 13.1; HC = 11) compared with HCs.
CFS and Brixton Test scores for the AN and HC groups

Note. CFS = Cognitive Flexibility Scale; AN = anorexia nervosa; HC = health control.
As for the HADS scores, the AN group had higher scores compared with the HC group in both the depression subscale [AN = 13.8 (4.6); HC = 5.5 (2.7)] and the anxiety subscale [AN = 14.5 (5.3); HC = 2.5 (5.5)].
The Pearson correlation coefficient showed no significant correlations between the CFS and Brixton Test for both the AN (r = .06; p > .05) and HC (r = −.01; p > .05) groups.
A significant negative correlation was found between the CFS and the HADS depression subscale for the AN group (r = −.379; p < .05) but not the HCs (r = −.146; p > .05. There were no significant correlations between the CFS and HADS anxiety subscale scores for both AN (r = −.277; p > .05) and HCs (r = −.182; p > .05). Furthermore, there were no significant correlations found between the Brixton Test errors and the HADS depression and anxiety subscales scores for both AN (r = .130; p > .05; r = .143; p > .05) and HCs (r = .049; p > .05; r = −.093; p > .05), respectively.
Analysis of Confounding Variables
In light of the significant group differences in age and the correlation between depression scores and CFS scores, a MANCOVA was conducted on the entire sample to adjust for age and depression as covariates on CFS scores and Brixton Test errors. The MANCOVA revealed that after controlling for the effect of age and HADS depression score, group differences in CFS scores remained highly significant [F(1,80) = 29.66; p < .001]. For the CFS scores, the HADS depression score was a significant co-variate [F(1,80) = 5.57; p < .05] and may have influenced group differences had it not been controlled for. Age on the other hand was not a significant co-variate [(F(1,80) = 2.95; p > .05].
For the Brixton Test errors, after controlling for age and HADS depression score, it was found that the main effect of group did not remain significant [F(1,80) = .857; p > .05]. For the Brixton Test errors, age was found to be a significant co-variate [(F(1,80) = 6.44; p < .05], whereas HADS depression scores were not [(F(1,80) = .007; p > .05].
To further explore the relationship between age and Brixton Test errors, the parameter estimates in the MANCOVA analysis were conducted. It was found that B = .006 for age which was statistically significant (p < .05) for Brixton Test errors. This suggests an increase in the rate of Brixton test errors by .006 with every unit (i.e., year) increase in age.
Discussion
This study investigated the correspondence between self-report and experimental measures of cognitive flexibility in AN and HCs to elucidate the relationship between the two and to assess whether self-report can be used as a sole measure of cognitive flexibility.
In line with previous findings (Roberts et al., Reference Roberts, Tchanturia, Stahl, Southgate and Treasure2007; Tchanturia et al., Reference Tchanturia, Brecelj, Sanchez, Morris, Rabe-Hesketh and Treasure2004, Reference Tchanturia, Campbell, Morris and Treasure2005), the AN group performed significantly poorly on both self-report and cognitive measures of cognitive flexibility.
Correlation analyses revealed no correspondence between the self-report and experimental measures in both groups. This suggests that these two measures may tap into different aspects of cognition. It seems that the Brixton Test assesses cognitive flexibility as task errors were not associated with anxiety or depression for both groups. However, for the AN group lower scores on the CFS were correlated with higher scores of depression. These findings support previous research suggesting that mood and affective distress are closely related to self-report measures (Binder et al., Reference Binder, Storzbach, Anger, Campbell and Rohlman1999; Chamelian & Feinstein, Reference Chamelian and Feinstein2006). Depression is often comorbid with AN (Geller et al., Reference Geller, Johnston, Madsen, Goldner, Remick and Birmingham1998), mood and affective distress may therefore alter self-report scores.
A further exploration of the effect of depression however showed that group differences on CFS scores remained significant after controlling for depression. This suggests that depression only partially accounts for the group differences on CFS scores. Therefore, CFS scores cannot be explained by depression scores alone. As such, poor insight may be another contributing factor. This may be a useful variable for exploration in future research.
Moreover, age was found to impact Brixton Test errors. With an increase in age there was an increase in the number of errors on the Brixton Test for the entire sample. This pattern suggests poorer cognitive flexibility on neuropsychological tests with increasing age for both AN and HC groups. Of interest, however, such a pattern was not detected for CFS scores. A further exploration of the effect of age on Brixton Test errors and CFS scores was beyond the scope of this brief report. However, the results of our study suggest that age is an important variable for consideration when using neuropsychological tests in assessing cognitive flexibility. It may be interesting to further explore why age does not have a similar effect on self-report measures of cognitive flexibility.
Conclusion
The poor correspondence between the self-report and experimental measures suggests that the CFS cannot be used as an alternative to the Brixton Test in AN. Self-report could however be useful in informing about patients’ perceived levels of cognitive flexibility and therefore a useful complimentary measure.
Acknowledgments
This report presents independent research commissioned by the National Institute for Health Research (NIHR) under its Programme Grants scheme (RP-PG-0606-1043). The views expressed in this publication are those of the author(s) and not necessarily those of the NHS, the NIHR or the Department of Health. Dr. Tchanturia thanks BIAL foundation (grant number 5710) for their continued support. The information in this manuscript has never been published either electronically or in print. Conflict of interest: none.