Introduction
Direct democracy mechanisms, such as ballot initiatives and referendums, are often portrayed as grassroots processes driven by the policy preferences and participation of ordinary citizens within a state (Smith and Tolbert Reference Smith and Tolbert2007). In principle, direct democracy should enhance democratic governance by providing an avenue for citizens to directly shape policy outcomes by bypassing the legislative process (Matsusaka Reference Matsusaka2020; Piott Reference Piott2003). However, the modern landscape of campaign finance in direct democracy contests presents a different picture. Anecdotal evidence points to the growing influence of out-of-state money in state-level direct democracy elections, with out-of-state donors contributing $3.6 billion to these campaigns between 2006 and 2022.Footnote 1 This influx of out-of-state money raises critical questions about democratic representation and suggests that these processes may be particularly vulnerable to the nationalizing forces reshaping other areas of American politics (Hertel-Fernandez Reference Hertel-Fernandez2019; Hopkins Reference Hopkins2018; Sievert and Mathiasen Reference Sievert and Mathiasen2023).
Understanding who contributes to direct democracy campaigns from outside state borders, and why they do so, is important for several reasons. First, while direct democracy is designed to reflect local preferences, the growing influence of out-of-state money suggests that these processes have become venues for broader policy battles. Second, the relationship between donor and recipient differs markedly from traditional campaign contributions. For example, out-of-state donors cannot hold representatives accountable through future elections or rely on ongoing relationships for policy influence, yet they contribute substantial sums through small-dollar donations focused on particular types of issues. Third, examining these donors’ behavior provides an opportunity to better understand the motivations of an understudied yet increasingly important set of political actors in American democracy, whose giving patterns may reveal new insights about political participation across state lines. As a result, this study addresses two central questions: 1) what characterizes these out-of-state direct democracy contributions? and 2) what could explain why individual donors contribute to direct democracy campaigns in states where they do not live and cannot vote on the policy outcome?
Despite the growing recognition that state policy choices can have cross-border implications, research examining the patterns and dynamics of out-of-state contributions in direct democracy campaigns remains limited. While recent research investigates the donor behavior of both in-state and out-of-state contributors in candidate elections (Gimpel, Lee, and Kaminski Reference Gimpel, Lee and Kaminski2006; Gimpel, Lee, and Pearson-Merkowitz Reference Gimpel, Lee and Pearson-Merkowitz2008; Keena Reference Keena2024), there is a notable absence of similar studies focusing on the nature and extent of out-of-state donations in the context of direct democracy. This puzzle is particularly significant, given how direct democracy fundamentally differs from candidate elections, which dominate the existing literature on the motivations of donors. These patterns cannot be explained by existing theories focused on access, influence, or material benefits. Finally, understanding what motivates these donors and how their involvement shapes state policy outcomes is crucial for evaluating the health of state-level democracy in an era of increasing nationalization.
To address this gap, I leverage an original dataset of contributions to direct democracy campaigns from 2006 to 2022 to examine the trends and characteristics of individual out-of-state contributions. While nonindividual donors, such as unions or corporations, make up a substantial majority of out-of-state contributions, their motivations are theoretically material in nature due to the potential direct impact of these campaigns’ outcomes on their operations or specific goals (Ansolabehere, De Figueiredo, and Snyder Reference Ansolabehere, De Figueiredo and Snyder2003; Barber Reference Barber2016; Barber, Canes-Wrone, and Thrower Reference Barber, Canes-Wrone and Thrower2017). Therefore, they are more likely to share motivations with in-state donors, who see the policy’s outcome as affecting them directly. In contrast, individual out-of-state donors’ motivations for contributing to these campaigns are less clear and thus are the focus of this study.
This article reveals three notable findings. First, out-of-state contributions to direct democracy campaigns have increased steadily over time, with notable spikes in recent election cycles. Second, a majority of these contributions are relatively small, amounting to $100 or less, and are primarily directed toward measures concerning social and moral issues. Third, based on zip code-level income data, the majority of these individual contributions come from areas with lower to middle-income levels, with a significant portion originating from states that lack direct democracy mechanisms of their own.
Drawing on these findings and previous scholarship, I develop a potential theory that individual out-of-state donors to direct democracy campaigns are primarily driven by a combination of ideological and consumption-oriented motivations. The ideological motivation is supported by the disproportionate focus on high-profile social or moral issues, while the consumption-oriented aspect is evident in the small donation amounts and the apparent lack of expectation for direct policy or material benefits. These donors likely derive utility from the act of participating in the political process and expressing their beliefs, even if the outcomes of the ballot measures do not directly affect their lives or communities. In this regard, their contributions can be viewed as a form of political consumption or expressive participation, where the act of donating itself provides intrinsic value to the donor, irrespective of the tangible impact of their contribution on the campaign outcome.
The implications of this study are particularly salient, given recent efforts by states to address contentious policy issues through direct democracy that have been gridlocked at the federal level. Voters in recent years have successfully placed issues such as abortion, recreational drug use, and environmental protections on the ballot, reshaping the policy landscape across the United States.Footnote 2 These findings also highlight concerns about out-of-state funding potentially compromising the integrity and independence of state-level democratic processes, especially as direct democracy becomes an increasingly important alternative to traditional representative politics for resolving divisive issues (Bowler and Donovan Reference Bowler and Donovan2000; Bowler, Donovan, and Tolbert Reference Bowler, Donovan and Tolbert1998).
Out-of-state donors
In recent years, scholars have become increasingly interested in donors who choose to give beyond their own state or district. This scholarship predominantly investigates candidate elections, examining the characteristics of these donors, who and what they contribute to, why they contribute, and the impact of these contributions (Baker Reference Baker2016; Canes-Wrone and Miller Reference Canes-Wrone and Miller2022; Gimpel, Lee, and Kaminski Reference Gimpel, Lee and Kaminski2006; Gimpel, Lee, and Pearson-Merkowitz Reference Gimpel, Lee and Pearson-Merkowitz2008; Grenzke Reference Grenzke1988; Keena Reference Keena2024). As a result, we have learned that these donors may be more ideological or politically sophisticated than those who contribute in-state, or made in the attempt to gain access or “surrogate representation” (Baker Reference Baker2020; Keena Reference Keena2024). These contributions reflect a growing nationalization of campaign finance, in which the political strategies and messaging across states have become increasingly blurred as a result of factors such as polarization and the strategy of political parties (Hertel-Fernandez Reference Hertel-Fernandez2019; Hopkins Reference Hopkins2018; Jacobs and Imboywa Reference Jacobs and Imboywa2024). Similar to the ways that this nationalization challenges the democratic promises of offices like the US House or Senate, it may also be prevalent in other areas of US politics, such as direct democracy. Studies that have approached these questions primarily consist of case studies and legal analyses, which, although valuable, do not provide a comprehensive understanding of the role and characteristics of out-of-state contributions across a wide range of direct democracy campaigns and states (Garry, Nelsen, and Spurlin Reference Garry, Nelsen and Spurlin2010; Shin Reference Shin2009).
Why should we investigate out-of-state donor behavior in direct democracy campaigns? Direct democracy campaigns differ from candidate elections in several unique key ways and, thus, reveal a significant gap in our understanding of out-of-state contributors. First, direct democracy campaigns focus on specific policy issues rather than broader candidate platforms or party affiliations. In most cases, this is by law, in which state constitutions mandate initiatives be single-subject in order to qualify for the ballot (Clark Reference Clark1998). This rule was implemented primarily to limit confusion for those voting on the measure. Further, the effects of direct democracy policies primarily limit themselves to the state where the election occurs, unlike federal candidates whose actions may impact out-of-state donors via nationwide policies. Finally, donors cannot anticipate ongoing relationships or future policy quid pro quo in the same ways that those involved in candidate elections may, as their involvement typically ends at the ballot box (Austen-Smith Reference Austen-Smith1995).
Data and methods
Direct democracy in the United States operates through various mechanisms that allow citizens to directly participate in lawmaking, though the availability and structure of these mechanisms differ across states. A total of 26 states in the United States offer one or more forms of citizen-initiated processes: constitutional initiatives, statutory initiatives, and/or veto referendums. These processes allow voters to propose constitutional amendments, enact new laws, or challenge existing legislation directly through ballot measures. The procedures for qualifying measures for the ballot, the information provided to voters, and judicial review processes also vary widely between states.
This article employs a comprehensive, novel campaign finance dataset encompassing all states with citizen-initiated mechanisms for policy change. Although aggregate contribution amounts are relatively accessible to the public, specific contributor details are not. I compiled campaign contribution data through requests to various Secretary of State’s offices, online scraping, and generous support from Follow the Money and Open Secrets. This information is reported by committees at the state level to filing databases like the Oregon Elections System for Tracking and Reporting and California’s CAL-ACCESS reporting system. These databases compile records encompassing political committee registration, donor information, and financial transaction activity to ensure compliance with state disclosure laws. To the best of my knowledge, this dataset has not been previously utilized for social science research.
This article’s temporal framework begins in 2006 to ensure data consistency and comparability across states. While direct democracy mechanisms have existed in many states for decades, the systematic disclosure of campaign contribution data became more standardized and comprehensive following the implementation of enhanced transparency requirements in the mid-2000s. Prior to 2006, disclosure practices and mandates varied significantly across jurisdictions, with many states lacking robust digital reporting systems or maintaining inconsistent record-keeping standards.
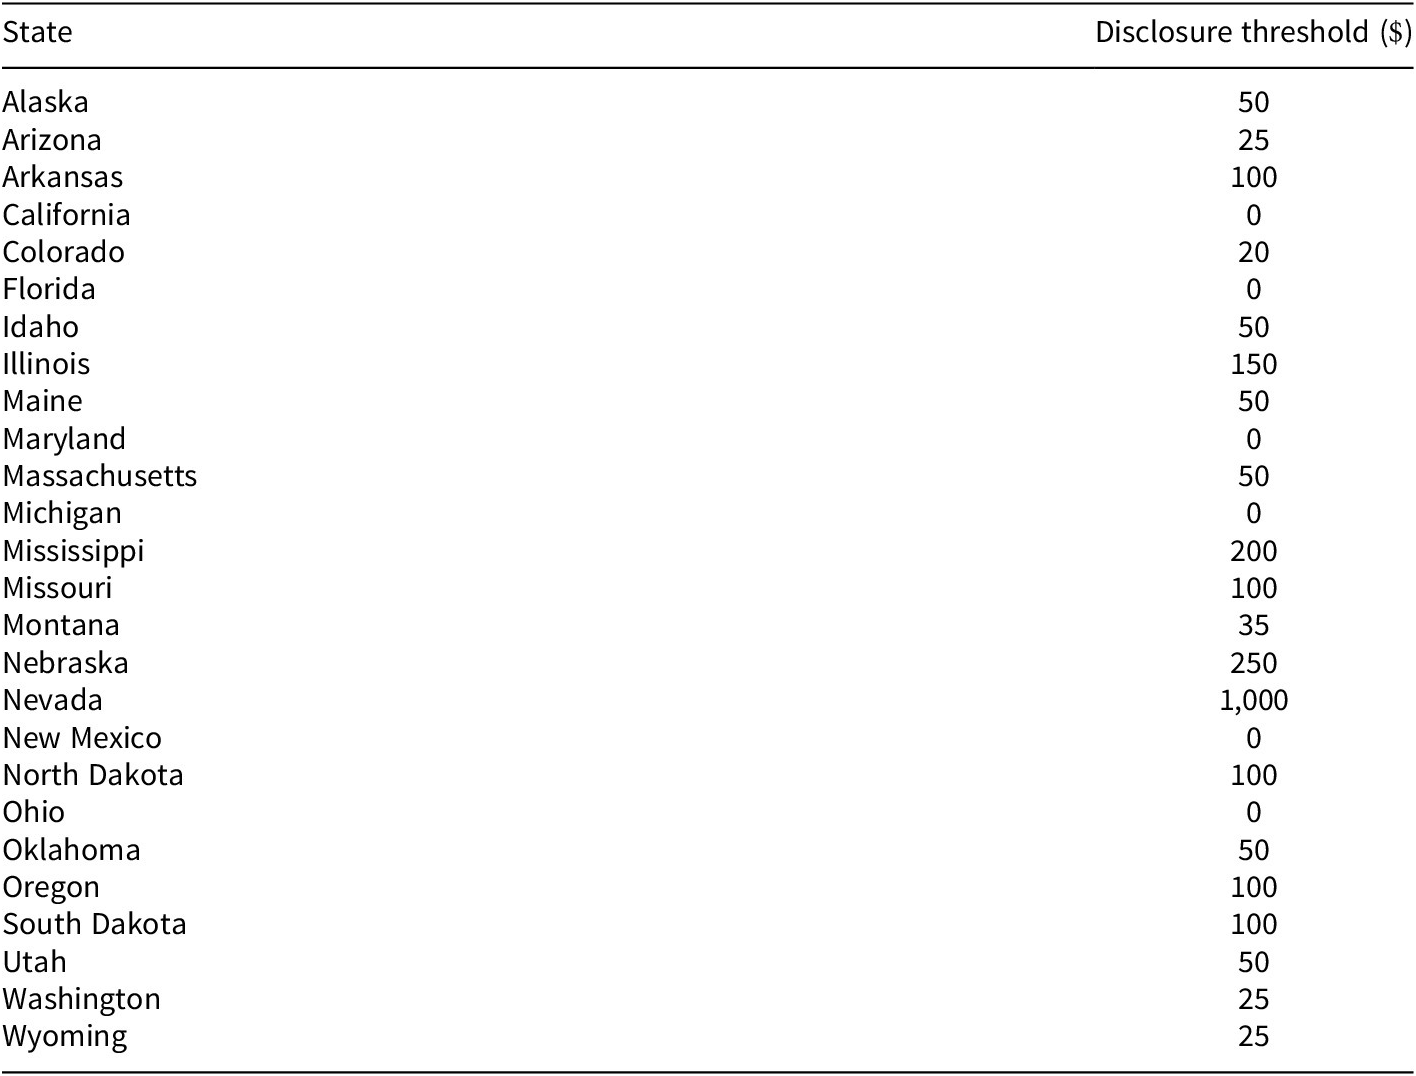
Donations to direct democracy campaigns are channeled through political committees registered in support or opposition to specific measures. These committees raise contributions, both in-kind and in cash, to support their campaign efforts. Disclosure laws mandate that political committees disclose donor information to the public, often including the donor’s name, state of residence, and the donated amount. This requirement is generally consistent across direct democracy states, aiming to enhance transparency in the process (Carpenter Reference Carpenter2009; Garrett and Smith Reference Garrett and Smith2005). However, the thresholds for disclosure differ widely. Disclosure thresholds range from $0 in states like California, Maryland, Michigan, New Mexico, and Ohio to as high as $1,000 in Nevada. This variation in thresholds affects the comprehensiveness of data available across states, with lower thresholds providing greater visibility into small-dollar contributions, which presents some challenges for cross-state comparisons. States with lower thresholds, such as Washington ($25) and Arizona ($25), capture a more detailed picture of donor participation compared with states with higher thresholds, such as Mississippi ($200) or Nebraska ($250). Appendix A provides disclosure thresholds for each direct democracy state.
The resulting database contains information including donor name, location (typically state, but occasionally complete street address), donation amount, the specific direct democracy measure, its policy area, the donor’s status (individual or organization), and whether the donation supported or opposed the measure.
To supplement the contribution data, I collected income data from the American Community Survey (ACS) five-year estimates (2011–2022) at the Zip Code Tabulation Area level, and cleaned it to create a consistent dataset of median household incomes. Due to limited availability for 2006–2010, I imputed data by replicating 2011 values for each zip code. I then compiled a final dataset integrating all years (2006–2022) to facilitate longitudinal analysis of income trends across US zip codes. This approach, while providing broad insights into the economic landscape from which out-of-state contributions emerge, carries several important limitations. First, using zip code median income as a proxy for individual donor income may not accurately reflect actual donor wealth, as zip codes can contain substantial internal income variation, and the median may not represent the specific contributors within that area. Second, the temporal imputation method assumes income stability between 2006 and 2011, which may not account for economic fluctuations during this period, particularly around the 2008 financial crisis. Third, this approach cannot capture individual-level socioeconomic characteristics such as wealth, education, or occupation that may be more relevant to political giving behavior than area-level income measures. Despite these limitations, zip code income data provide the best available proxy for understanding the broader economic context of out-of-state political contributions in the absence of individual-level financial information.
Finally, each contribution in this dataset is categorized by policy type into one of 20 broader areas. The policy types are derived from the schema developed by FollowTheMoney, which initially provided 357 narrow policy categories. To facilitate analysis, these were recoded into 20 comprehensive categories that capture the various policy areas attracting funding from both in-state and out-of-state donors. Two research assistants independently coded a 20% sample of the policy types to ensure reliability, achieving a Krippendorff’s Alpha of 0.91, indicating strong inter-coder consistency. For ballot measures that could reasonably be classified under multiple policy types, the research team assigned each measure to the category that best reflected its primary focus or most prominent feature. This categorization schema groups related subjects together to enable systematic analysis of contribution patterns and trends across different policy domains. The full list of policy categories is provided in Appendix C.
It is crucial to note that, unlike election campaigns for individuals running for office, direct democracy states lack laws limiting campaign spending by groups registered for or against a particular direct democracy policy. Supreme Court cases First National Bank of Boston v. Bellotti 435 U.S. 765 (1978) and Citizens Against Rent Control v. City of Berkeley 454 U.S. 290 (1981) protect against direct democracy campaign finance limits. The absence of contribution limits for direct democracy campaigns allows individuals and organizations to contribute anywhere from a penny to millions of dollars directly to a campaign as many times as they want.
The data at a glance
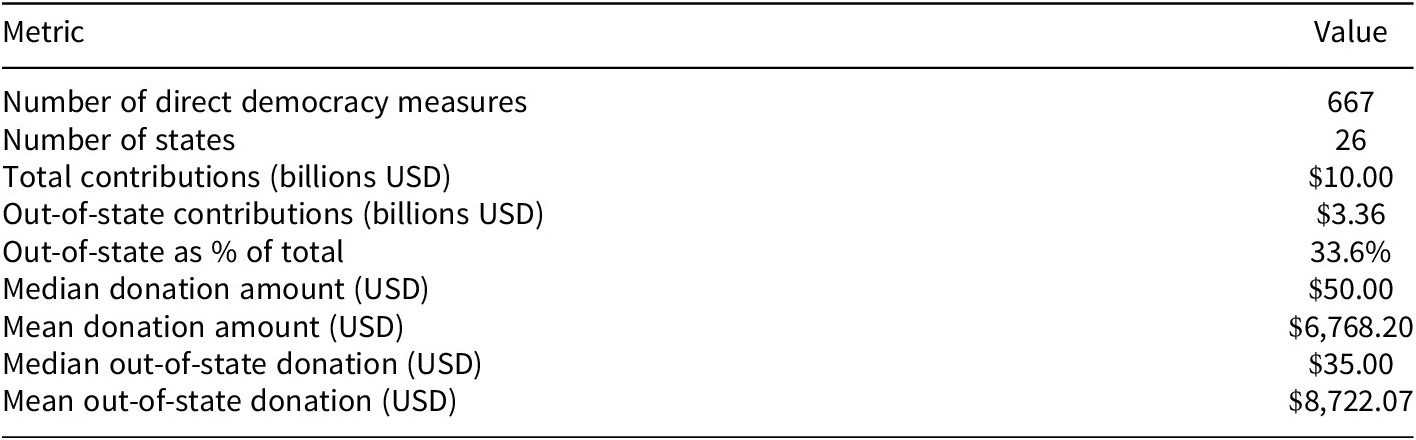
This study analyzes contribution data from 667 unique ballot measures across 26 states, encompassing approximately $10 billion in total contributions. Out-of-state sources account for $3.3 billion of these contributions, representing roughly one-third of the total funding. Summary statistics for the dataset are presented in Table 1. The contribution amounts exhibit a highly skewed distribution, with a median donation of $50 contrasted against a substantially higher mean of approximately $6,700. This asymmetry is even more pronounced for out-of-state contributions, which display a median of $35 and a mean of approximately $8,700. The considerable disparity between median and mean values across both categories reflects the presence of a small number of exceptionally large donors alongside a majority of smaller contributors, consistent with typical patterns observed in political financing literature.
Summary statistics of direct democracy contributions

Additional descriptive statistics are provided in Appendix B, including comprehensive breakdowns of ballot measures and contributions by state, year, and donor geographic origin. The supplementary analysis examines the distribution of measures across jurisdictions, aggregate contribution totals, the proportion of out-of-state funding by state, the range of contribution magnitudes, and notable patterns of interstate funding relationships.
Trends and donor characteristics
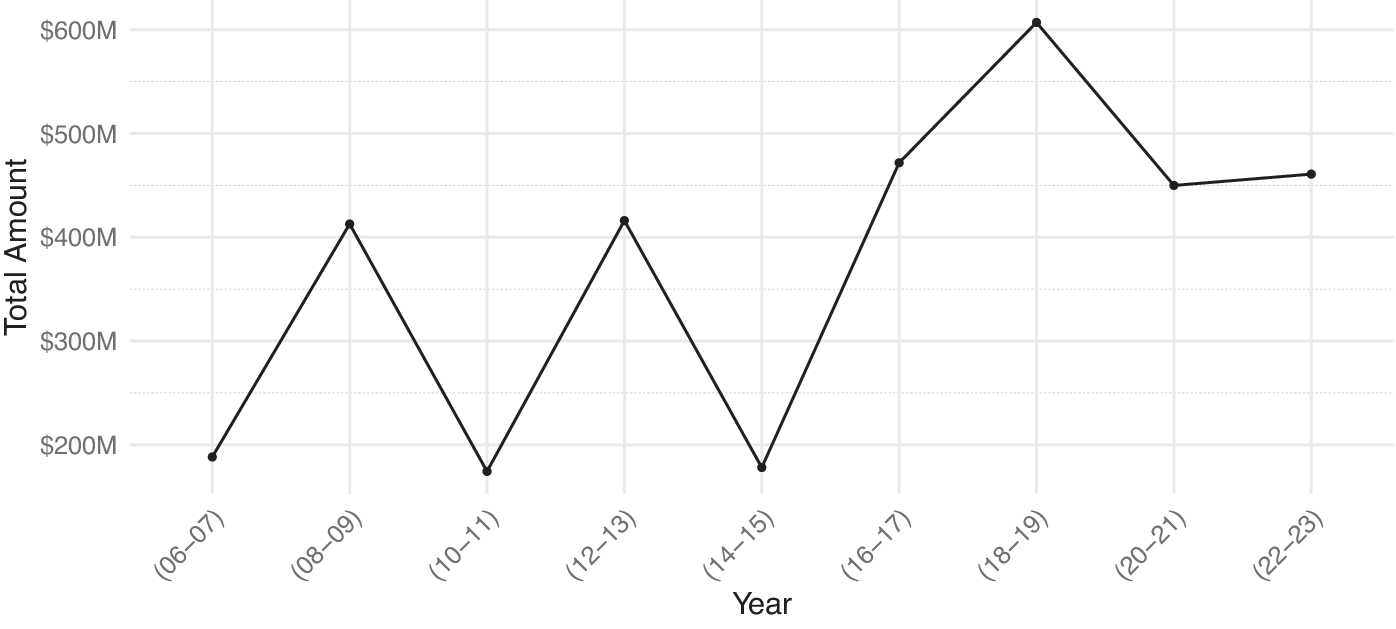
This article’s analysis of out-of-state contributions to direct democracy campaigns from 2006 to 2022 reveals several key trends and characteristics. Figure 1 illustrates the overall growth in out-of-state contributions, with total amounts more than doubling from approximately $200 million in 2006–2007 to almost $500 million in 2022–2023. This substantial increase suggests a growing involvement of out-of-state actors in state-level policy debates through direct democracy mechanisms.
Overall trends of out-of-state contributions, 2006–2022. The graph illustrates the increasing trajectory of total contributions over time, with notable fluctuations during election years.

There is a notable increase in contributions during presidential election years. As highlighted by works such as Sarah Anzia’s Timing and Turnout: How Off-Cycle Elections Favor Organized Groups, this can mostly be attributed to factors related to election timing. First, presidential elections generate heightened political engagement nationwide, creating an environment where donors are more attentive to all forms of political participation. Second, these cycles feature higher voter turnout, making them strategically valuable for advancing policy objectives through direct democracy. Third, national advocacy organizations often mobilize their donor networks more aggressively during these periods (Anzia Reference Anzia2013). Finally, and from a more procedural perspective, many states have regulations requiring ballot measures to appear during general elections. Washington, for instance, requires constitutional amendments at general elections, while states like Florida and Michigan permit special elections only through supermajority votes (Boldt Reference Boldt2023). In sum, even in states with flexibility, the high-profile nature and increased turnout of presidential elections make them attractive for placing important measures before voters.
The substantial increase in out-of-state contributions to direct democracy campaigns from 2006 to 2022 could also be an indication of alignment with broader trends of nationalization in American politics (Hopkins Reference Hopkins2018). This pattern mirrors similar developments in candidate elections, particularly US Senate races, where out-of-state donations have grown increasingly prevalent. Senators, especially those with more conservative ideologies, have become more dependent on funding sources beyond their state borders over time (Jacobs and Imboywa Reference Jacobs and Imboywa2024). This shift extends beyond mere partisanship, as both Democratic and Republican senators have seen a marked increase in out-of-state fundraising since 2008. The nationalization of campaign finance in Senate races reflects larger changes in American federalism, including the decline of state party autonomy and the rise of national partisan cleavages (Pierson and Schickler Reference Pierson and Schickler2020). While direct democracy campaigns differ in their focus on specific policy issues rather than candidate platforms, the growing influx of out-of-state money in both contexts suggests that nationalizing forces are reshaping various aspects of state-level politics.
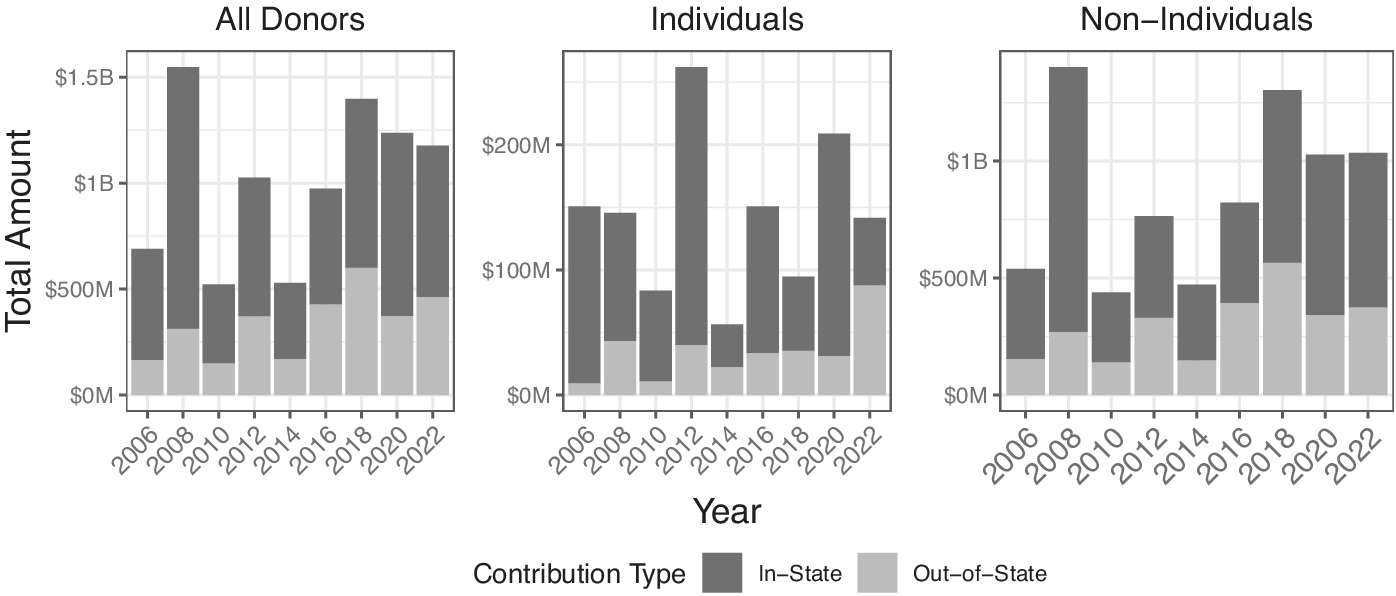
To better understand this trend, I then compare in-state and out-of-state giving across three categories: all donors, individuals, and nonindividuals (Figure 2). In-state contributions consistently exceed out-of-state amounts across all categories. However, both individual and nonindividual out-of-state donors make up substantial proportions of total contributions. The gap between in-state and out-of-state giving narrows significantly for nonindividual donors over time, with out-of-state nonindividual contributions approaching parity with their in-state counterparts by 2022. Individual out-of-state contributions, while lower than in-state individual giving, maintain a consistent and significant presence throughout the period.
Comparison of in-state and out-of-state contributions by donor type. Both nonindividual and individual donors make up a substantial portion of overall contributions.

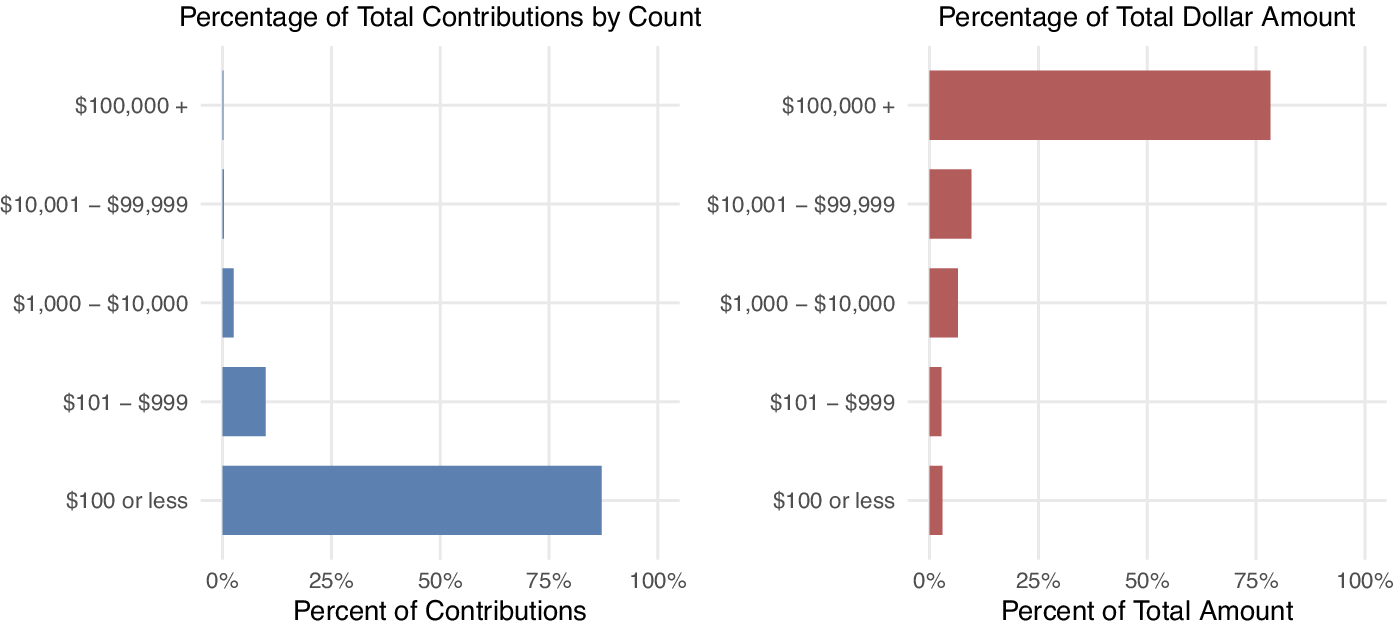
I then examine contribution activity, focusing on individual out-of-state donors. Figure 3 illustrates the distribution of contribution sizes from out-of-state donors, revealing a landscape dominated by small donations. Over 86% of contributions are $100 or less, whereas about 10% fall between $101 and $999. Larger donations are relatively rare, with contributions ranging from $1,000 to $10,000 and those exceeding $10,000 each representing less than 4% of total contributions.
Distribution of out-of-state individual contributions by size. The left panel shows the percentage of total contributions by count across different donation amounts, with small donations ($100 or less) dominating numerically. The right panel shows the percentage of total dollar amount, illustrating that large donations ($10,000+) represent the bulk of funding despite being few in number.

This distribution highlights the prevalence of small contributions among out-of-state donors, contributing to a growing body of scholarship examining small donor behavior in campaign finance. While federal campaigns only require itemized disclosure for contributions over $200, many state and local jurisdictions, including those governing ballot measure campaigns, have lower reporting thresholds. This allows us to observe a more comprehensive picture of small donor activity. Scholars have paid increased attention to small donors in recent years (Ansolabehere, De Figueiredo, and Snyder Reference Ansolabehere, De Figueiredo and Snyder2003; Barber Reference Barber2016; Bouton et al. Reference Bouton, Castanheira and Drazen2024; Culberson, McDonald, and Robbins Reference Culberson, McDonald and Robbins2019; Keena Reference Keena and Knight-Finley2019), examining the characteristics and motives of these donors utilizing contribution platforms like ActBlue. State-level campaign finance data, including that from ballot measures, offer a unique window into small donor behavior that is often obscured in federal campaign finance analyses.
When we consider the percentage of the total amount contributed rather than just the number of contributions, the contribution activity of out-of-state individual donors looks quite different. While individual out-of-state donations of $100 or less make up over 86% of contributions, they account for only 3% of the total out-of-state amount donated. Conversely, contributions exceeding $10,000, while comprising less than 1% of the total number of donations, represent about 86% of the total amount. The prevalence of small-dollar contributions suggests a broad base of participation, potentially indicative of grassroots mobilization or widespread ideological resonance with specific ballot measures. However, the outsized financial influence of a minute fraction of high-dollar contributors raises questions about the nature of democratic representation and the potential for plutocratic tendencies in a system theoretically designed to reflect the will of the people.
What are these donors contributing to? Unlike scholarship looking at out-of-state donor contributions to candidates for state or federal office, contributions to state-level direct democracy campaigns are policy- and outcome-specific.
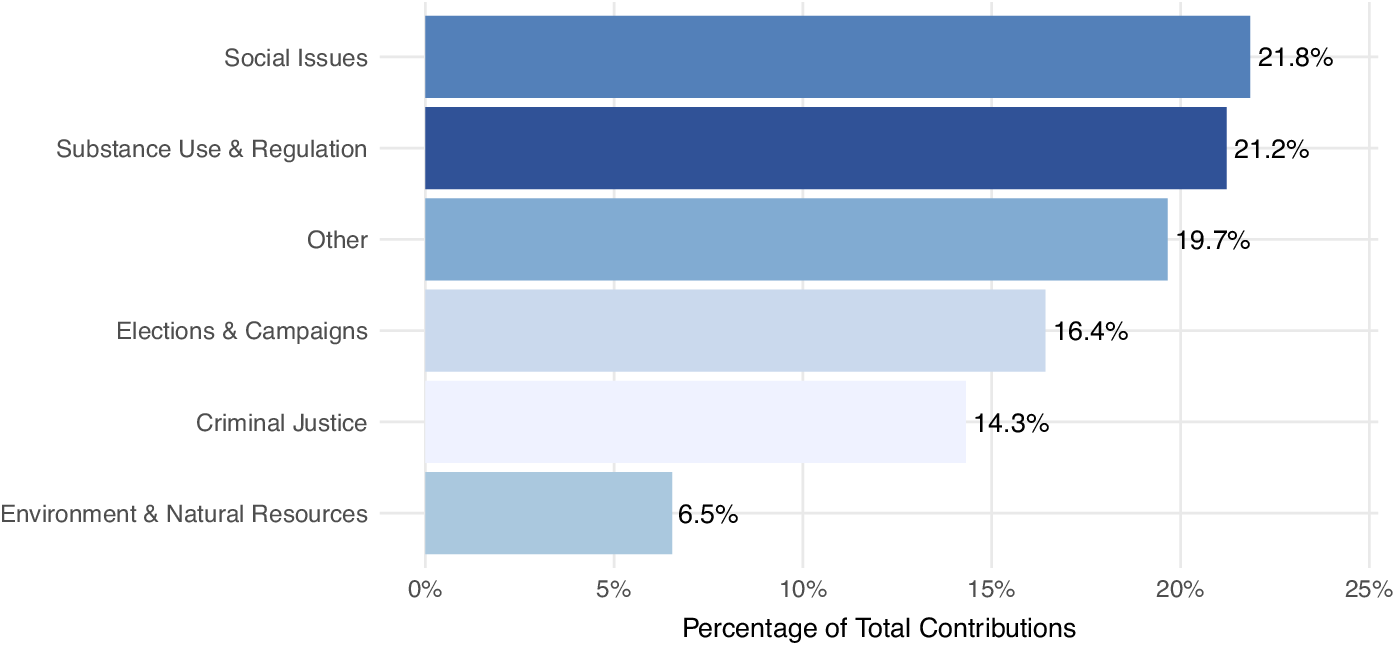
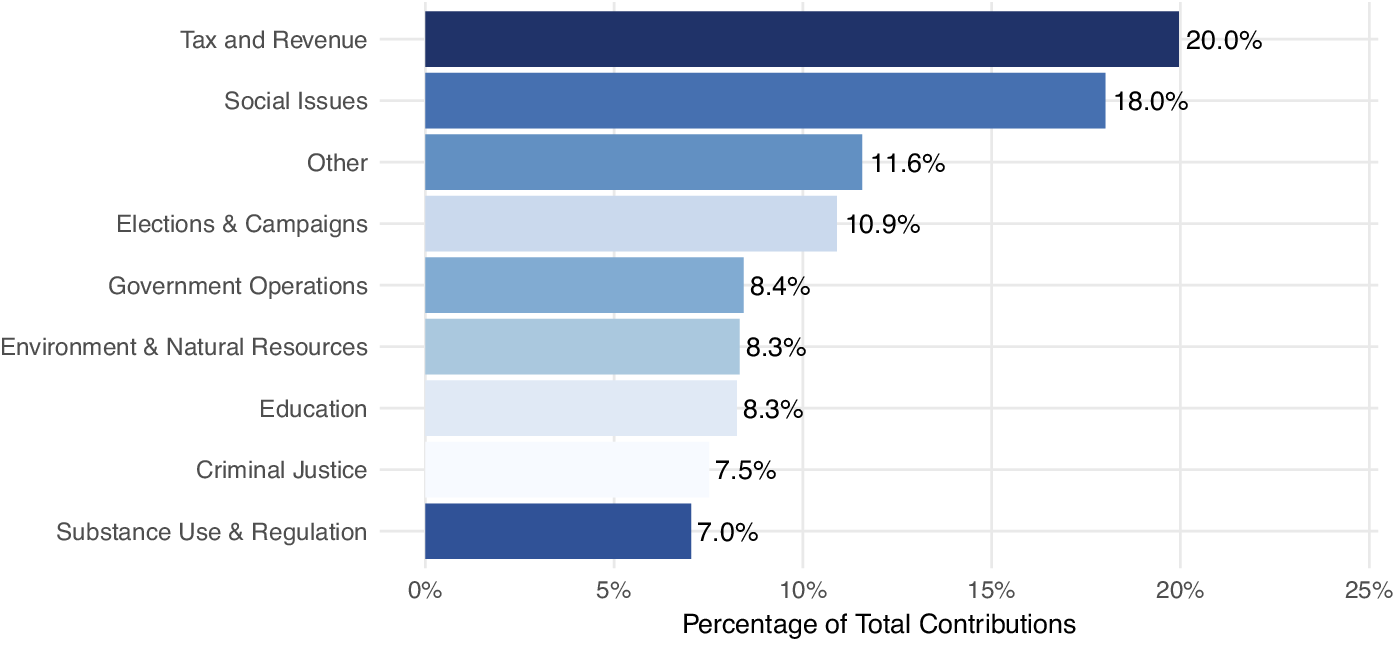
Figure 4 illustrates the distribution of individual out-of-state contributions across various policy types. The “Other” category comprises policy areas that each amass less than 5% of total out-of-state individual contributions, including Business & Labor, Gambling, Bonds & Infrastructure, Property Rights, Agriculture & Food, Housing, Economic Development, and Veterans & Military affairs. Social issues attract the most attention of these donors, accounting for about 21% of all contributions. Notably, social issues represent only 7% of the total measures on the ballot. Similarly, substance use and regulation policies make up just 7% of ballot measures but attract 21% of total out-of-state individual contributions, making them the second most funded category. This significant funding imbalance suggests that these two categories are particularly motivating for donors willing to contribute across state lines, despite their relatively infrequent appearance on ballots. This giving pattern differs markedly from individual in-state donors. Instead of social issues taking the top spot, in-state donors put their money primarily toward issues related to tax and revenue and ballot measures focusing on substance use only make up about 7% of total contributions. See Appendix C for a comprehensive policy type distribution for in-state contributors.
Individual out-of-state contributions by policy type. This graph categorizes contributions according to policy domains, revealing donor preferences for specific issues, namely social issues.

This pattern of giving across policy domains potentially reflects a unique cohort of “Strategic Investors” (Rhodes et al. Reference Rhodes, Schaffner and La Raja2018). This is not just because they “donate to candidates outside their state” but because the nature of direct democracy allows them to funnel their contributions to particular issues instead of a range of interest groups, PACs, and candidates (Jacobs and Imboywa Reference Jacobs and Imboywa2024, 241; Rhodes et al. Reference Rhodes, Schaffner and La Raja2018).
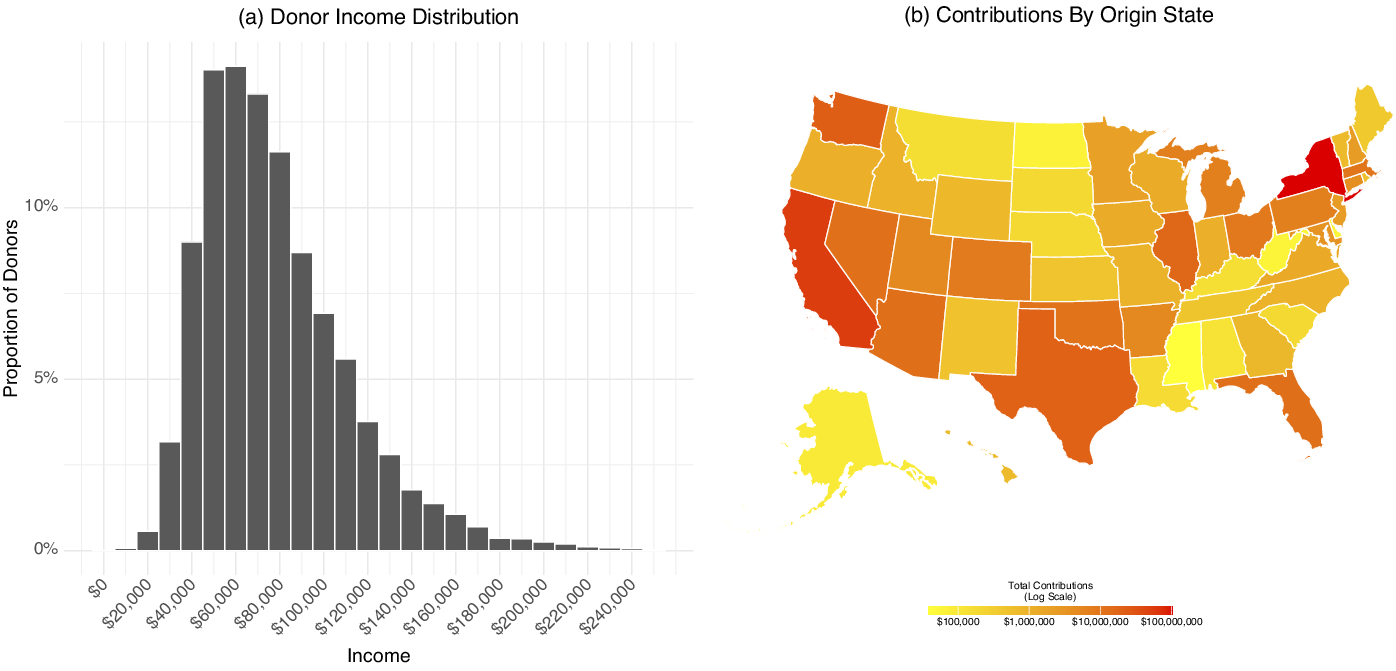
Finally, this article examines two additional characteristics of out-of-state direct democracy contributions. Figure 5 offers a comprehensive visual representation of the geographic and income distribution of out-of-state individual contributions to direct democracy campaigns from 2006 to 2022. Panel (a) depicts the income distribution of out-of-state individual contributions, based on data from the ACS zip code-level income estimates matched to donor zip codes provided in campaign finance records. The resulting distribution reveals a right-skewed pattern, with most contributions coming from zip codes with low-to-average median incomes. This approach, while it does not provide exact individual-level income data for each contributor, offers a proxy for understanding the broader economic landscape from which out-of-state direct democracy contributions emerge.
Geographic and income distribution of out-of-state donors. Panel (a) shows the distribution of contributions by donor zip code income levels. Panel (b) maps total contribution amounts by state of origin, with darker shades indicating higher contributions.

This income distribution may challenge conventional assumptions about the socioeconomic profile of political donors. While previous research has often emphasized the outsized influence of wealthy elites in campaign finance (Verba, Schlozman, and Brady Reference Verba, Schlozman and Brady1995), these data highlight a different subset of contributors. The right-skewed distribution indicates that a substantial portion of out-of-state donors to direct democracy campaigns come from areas with modest to moderate income levels. This finding is particularly noteworthy, given the long-established positive relationship between income and political giving (Verba, Schlozman, and Brady Reference Verba, Schlozman and Brady1995), and hints at the possibility of a more economically diverse donor base in direct democracy initiatives, potentially challenging our understanding of who shapes policy outcomes through financial contributions.
Panel (b) illustrates the total contributions by origin state, where out-of-state contributions originate. A few states on this map stand out with comparatively high concentrations of out-of-state contributions, such as New York and Texas. Interestingly, these states lack similar direct democracy processes of their own. New York, despite attempts to establish statewide initiative and referendum processes, has consistently failed to implement such mechanisms due to entrenched political interests and legislative resistance. Despite these restrictions, individuals in the state have contributed over $106 million to other state campaigns between 2006 and 2022. This is more than any other state’s aggregate out-of-state amount. Similarly, Texas restricts direct democracy to legislatively referred amendments at the state level, offering no provisions for citizen-initiated statutes or constitutional amendments. Contributions from individuals to other state direct democracy races, however, total over $28 million. This is the third-highest concentration of out-of-state contributions. The absence of robust direct democracy mechanisms in these populous states may explain their residents’ propensity to engage in out-of-state ballot measure campaigns. This pattern indicates that residents in states without direct democracy mechanisms may seek alternative avenues for political expression through out-of-state contributions.
Theory of why donors contribute
This section develops a potential theory to explain the puzzle of why individual donors contribute to direct democracy campaigns in states where they do not reside, despite the absence of direct policy impact on their lives or communities. Drawing on the scholarship examining political participation and campaign finance and the findings from previous sections, I argue that donors are motivated by a complex interplay of ideological and consumption-based motivations (Ansolabehere, De Figueiredo, and Snyder Reference Ansolabehere, De Figueiredo and Snyder2003; Verba, Schlozman, and Brady Reference Verba, Schlozman and Brady1995).
Ideological motivations
Over 40% of all individual out-of-state donations are funneled to high-profile social and moral issue campaigns. Specifically, out-of-state donors contribute most to issues relating to issues regarding abortion, LGBT+ rights, affirmative action, and substance use and regulation. The direct democracy measure amassing the most out-of-state individual contributions was Proposition 8 in California in 2008, which aimed to define marriage as between one man and one woman, reversing a state court ruling legalizing same-sex marriage. The measure received $46.5 million from almost 18,000 donors outside of the state. Similarly, the ballot measure amassing the third-highest concentration of out-of-state individual contributions was Michigan’s Proposal 3 in 2022, which instituted a constitutional amendment declaring that “[every] individual has a fundamental right to reproductive freedom, which entails the right to make and effectuate decisions about all matters relating to pregnancy, including, but not limited to, prenatal care, childbirth, postpartum care, contraception, sterilization, abortion care, miscarriage management, and infertility care” (Reproductive Health Act 2023). Proposal 3 attracted $14 million from over 16,000 donors registered outside of Michigan. This behavior aligns with the notion that individuals engage in political activities as an expression of their values and beliefs (Baker Reference Baker2020; Bonica Reference Bonica2016; Panagopoulos and Bergan Reference Panagopoulos and Bergan2006; Verba, Schlozman, and Brady Reference Verba, Schlozman and Brady1995). By contributing to campaigns that resonate with their ideological positions, even across state lines, donors can affirm their identities and signal solidarity with like-minded causes. This form of expressive participation may be particularly appealing to individuals residing in states without direct democracy mechanisms, as it provides an alternative avenue for ideological self-expression.
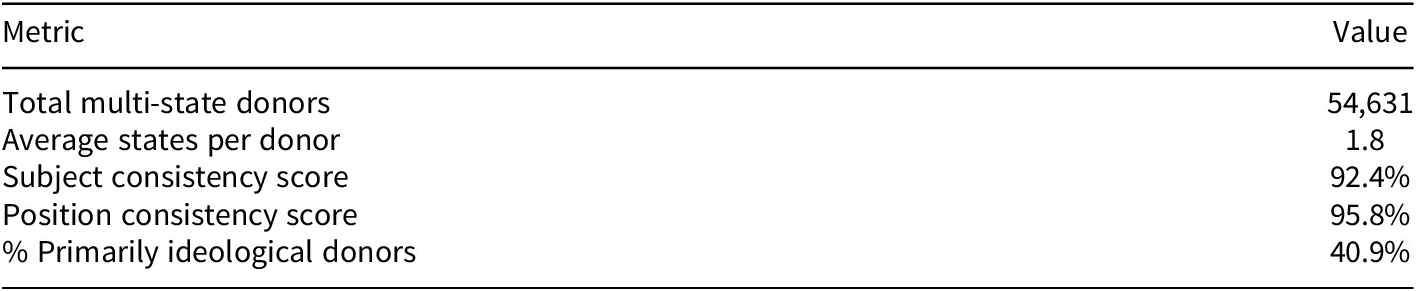
To test the ideological theory, I analyze the consistency of donor behavior across multiple campaigns and states. The methodology focuses on three key metrics: subject matter consistency (whether donors give to similar issue types), position consistency (whether donors maintain consistent support or opposition toward a measure), and the correlation between consistency and contribution amounts (Table 2). For statistical validation, I employ t-tests to determine if consistency rates exceed random chance (0.5) and correlation analysis to examine relationships between the donor characteristics (Table 3).
Multi-state donor characteristics

Statistical test results

The results presented in Tables 2 and 3 reveal patterns consistent with ideologically motivated giving among out-of-state donors to direct democracy campaigns. Table 2 shows donors contribute across an average of 1.8 states while maintaining remarkably high subject and position consistency in their giving patterns. The finding that about 40% of donors concentrate their giving on ideologically charged issues further supports this interpretation, though this could also reflect the heightened media coverage of these issues or the relative prevalence of such measures on state ballots. However, the policy type analysis in Figure 4 suggests that this might not be the case. Statistical testing demonstrated in Table 3 strongly rejects the null hypothesis that these patterns emerge from random giving (p < .0001), suggesting that donors make deliberate choices about which campaigns to support.
While the consistency scores suggest donors tend to support similar positions across different ballot measures, this pattern could emerge from either a genuine ideological commitment or other factors that produce systematic rather than random giving. Together, these results indicate that out-of-state donors engage in purposeful rather than indiscriminate giving, with patterns that align with ideologically motivated behavior, even if we cannot definitively rule out all alternative explanations for the observed consistency in donor behavior.
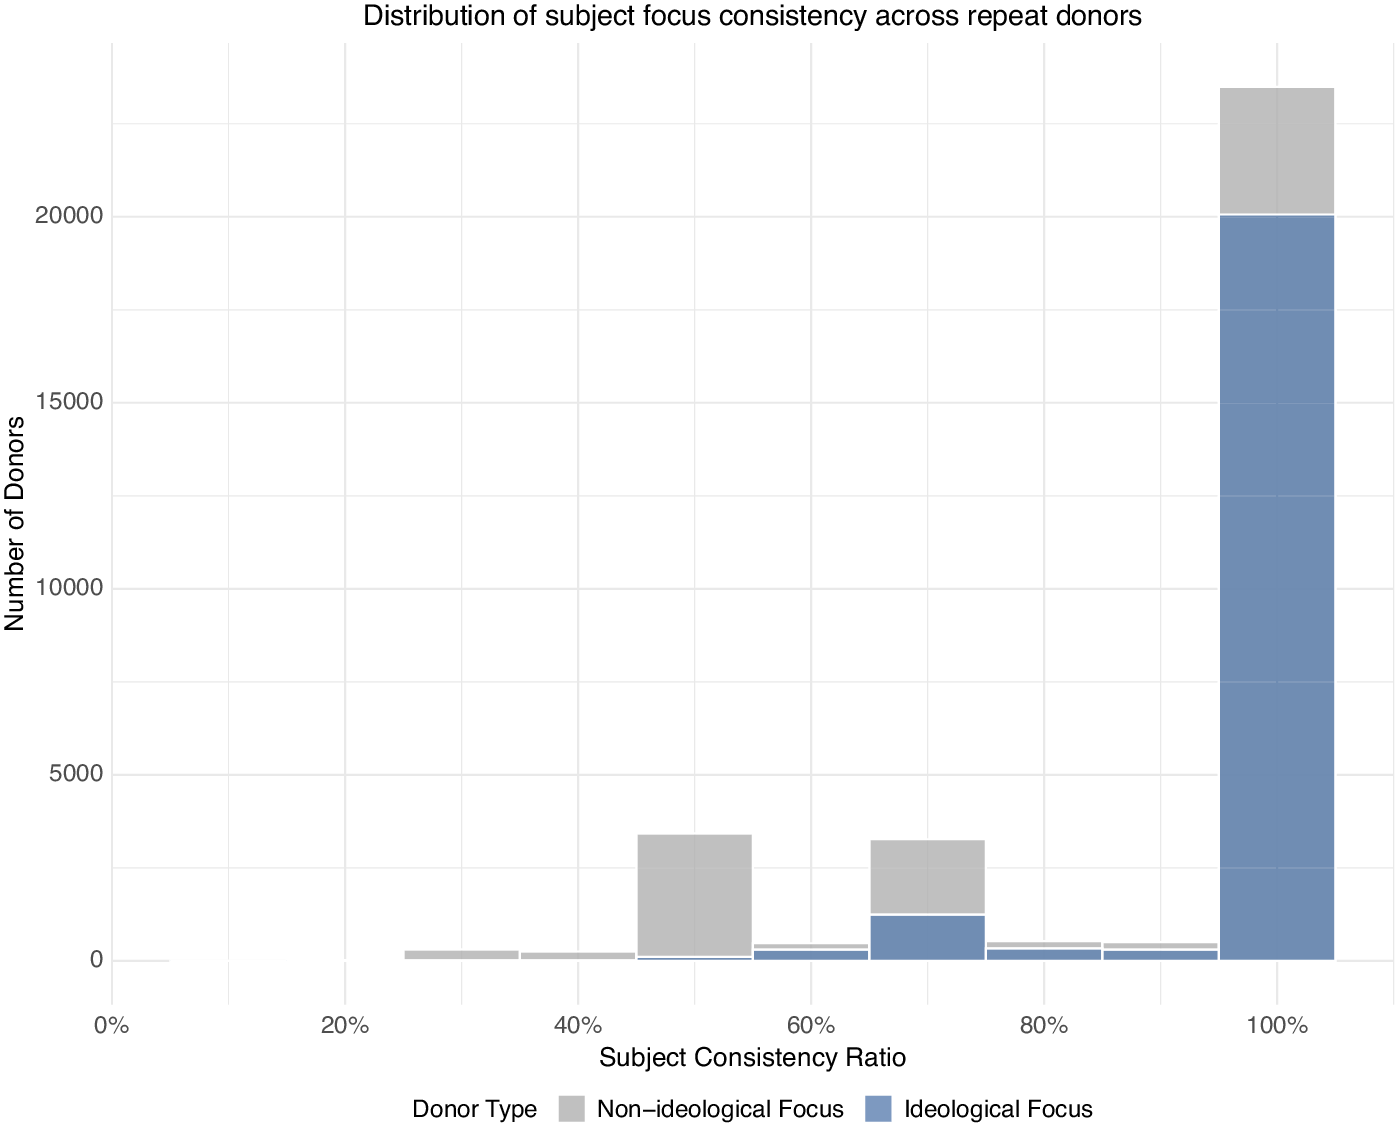
Figure 6 reinforces these findings by showing a strong right skew in subject consistency ratios – most donors cluster at high consistency levels (0.8–1.0), with relatively few exhibiting varied giving patterns. The slight negative correlation between amount and consistency (r = −0.016) suggests that even as donors give larger amounts, they maintain their ideological focus. These patterns align with theoretical expectations that out-of-state donors are sophisticated political actors who carefully select campaigns matching their ideological preferences, rather than giving based on geographic proximity or other factors.
Distribution of subject matter consistency among repeat donors (2006–2022). The bars show the number of donors at each consistency level, separated by those focusing on ideological versus non-ideological issues. Most donors maintain high consistency (>80%) in their giving patterns across multiple contributions.

The results also provide evidence on donor sophistication – rather than treating all policy reforms similarly, donors appear to discriminate based on specific issue positions and maintain those positions across jurisdictions. This level of consistency would be unlikely if donors were motivated primarily by non-ideological factors. The fact that donors exhibit such strong patterns despite the single-subject nature of initiatives suggests that they are actively seeking opportunities to engage in ideological expression through direct democracy campaigns.
Evidence from these tests contributes to the existing literature debating the sophistication and ideological nature of donors (La Raja and Wiltse Reference La Raja and Wiltse2012). In the context of direct democracy, individual donors may exhibit distinct patterns of sophistication in their contribution behavior compared to donors in candidate elections. While Hill and Huber (Reference Hill and Huber2017) suggest that individual donors may not distinguish among same-party candidates based on ideology, other scholars, such as Barber, Canes-Wrone, and Thrower (Reference Barber, Canes-Wrone and Thrower2017) and Baker (Reference Baker2020), who focus on out-of-state donors, find that donors are indeed ideologically motivated. However, these existing findings may not fully capture the motivations of direct democracy donors. Direct democracy campaigns are inherently policy-specific, focusing on a particular issue or proposal rather than a candidate’s broader platform or party affiliation. This policy-specific nature of direct democracy may encourage donors to engage in more sophisticated decision-making, carefully considering the ideological alignment and potential outcomes of the measures they choose to support financially, without the need to distinguish between the various ideological leanings of one candidate over another. Consequently, the motivations and contribution patterns of individual donors in direct democracy campaigns may diverge from those observed in candidate elections, showcasing a higher level of political sophistication and ideological discernment. The current study’s findings suggest that out-of-state donors, whether contributing to candidates or ballot measures, are ideologically sophisticated actors who base their giving decisions on specific policy positions and ideological alignment.
Consumption-oriented motivations
Simultaneously, the prevalence of small donations among individual out-of-state donors points to a consumption-based motivation. The consumption model of political giving, as articulated by Ansolabehere, De Figueiredo, and Snyder (Reference Ansolabehere, De Figueiredo and Snyder2003), posits that donors derive utility from the act of participation itself, rather than expecting a tangible policy return on their investment. This finding appears to hold up for out-of-state donors in representative politics as well. Keena (Reference Keena2024) finds that out-of-state donors to Senate campaigns behave like “consumers” when giving to senators who are not actively seeking reelection. During off-cycle periods, senators strategically appeal to out-of-state donors by sponsoring legislation, and these donors respond by rewarding senators for their position-taking.
The descriptive patterns observed in the context of direct democracy campaigns align with both Ansolabehere, De Figueiredo, and Snyder’s (Reference Ansolabehere, De Figueiredo and Snyder2003) consumption model and Keena’s (Reference Keena2024) findings on out-of-state donors in Senate campaigns. The vast majority, over 86%, of individual out-of-state donors to direct democracy campaigns contribute $100 or less, amounts unlikely to yield substantial policy influence consistent with alternative explanations, such as the investment model of giving.Footnote 3 By making these small donations to out-of-state campaigns, individuals can experience the intrinsic rewards of engaging in the political process, such as a sense of agency, fulfillment, and connection to a larger cause.
To test the consumption theory of political giving among out-of-state individual donors in direct democracy campaigns, I focus on the behavior of small donors who contributed $100 or less. The consumption theory assumes that donors derive intrinsic value from the act of participation itself, rather than expecting direct policy influence or material benefits. If this theory holds, I expect small donors to make multiple contributions across different campaigns and states, even if the total amount given remains relatively low. I calculate summary statistics on the number of donations, states, and total amounts per donor, and conduct statistical tests to assess if the observed patterns are consistent with this hypothesis. Specifically, I use a one-sided t-test to determine if the average number of donations per donor is significantly greater than 1. This test aims to evaluate whether small donors exhibit behavior consistent with the consumption theory, providing evidence for the intrinsic motivations behind their political giving.
Results from the analysis of small donor behavior provide some preliminary support for the consumption theory of political giving among out-of-state individual donors in direct democracy campaigns. Table 4 presents summary statistics for small donors who contributed $100 or less, revealing a total of 129,200 small donors who made an average of 2.18 donations each, supporting campaigns across an average of 1.27 states per donor. The median total amount contributed per small donor was $50.
Summary statistics for small donors

Based on the results presented in Table 5, the statistical test provides strong evidence supporting the consumption theory of political giving among small out-of-state donors in direct democracy campaigns. The one-sided t-test examining whether donors make significantly more than one contribution on average yielded a highly significant result. The data show that small donors made an average of 2.18 donations each, which is substantially and statistically significantly greater than the theoretical value of 1. The effect size (Cohen’s d = 0.34) indicates small to medium practical significance. These findings provide some evidence that small donors derive ongoing utility from repeated participation in the political process rather than seeking to maximize influence through single, concentrated giving – a pattern that aligns with the consumption theory’s prediction that political giving serves expressive and identity-affirming functions beyond mere instrumental goals.
Statistical test of consumption theory

This statistical test provides preliminary evidence supporting the consumption theory of political giving among out-of-state direct democracy donors, though it is methodologically limited in a few important ways. The operationalization employed here relies primarily on donation frequency patterns rather than capturing the full conceptual richness of consumption-oriented motivations. Ideally, future research should triangulate multiple measurement approaches, including donor surveys, natural experiments, and controls for confounding factors such as fundraising appeals or social media influence. Despite these limitations, this analysis makes a valuable contribution by demonstrating a statistically significant pattern of repeated small-dollar giving across state lines—behavior that aligns more closely with expressive participation than with instrumental investment. The modest but meaningful effect size suggests that consumption motivations, while not the sole driver, play a substantive role in explaining the otherwise puzzling phenomenon of small out-of-state direct democracy contributions that offer no material return.
Overall, the theory developed in this section posits that individual out-of-state donors to direct democracy campaigns are motivated by a combination of ideological expression and political consumption. Contributing to campaigns that align with their values, even in small amounts and across state lines, allows these donors to affirm their identities, signal their beliefs, and derive expressive benefits from participation.
Conclusion
In November 2020, the state of Oregon passed Oregon Measure 110, the Drug Decriminalization and Addiction Treatment Initiative. This ballot initiative reduced penalties for drug possession, making Oregon the first state to decriminalize the personal possession of controlled substances (Oregon Measure 110, 2020). Of the nearly $5 million contributed to the Oregon Measure 110 campaign, both in support and opposition, only about a quarter of these contributions came from Oregon donors. Out-of-state donors, particularly in New York, California, and Texas, contributed the other 72% of campaign contributions. For many, this out-of-state involvement raised fundamental questions about whether the measure truly reflects Oregonians’ will, or was instead being pushed by outside interests lacking a critical understanding of the state’s specific needs.Footnote 4
This study provides the first large-scale examination of this phenomenon. The findings reveal a complex landscape of political engagement that both challenges and aligns with existing assumptions regarding campaign finance in the US and out-of-state political contributions. I demonstrate a steady increase in out-of-state contributions to direct democracy campaigns over time, with notable spikes in recent election cycles, suggesting a growing nationalization of state-level policy debates through these mechanisms.
Further, contrary to conventional wisdom, the majority of individual out-of-state donors make small contributions of $100 or less, primarily to measures related to social and moral issues. This democratic participation appears to extend across economic lines, as a substantial portion of individual out-of-state contributions comes from zip codes with lower to middle incomes. Finally, the geographic distribution of these contributions reveals that a significant portion originates from states without robust direct democracy processes, suggesting that these donors may be seeking alternative avenues for political expression.
While this study focuses on the motivations of individual donors, who represent the vast majority of contributors by count, a very small fraction of high-dollar donors (those contributing over $10,000) accounts for approximately 86% of the total out-of-state funding despite comprising less than 1% of all contributors. The motivations driving these large donors likely differ from those of small-dollar contributors and may align more closely with traditional investment or influence-seeking models of political giving. Consequently, while these findings focus mainly on the behavior of the numerically dominant group of small donors and their apparent ideological and consumption-oriented motivations, the financial landscape of direct democracy campaigns remains heavily influenced by a tiny subset of wealthy contributors whose motivations warrant separate investigation and raise important questions about democratic representation that extends beyond the scope of this analysis.
I then develop a potential explanation for what motivates individual donors to contribute out of state. I argue that individual out-of-state donors to direct democracy campaigns are motivated by a combination of ideological expression and political consumption. This theoretical approach is substantiated by the empirical evidence showing a pattern of small, repetitive contributions specifically targeted toward measures with significant moral or value-laden implications.
As direct democracy continues to play a growing role in shaping state policies, understanding the motivations and patterns of out-of-state donors will be essential for policymakers, scholars, and citizens alike. This study provides a foundation for future investigations into this important aspect of American democracy, offering new insights into the complex interplay of local governance and national political engagement in the context of direct democracy. Future research should explore the long-term impacts of this trend on policy outcomes, voter behavior, and the evolution of state-level political landscapes in an increasingly interconnected landscape.
Data availability statement
Replication materials are available on SPPQ Dataverse at https://dataverse.harvard.edu/dataset.xhtml?persistentId=doi:10.7910/DVN/VIYZJV (2025).
Funding statement
The authors received no financial support for the research, authorship, and/or publication of this article.
Competing interests
The author declared no potential competing interests with respect to the research, authorship, and/or publication of this article.
Appendix A: State disclosure thresholds
Table A1 presents the minimum disclosure thresholds for campaign contributions to direct democracy committees across the 26 states in the dataset. The disclosure threshold represents the dollar amount at which political committees must report individual contributor information to state authorities. As shown, these thresholds vary considerably—from $0 in states requiring disclosure of all contributions regardless of amount to $1,000 in Nevada.
Disclosure thresholds for direct democracy contributions by state

Appendix B: Descriptive statistics for campaign finance dataset
Tables B1–B6 in this appendix provide additional descriptive statistics for the dataset used in this article.
Ballot measures by state and year

Total contributions by state and year (millions USD)

Out-of-state contributions by state and year (millions USD)

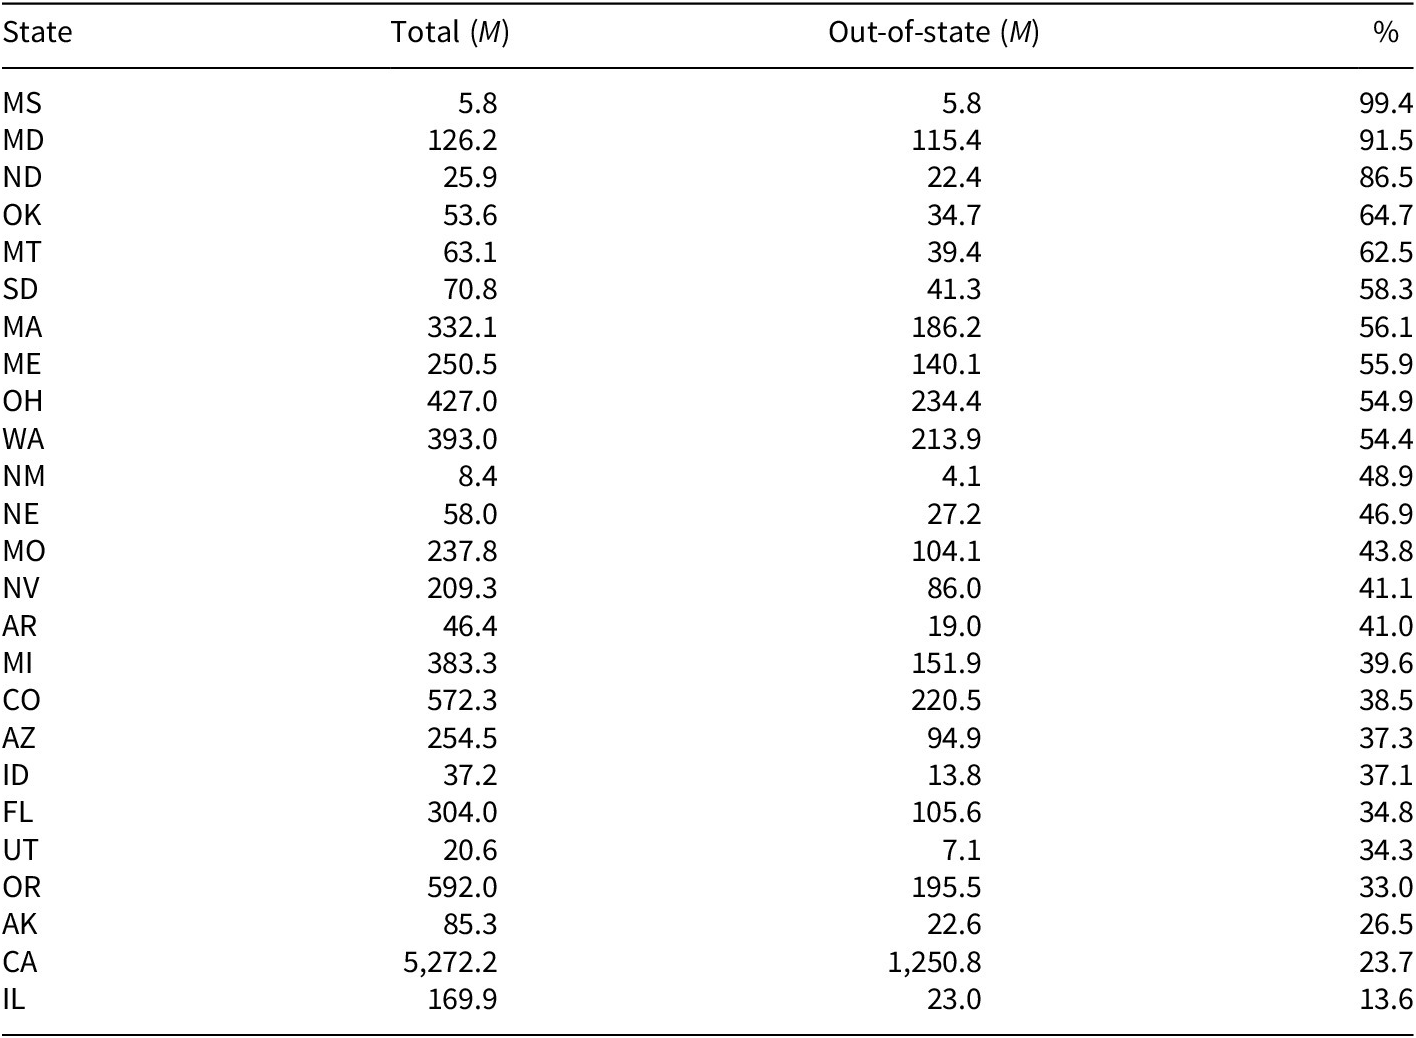
Percentage of out-of-state contributions by state

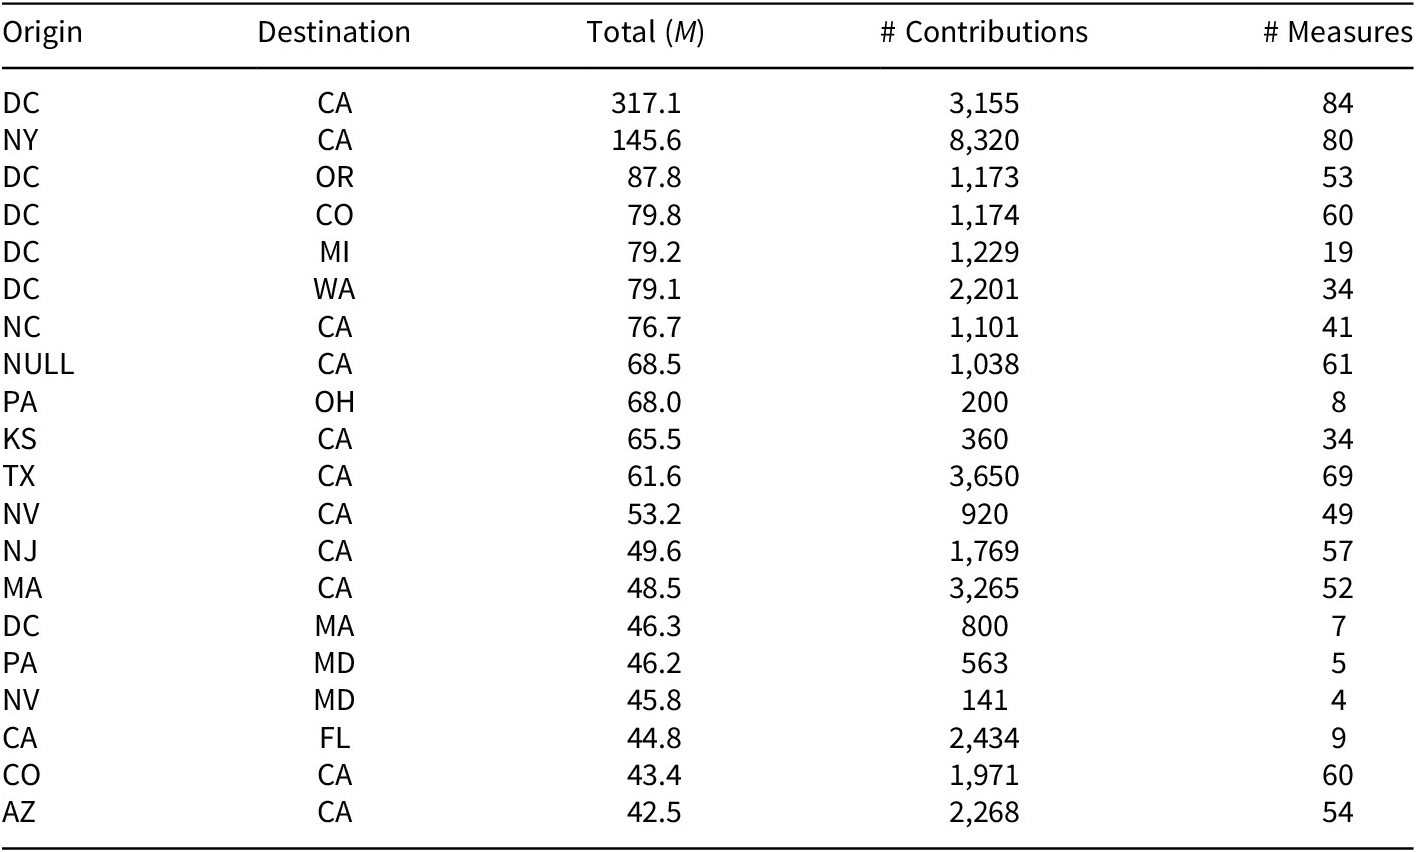
Top 20 state pairs by out-of-state contribution amount

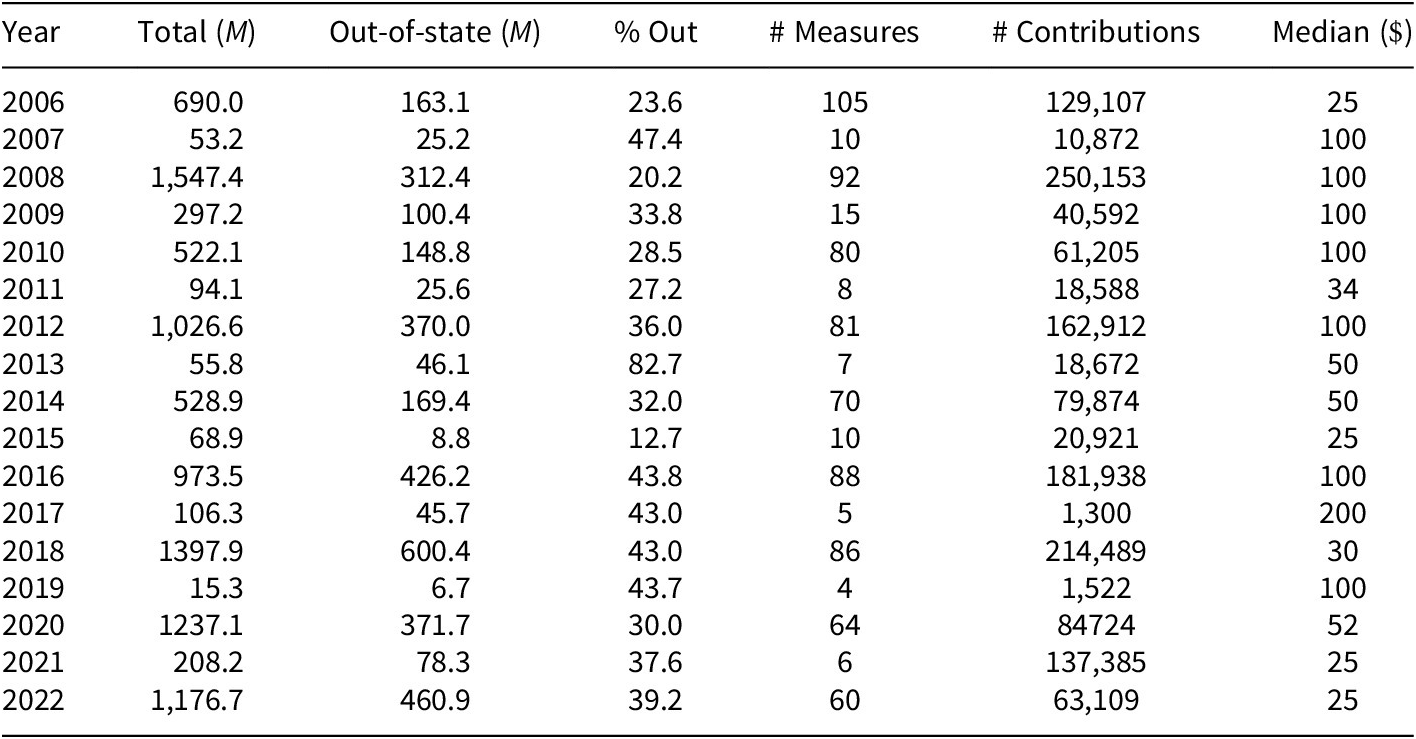
Yearly trends in direct democracy financing

Appendix C: Policy types
Table C1 presents all unique subjects found in the dataset of direct democracy campaign contributions.
Categorization of direct democracy subjects

Figure C1 examines contribution activity for in-state individual donors, providing comparative data to Figure 4, which examines policy types for individual out-of-state donors.
Individual in-state contributions by policy type.

Madison Schroder is a political science PhD candidate at the University of Oregon. Her research explores the intersection of direct democracy and the nationalization of state politics—particularly through the lens of campaign finance and donor behavior.