1. Introduction
Stochastic properties of sums of independent exponentially distributed random variables  $X_i$
for
 $i \in {\mathcal{N}}$
, where
 ${\mathcal{N}}\subset \mathbb{N}$
is some finite set, are of both high theoretical and high practical relevance. Under the assumption that the rate parameters
 ${\lambda}_i>0$
are pairwise distinct, the distribution of the sum
 $S_{{\mathcal{N}}}=\sum_{i\in{\mathcal{N}}} X_i$
can be represented as a generalized exponential mixture (GEM) with distribution function
 $F_{S_{\mathcal{N}}}(x)=1-\sum_{i\in{\mathcal{N}}}\pi_{i}\, \textrm{e}^{-{\lambda}_i x}$
,
 $x>0$
, with real-valued mixing proportions
 $\pi_i$
which satisfy
 $\sum_{i\in{\mathcal{N}}} \pi_i=1$
. Note that this distribution class is also known in the literature under other names, such as generalized Erlang [Reference Bergel and Egídio dos Reis9], hypoexponential, as its coefficient of variation is smaller than with the exponential distribution [Reference Li and Li19], or generalized hyperexponential [Reference Harris, Marchal and Botta13].
The early theoretical literature on exponential mixtures is mainly focused on necessary or sufficient conditions for the mixing proportions  $\pi_i$
to ensure that, for
 $x>0$
, the expression
 $1-\sum_{i\in{\mathcal{N}}}\pi_{i}\, \textrm{e}^{-{\lambda}_i x}$
defines a valid distribution function; see, e.g., [Reference Bartholomew7, Reference Harris, Marchal and Botta13, Reference Steutel25]. More recently, research has been more concentrated on probabilistic or statistical properties of exponential mixture distributions; see, e.g., [Reference Amari and Misra2, Reference Favaro and Walker12, Reference Jewell15, Reference Kochar and Xu17, Reference Navarro, Balakrishnan and Samaniego23]. Mixtures and convolutions of exponential distributions constitute important subclasses of so-called phase-type distributions which are defined in terms of an underlying Markov jump process. Phase-type distributions attract much attention in the current literature (see, e.g., [Reference Albrecher and Bladt1]); an excellent review of recent results on phase-type distributions can be found in [Reference Bladt and Nielsen10].
Convolutions of exponential distributions have been proved to be relevant in various application fields: in management science, [Reference Bekker and Koeleman8] provides results on admission scheduling in a clinic with respect to stable bed demand where patient stay lengths follow GEM distributions; in reliability theory, [Reference Kordecki18] provides bounds for the probability that a system of independent components will operate completely when the component failure probabilities are exponentially distributed with pairwise distinct rates, while [Reference Yin, Angus and Trivedi27] derives results on finding the optimal rate of preventive maintenance in Markov systems with GEM time-to-failure distribution; further applications are elaborated by [Reference Asmussen4] in renewal theory, [Reference Bergel and Egídio dos Reis9, Reference Willmot and Woo26] in actuarial science, and [Reference Anjum and Perros3] in network science; [Reference Dufresne11] shows how to apply GEMs for approximating arbitrary distribution functions with positive half-line support. Recently, [Reference Klüppelberg and Seifert16] investigated financial risk measures for a system of asymptotically exponentially distributed losses; however, they showed that summation of such losses does not lead to GEM distributions.
Although the above-mentioned literature on unconditional GEM distributions is rather substantial, to the best of our knowledge results on conditional distributions for sums of independent exponentially distributed random variables are not yet available. In this paper we close this gap and deduce explicit results on conditional distributions for such sums. The assumption of pairwise distinct rate parameters makes the analysis more challenging compared to those for the sum of independent, identically exponentially distributed random variables, which follows an Erlang distribution. Nevertheless, we also handle the case where we relax the restriction that the rate parameters are all pairwise distinct.
In the present paper we consider the total sum  $S_{\mathcal{N}} =\sum_{i\in{\mathcal{N}}} X_i$
as well as subset sums
 $S_{\mathcal{A}} =\sum_{i\in\mathcal{A}} X_i$
based on subsets
 $\mathcal{A}\subseteq{\mathcal{N}}$
of independent, exponentially distributed
 $X_i$
, and deduce the conditional distributions for both
 $\mathbb{P}(S_{{\mathcal{N}}}\!>\!s \mid S_{\mathcal{A}}\!>\!t)$
and
 $\mathbb{P}(S_{\mathcal{A}}\!>\!t \mid S_{{\mathcal{N}}}\!>\!s)$
for
 $s,t>0$
. Hence, we quantify the interdependence between the total sum
 $S_{{\mathcal{N}}}$
and subset sums
 $S_{\mathcal{A}}$
of independent exponential random variables. Besides providing results for finite thresholds
 $s,t>0$
, we also present statements quantifying the tail behavior when conditioning on extreme events
 $\{S_{\mathcal{N}} >s\}$
for
 $s\to\infty$
and
 $\{S_\mathcal{A} >t\}$
for
 $t\to\infty$
. Our novel probabilistic results are essential when only partial information on a subset is available but the quantity of interest is the total sum
 $S_{\mathcal{N}}$
, or, vice versa, when there is information about the total sum
 $S_{{\mathcal{N}}}$
but the distribution of some subset sum
 $S_{\mathcal{A}}$
is of interest.
This paper is organized as follows. In Section 2 we give expressions for the distribution of sums  $S_{\mathcal{N}} =\sum_{i\in{\mathcal{N}}} X_i$
of independent, exponentially distributed random variables
 $X_i$
, and deduce the characteristic tail behavior of their survival functions. In Section 3 we investigate the conditional distributions for the sum
 $S_{\mathcal{N}}$
given that some
 $X_j$
,
 $j\in{\mathcal{N}}$
, exceeds a certain threshold value, as well as, conversely, those of
 $X_j$
given that
 $S_{\mathcal{N}}$
exceeds some threshold. Next, in Section 4 we generalize these results by providing the conditional distributions for the total sum
 $S_{\mathcal{N}}$
and subset sums
 $S_\mathcal{A} = \sum_{j\in \mathcal{A}}X_j$
for some
 $\mathcal{A}\subseteq {\mathcal{N}}$
. In Section 5 we illustrate our theoretical results by presenting relevant examples where our results may provide support for decision-making in practice. The proofs are placed in Section 6.
1.1. Notation and conventions
Two functions f and g are said to be (i) asymptotically equivalent ( ${\kern1.3pt}f\sim g$
) if
 $f(x)/g(x)\to 1$
for
 $x\to\infty$
, and (ii) proportional (
 $f\propto g$
) if
 $f(x)/g(x)=c$
for all x and some constant
 $c>0$
. For some
 $|{\mathcal{N}}|\in\{2,3,4,\ldots\}$
we use the notation
 ${\mathcal{N}}\,:\!=\{1,2,\ldots,|{\mathcal{N}}|\}$
and denote by
 $|\mathcal{A}|$
the cardinality of a set
 $\mathcal{A}\subseteq {\mathcal{N}}$
. Further, we write
 $f_{X_i}$
for the density of the random variable
 $X_i$
. We denote by
 ${\textrm{Exp}}({\lambda}_i)$
the class of exponentially distributed random variables with rate parameter
 ${\lambda}_i>0$
, such that
 $X_i\in{\textrm{Exp}}({\lambda}_i)$
has the density
 ${f_{X_i}}(x)={\lambda}_i \,\textrm{e}^{-{\lambda}_i x}$
for
 $x>0$
, and the expectation
 $\mathbb{E}[X_i] = 1/{\lambda}_i$
. Given the rate parameters
 ${\lambda}_1,\ldots,{\lambda}_{|{\mathcal{N}}|}$
with
 ${\lambda}_i\neq {\lambda}_j$
for
 $i\neq j$
, the minimal rates for the sets
 ${\mathcal{N}}$
and
 $\mathcal{A}\subseteq {\mathcal{N}}$
are denoted as
 \begin{equation}{\lambda}_{{\mathfrak{n}}}=\min\{{\lambda}_i\mid i\in{\mathcal{N}}\} , \qquad {\lambda}_{{\mathfrak{a}}}=\min\{{\lambda}_j\mid j\in\mathcal{A}\} , \end{equation}
where  ${\mathfrak{n}}$
(or
 ${\mathfrak{a}}$
) denotes the index of the random variable
 $X_{{\mathfrak{n}}}$
(or
 $X_{{\mathfrak{a}}}$
) with minimal rate parameter in set
 ${\mathcal{N}}$
(or
 $\mathcal{A}$
). As the usual convention, we set
 $\prod_{i\in \mathcal{A}}c_i\,:\!=1$
for arbitrary
 $c_i$
when
 $\mathcal{A}$
is the empty set.
2. Generalized exponential mixtures
Throughout this paper we consider distributions of sums  $S_{\mathcal{N}} \,:\!= \sum_{i\in{\mathcal{N}}}X_i$
and
 $S_\mathcal{A} \,:\!= \sum_{i\in\mathcal{A}}X_i$
with some
 $\mathcal{A}\subseteq {\mathcal{N}}$
for random variables
 $X_i$
which satisfy the following:
Assumption 1. The random variables  $X_i\in {\textrm{Exp}}({\lambda}_i)$
,
 $i\in{\mathcal{N}}$
, are stochastically independent with pairwise distinct rate parameters
 ${\lambda}_i\neq{\lambda}_j$
for all
 $i\neq j$
.
Note that the setting with  ${\lambda}_i={\lambda}>0$
for all
 $i\in{\mathcal{N}}$
would result in an Erlang distribution for the sum of independent random variables. Assumption 1 with pairwise distinct
 ${\lambda}_i$
makes our analysis more challenging; it is posed in the current literature by, e.g., [Reference Bergel and Egídio dos Reis9, Reference Kordecki18, Reference McLachlan20, Reference Steutel25]. In Remark 3(ii) at the end of this section we indicate how to handle the case where the restriction for pairwise distinct parameters is relaxed, i.e. when some (or even all) rate parameters coincide.
Remark 1. Note that all results on sums  $S_{\mathcal{N}}$
would also be valid for linear combinations
 $\sum_{i\in{\mathcal{N}}} {\theta}_i Y_i$
of independent
 $Y_i\in {\textrm{Exp}}(\tilde{{\lambda}}_i)$
and coefficients
 ${\theta}_i>0$
,
 $i\in{\mathcal{N}}$
, when
 $\tilde{{\lambda}}_i {\theta}_j\neq\tilde{{\lambda}}_j {\theta}_i$
for all
 $i\neq j$
. The statements on linear combinations can be obtained by the linear transformation
 $X_i \,:\!={\theta}_i Y_i\in {\textrm{Exp}}({\lambda}_i)$
with
 ${\lambda}_i\,:\!=\tilde{{\lambda}}_i/{\theta}_i$
.
Before we present our findings, we summarize the established results on the convolution of exponentially distributed random variables.
Proposition 1. ([Reference Jasiulewicz and Kordecki14], Theorem 1.) Under Assumption 1, the sum  $S_{\mathcal{N}}=\sum_{i\in {\mathcal{N}}}X_i$
has density
 \begin{equation}{f_{S_\mathcal{N}}} (x)= \sum_{i\in {\mathcal{N}}} \pi_{i}{{\scriptscriptstyle(\mathcal{N})}\,} {\lambda}_{i} \,\textrm{e}^{-{\lambda}_{i}\, x} , \qquad x>0 , \end{equation}
with mixing proportions
 \begin{equation}\pi_{i}{{\scriptscriptstyle(\mathcal{N})}\,} \,:\!= \prod_{j\in {\mathcal{N}} \setminus \{i\}} \frac{{\lambda}_{j}}{{\lambda}_{j} -{\lambda}_{i}} \in({-}\infty,\infty) , \qquad i\in{\mathcal{N}} . \end{equation}
The sum  $S_{\mathcal{N}}$
with density (2) follows a GEM distribution as it allows, in contrast to a classical mixture, for mixing proportions of both positive and negative signs. As the mixing proportions depend on the underlying set
 ${\mathcal{N}}$
, we denote them by
 $\pi_{i}{{\scriptscriptstyle(\mathcal{N})}}$
. Note that a change of the underlying set could lead to a change of all mixing proportions, i.e. in general we have
 $\pi_{i}{{\scriptscriptstyle(\mathcal{N})}\,} \neq \pi_{i}{{\scriptscriptstyle(\mathcal{A})}}$
for all
 $i\in\mathcal{A}\subset {\mathcal{N}}$
.
Remark 2. Due to the density representation in (2), it follows that the mixing proportions sum to one:
 \begin{equation}\sum_{i\in {\mathcal{N}}} \pi_{i}{{\scriptscriptstyle(\mathcal{N})}\,}=1 , \end{equation}
where exactly  $\lfloor |{\mathcal{N}}|/2 \rfloor$
of the mixing proportions
 $\pi_{i}{{\scriptscriptstyle(\mathcal{N})}}$
are negative. More precisely, the mixing proportions alternate in sign when the rate parameters are ordered (which can be done without loss of generality) as
 ${\lambda}_1<{\lambda}_2<\cdots<{\lambda}_{|{\mathcal{N}}|}$
, then
 $\pi_{i}{{\scriptscriptstyle(\mathcal{N})}}$
is positive for odd and negative for even indices
 $i\in{\mathcal{N}}$
, as there are exactly
 $(i-1)$
negative denominators in (3).
After providing results for finite  $x>0$
, we establish the characteristic tail behavior of GEM distributions for
 $x\to\infty$
. In the next corollary we show that the random variable with the smallest parameter
 ${\lambda}_{\mathfrak{n}}$
, cf. (1), determines the asymptotics.
Corollary 1. Under Assumption 1, the survival function of  $S_{\mathcal{N}} =\sum_{i\in {\mathcal{N}}}X_i$
satisfies
 \begin{eqnarray*}\mathbb{P}(S_{\mathcal{N}} >x) &=& \sum_{i\in {\mathcal{N}}} \pi_{i}{{\scriptscriptstyle(\mathcal{N})}\,} \,\textrm{e}^{-{\lambda}_{i}\, x} , \qquad x>0 , \\ &\sim& \pi_{{\mathfrak{n}}}{{\scriptscriptstyle(\mathcal{N})}\,} \,\textrm{e}^{-{\lambda}_{{\mathfrak{n}}}\, x} \,\propto\, \mathbb{P}(X_{{\mathfrak{n}}}>x) \text{ for } x\to\infty . \end{eqnarray*}
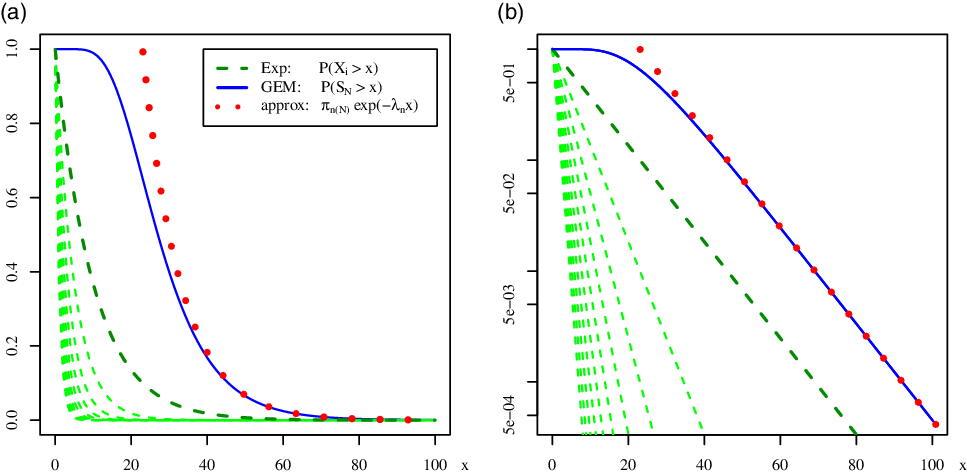
The statements of Proposition 1 and Corollary 1 are illustrated in Figure 1 where we show, first, the different shapes of the GEM and exponential survival functions for non-asymptotic regions, and second, how good the exponential distribution with the smallest tail parameter  ${\lambda}_{\mathfrak{n}}$
is for the asymptotic approximation of GEM.
(a) Survival functions of exponentially distributed  $X_i$
,
 $i=1,\ldots,10$
, with distinct rate parameters
 ${\lambda}_1=0.1, {\lambda}_2=0.2,\ldots,{\lambda}_{10}=1.0$
(dashed lines), and the function
 $\pi_{{\mathfrak{n}}}{{\scriptscriptstyle(\mathcal{N})}} \,\textrm{e}^{-{\lambda}_{{\mathfrak{n}}} x}$
(dotted line) with
 ${\mathfrak{n}}=1$
as an approximation of
 $\mathbb{P}(S_{\mathcal{N}} >x)$
(solid line); cf. Corollary 1. (b) Same functions as in (a) on a logarithmic vertical axis to illustrate that the approximating function (dotted line) has the same slope as the function of dominant
 $X_{\mathfrak{n}}$
(bold dashed line), both determined by the rate parameter
 ${\lambda}_{\mathfrak{n}}$
.

Similarly to the established result that phase-type distributions have asymptotic tails of Erlang distributions (cf. [Reference Asmussen, Nerman and Olsson5, Sect. 5.7]), our result in Corollary 1 states that the subclass of GEM distributions leads to asymptotic tails of exponential distributions. However, if we allow the tail parameters to coincide for different indices, then the distribution of  $S_{\mathcal{N}}$
has the asymptotic tail of an Erlang distribution, as discussed in the following remark.
Remark 3. Here we comment on the case of possibly equal rate parameters  ${\lambda}_i$
for some (or all) random variables
 $X_i$
,
 $i\in{\mathcal{N}}$
, where the following results hold.
(i) If the parameters
 ${\lambda}_{i}$
coincide for different values of i, then the distribution of
$S_{\mathcal{N}} =\sum_{i\in{\mathcal{N}}}X_i$
is no longer GEM. If, as a special case, we have
${\lambda}_{i}={\lambda}$
for all
$i\in{\mathcal{N}}$
, then
$S_{\mathcal{N}}$
is Erlang distributed. In general, if only some
${\lambda}_{i}$
coincide,
$S_{\mathcal{N}}$
follows a generalized Erlang mixture distribution, cf. [Reference Mathai21, Reference Moschopoulos22].
(ii) The results corresponding to Proposition 1 if
${\lambda}_{j}={\lambda}_{i}$
for some
$j\neq i$
can be obtained as limits for
${\lambda}_{j}\to{\lambda}_{i}$
. Consider, e.g., the case of two variables
$X_1$
and
$X_2$
where taking such a limit leads to an Erlang distribution as follows:
The asymptotic results in Corollary 1 for
\begin{align*} \lim_{{\lambda}_{2} \to{\lambda}_{1}} \mathbb{P}\big(X_1 + X_2 >x\big) &= \lim_{{\lambda}_{2} \to{\lambda}_{1}} \frac{{\lambda}_{2} \,\textrm{e}^{-{\lambda}_1 x} - {\lambda}_{1} \,\textrm{e}^{-{\lambda}_{2} x}}{{\lambda}_{2} -{\lambda}_{1}} \\ &= \lim_{{\lambda}_{2} \to{\lambda}_{1}} \big(\textrm{e}^{-{\lambda}_1 x}+{\lambda}_{1} x \,\textrm{e}^{-{\lambda}_{2} x}\big) = (1+{\lambda}_{1} x) \,\textrm{e}^{-{\lambda}_1 x} , \qquad x > 0 . \end{align*}
$x\to\infty$
give asymptotic tails of Erlang distribution with shape parameter
$q=|Q|$
, where the set
$Q\,:\!=\{i\in{\mathcal{N}} \mid {\lambda}_{i}= \min_{k\in{\mathcal{N}}}{\lambda}_k\}$
contains the indices of all variables with the smallest rate parameter. Hence, the value q is the number of asymptotically dominant random variables
$X_i$
with the smallest rate parameter.






3. Conditional distributions for GEM sums and a selected exponential random variable
Now we provide our novel results on the conditional distribution for the sum  $S_{\mathcal{N}} =\sum_{i\in{\mathcal{N}}}X_i$
given that some element
 $X_j$
exceeds a certain threshold value, as well as, conversely, on the conditional distribution for
 $X_j$
given that
 $S_{\mathcal{N}}$
exceeds some threshold. In the next theorem we deduce the conditional probabilities which illustrate both the finite and asymptotic influence of
 $X_j$
on the sum
 $S_{\mathcal{N}}$
.
Theorem 1. Under Assumption 1, given that  $X_j>x>0$
for some
 $j\in{\mathcal{N}}$
, the conditional probabilities for
 $S_{\mathcal{N}}=\sum_{i\in {\mathcal{N}}}X_i$
satisfy
(i) for finite
$s>x$
:
\begin{equation*}\mathbb{P}(S_{\mathcal{N}} > s \mid X_j >x) \;\,=\;\, \mathbb{P}(S_{\mathcal{N}}> s-x) \;\, =\;\, \sum_{i\in{\mathcal{N}}} {\pi}_{i}{{\scriptscriptstyle(\mathcal{N})}\,} \,\textrm{e}^{-{\lambda}_i (s-x)} ;\end{equation*}
(ii) asymptotically for
$x\to\infty$
and some positive function s(x) with
$s(x) - x \to \infty$
:
with
\begin{equation*}\mathbb{P}(S_{\mathcal{N}} >s(x) \mid X_j >x) \;\sim\; {\pi}_{{\mathfrak{n}}}{{\scriptscriptstyle(\mathcal{N})}\,} \,\textrm{e}^{- {\lambda}_{{\mathfrak{n}}} (s(x)-x)} \; \propto \; \mathbb{P}(X_{{\mathfrak{n}}}>s(x)-x),\end{equation*}
${\mathfrak{n}}$
as in (1).


Throughout this paper we exclude trivial cases where the corresponding conditional probability is equal to 1. For example, in Theorem 1 we only consider  $s > x$
. Note also that the asymptotically dominant random variable
 $X_{\mathfrak{n}}$
has the largest expectation of all
 $X_i$
for
 $i\in{\mathcal{N}}$
.
Note that in Theorem 1(ii) one can use any function s(x) which increases faster than the identity function  $s(x)=x$
. For example, for the important case of a linear function we obtain asymptotically, for
 $x\to\infty$
and some
 $\alpha>1$
,
 \begin{equation*} \mathbb{P}(S_{\mathcal{N}} >\alpha x \mid X_j >x) \;\sim\; {\pi}_{{\mathfrak{n}}}{{\scriptscriptstyle(\mathcal{N})}\,} \,\textrm{e}^{- (\alpha-1){\lambda}_{{\mathfrak{n}}} x} \; \propto \; \mathbb{P}(X_{{\mathfrak{n}}}>(\alpha-1)x).\end{equation*}
Remark 4. The results of Theorem 1(i) reveal the following interesting features. The conditional distribution of the sum  $S_{\mathcal{N}}=\sum_{i\in {\mathcal{N}}}X_i$
, given some
 $X_j$
,
 $j\in {\mathcal{N}}$
,
(a) is equal to the shifted unconditional distribution of
$S_{\mathcal{N}}$
;(b) is independent of the specific index j of the variable we condition on;
(c) depends only on the difference
$s-x$
of the threshold values.


In particular, points (a) and (c) display a certain no-memory property of GEM distributions by conditioning on a single exponential random variable.
Next, we present the complementary result to Theorem 1 with conditioning on the sum  $S_{\mathcal{N}} >s$
.
Proposition 2. Under Assumption 1, given that  $S_{\mathcal{N}} =\sum_{i\in {\mathcal{N}}}X_i>s>0$
, the conditional probabilities for
 $X_j$
,
 $j\in{\mathcal{N}}$
, satisfy
(i) for finite
$s>x>0$
:
and for finite
\begin{eqnarray*}\mathbb{P}(X_j>x \mid S_{\mathcal{N}} >s) &=& \frac{\mathbb{P}(X_j >x)\, \mathbb{P}(S_{\mathcal{N}} >s-x)}{\mathbb{P}(S_{\mathcal{N}}>s)}\\&=& \,\textrm{e}^{- {\lambda}_j x}\, \frac{\sum_{i\in{\mathcal{N}}} {\pi}_{i}{{\scriptscriptstyle(\mathcal{N})}\,} \,\textrm{e}^{- {\lambda}_i (s-x)}}{\sum_{i\in{\mathcal{N}}} {\pi}_{i}{{\scriptscriptstyle(\mathcal{N})}\,} \,\textrm{e}^{-{\lambda}_i s}},\end{eqnarray*}
$x\geq s$
:
\begin{eqnarray*}\mathbb{P}(X_j>x \mid S_{\mathcal{N}} >s) &=& \frac{\mathbb{P}(X_j >x)}{\mathbb{P}(S_{\mathcal{N}}>s)} \,=\, \frac{\,\textrm{e}^{- {\lambda}_j x}}{\sum_{i\in{\mathcal{N}}} {\pi}_{i}{{\scriptscriptstyle(\mathcal{N})}\,} \,\textrm{e}^{-{\lambda}_i s}};\end{eqnarray*}
(ii) asymptotically for
$s\to\infty$
and some positive function x(s) with
$x(s)\to\infty$
:• if
$s-x(s)\to\infty$
:
\begin{equation*}\mathbb{P}(X_j>x(s) \mid S_{\mathcal{N}} >s) \;\sim\; \,\textrm{e}^{-({\lambda}_j-{\lambda}_{{\mathfrak{n}}}) x(s)}\; =\; \frac{\mathbb{P}(X_j >x(s))}{\mathbb{P}(X_{{\mathfrak{n}}}>x(s))},\end{equation*}
• if
$s-x(s)\to-\infty$
:
\begin{equation*}\mathbb{P}(X_j>x(s) \mid S_{\mathcal{N}} >s) \;\sim\; \frac{\,\textrm{e}^{-({\lambda}_j x(s)-{\lambda}_{{\mathfrak{n}}} s)}}{{\pi}_{{\mathfrak{n}}}{{\scriptscriptstyle(\mathcal{N})}\,}}\; \propto\; \frac{\mathbb{P}(X_j >x(s))}{\mathbb{P}(X_{{\mathfrak{n}}}> s)},\end{equation*}
• if
$s-x(s)\to c\in({-}\infty,\infty)$
:
with
\begin{equation*}\mathbb{P}(X_j>x(s) \mid S_{\mathcal{N}} >s) \;\sim\; K_c \,\textrm{e}^{-({\lambda}_j-{\lambda}_{{\mathfrak{n}}}) s}\; \propto\; \frac{\mathbb{P}(X_j >s)}{\mathbb{P}(X_{{\mathfrak{n}}}> s)},\end{equation*}
$K_c \,:\!=\textrm{e}^{{\lambda}_j c}/{\pi}_{{\mathfrak{n}}}{{\scriptscriptstyle(\mathcal{N})}}$
for
$c\leq 0$
and
$K_c \,:\!=\sum_{i\in{\mathcal{N}}} {\pi}_{i}{{\scriptscriptstyle(\mathcal{N})}} \,\textrm{e}^{- ({\lambda}_i-{\lambda}_j) c}/{\pi}_{{\mathfrak{n}}}{{\scriptscriptstyle(\mathcal{N})}}$
for
$c>0$
, and with
${\mathfrak{n}}$
as in (1).











In Proposition 2 we show that  $\mathbb{P}(X_j>x \mid S_{\mathcal{N}}>s)$
depends (even asymptotically) on the distribution of the particular random variable
 $X_j$
, in contrast to the counterpart
 $\mathbb{P}(S_{\mathcal{N}}>s \mid X_j>x)$
investigated in Theorem 1.
For the special case of linear functional dependence between the lower thresholds for sum  $S_{\mathcal{N}}$
and variable
 $X_j$
, we obtain asymptotically, for
 $s\to\infty$
and
 $0<\beta<1$
,
 \begin{equation*} \mathbb{P}(X_j>\beta s \mid S_{\mathcal{N}} >s) \;\sim\; \,\textrm{e}^{-({\lambda}_j-{\lambda}_{{\mathfrak{n}}}) \beta s}\; =\; \frac{\mathbb{P}(X_j >\beta s)}{\mathbb{P}(X_{{\mathfrak{n}}}>\beta s)} , \end{equation*}
and, for  $\beta\geq 1$
,
 \begin{equation*} \mathbb{P}(X_j>\beta s \mid S_{\mathcal{N}} >s) \;\sim\; \frac{\,\textrm{e}^{-(\beta {\lambda}_j-{\lambda}_{{\mathfrak{n}}}) s}}{{\pi}_{{\mathfrak{n}}}{{\scriptscriptstyle(\mathcal{N})}\,}}\; \propto\; \frac{\mathbb{P}(X_j >\beta s)}{\mathbb{P}(X_{{\mathfrak{n}}}> s)} . \end{equation*}
Remark 5. Theorem 1 and Proposition 2 point out the following characteristic properties of the conditional distributions under consideration:
• The distribution of
$S_{\mathcal{N}}$
contains all information to quantify the influence of the random variables
$X_j$
on the sum. This holds not only asymptotically for large
$X_j$
, but also exactly for all
$s,x>0$
as
$\mathbb{P}(S_{\mathcal{N}}>s \mid X_j>x) = \mathbb{P}(S_{\mathcal{N}}>s-x)$
.• The above-mentioned no-memory property allows for a simple quantification of the influence of a single random variable on the aggregated sum, as it is given immediately by the distribution of the sum. Thereby, it is irrelevant which particular random variable
$X_j$
we condition on.• By conditioning on
$\{S_{\mathcal{N}} >s\}$
, Proposition 2 states that
Hence, this statement involves only marginal distributions of
\begin{equation*}\mathbb{P}(X_j>x \mid S_{\mathcal{N}} >s) = \mathbb{P}(X_j >x)\, \frac{\mathbb{P}(S_{\mathcal{N}}>s-x)}{\mathbb{P}(S_{\mathcal{N}}>s)} , \qquad s> x>0 . \end{equation*}
$S_{\mathcal{N}}$
and
$X_j$
but not their joint distribution.• The qualitative difference between the probability
$\mathbb{P}(S_{\mathcal{N}}>s \mid X_j>x)$
and its counterpart
$\mathbb{P}(X_j>x \mid S_{\mathcal{N}}>s)$
is based on the following intuition: the event
$\{S_{\mathcal{N}}>s\}$
does not specify which random variables
$X_j$
cause a threshold exceedance. Such events may comprise very different scenarios for possible realizations of random variables
$X_1,\ldots,X_{|{\mathcal{N}}|}$
, for example scenarios with a few large realizations as well as scenarios where none of the realizations is large but the sum
$S_{\mathcal{N}}$
exceeds a high threshold merely by a cumulation effect.









4. Conditional distributions for GEM sums
We generalize the results from the previous section by providing expressions for conditional distributions of the total sum  $S_{\mathcal{N}} =\sum_{i\in{\mathcal{N}}}X_i$
and the subset sum
 $S_\mathcal{A} =\sum_{j\in \mathcal{A}}X_j$
for some
 ${\mathcal{A}\subseteq {\mathcal{N}}}$
.
Theorem 2. Under Assumption 1, given that the subset sum  $S_\mathcal{A} =\sum_{j\in \mathcal{A}}X_j>t>0$
, for each subset
 $\mathcal{A}\subseteq {\mathcal{N}}$
the conditional probabilities for the total sum
 $S_{\mathcal{N}}=\sum_{i\in {\mathcal{N}}}X_i$
satisfy:
(i) for finite
$s>t$
:
with
\begin{align*}\mathbb{P}\big(S_{\mathcal{N}}> s \mid S_\mathcal{A} >t\big) &= \frac{\sum_{j\in\mathcal{A}} {\pi}_{j}{{\scriptscriptstyle(\mathcal{A})}\,} \mathbb{P}(X_j>t) \mathbb{P}\big(\!\sum_{k\in \mathcal{A}_j^{\star}} X_k > s-t\big)}{\sum_{j\in\mathcal{A}} {\pi}_{j}{{\scriptscriptstyle(\mathcal{A})}\,} \mathbb{P}(X_j>t)}\\&= \frac{\sum_{j\in\mathcal{A}} \sum_{k\in \mathcal{A}_j^{\star}} {\pi}_{j}{{\scriptscriptstyle(\mathcal{A})}\,} {\pi}_{k}{\scriptscriptstyle(\mathcal{A}_j^{\star})} \,\textrm{e}^{- ({\lambda}_j -{\lambda}_k) t- {\lambda}_k s}}{\sum_{j\in\mathcal{A}} {\pi}_{j}{{\scriptscriptstyle(\mathcal{A})}} \,\textrm{e}^{-{\lambda}_j t}} , \end{align*}
$\mathcal{A}_j^{\star}\,:\!=({\mathcal{N}}\setminus\mathcal{A})\cup\{j\}$
;(ii) asymptotically for
$t\to\infty$
and some positive function s(t) with
$s(t) - t \to \infty$
:with
\begin{equation*}\mathbb{P}(S_{\mathcal{N}}>s(t) \mid S_\mathcal{A} >t) \,\sim\, {\pi}_{{\mathfrak{n}}}{\scriptscriptstyle(\mathcal{A}_{{\mathfrak{a}}}^{\star})}\, \,\textrm{e}^{- {\lambda}_{{\mathfrak{n}}} (s(t)-t)} \; \propto\; \frac{\mathbb{P}(X_{{\mathfrak{n}}} >s(t))}{\mathbb{P}(X_{{\mathfrak{n}}}> t)},\end{equation*}
$\mathcal{A}_j^{\star}\,:\!=({\mathcal{N}}\setminus\mathcal{A})\cup\{j\}$
and
${\mathfrak{n}}, {\mathfrak{a}}$
as in (1).







In the results of Theorem 2 we use mixing proportions  $\pi_{j}{{\scriptscriptstyle(\mathcal{A})}}$
or
 $\pi_{k}{\scriptscriptstyle(\mathcal{A}_j^{\star})}$
based on subsets
 $\mathcal{A}\subseteq {\mathcal{N}}$
or
 $\mathcal{A}_j^{\star}\subseteq {\mathcal{N}}$
, respectively. They are defined analogously to those in (3) based on
 ${\mathcal{N}}$
. Moreover, these mixing proportions based on two sets with a single element in common are related to each other as stated in the next remark.
Remark 6. Let  $\mathcal{A}_1,\mathcal{A}_2\subseteq{\mathcal{N}}$
be such that
 $\mathcal{A}_1 \cap \mathcal{A}_2=\{j\}$
for some
 $j\in{\mathcal{N}}$
. Then
 \begin{equation}{\pi}_{j}{\scriptscriptstyle(\mathcal{A}_1)}\cdot {\pi}_{j}{\scriptscriptstyle(\mathcal{A}_2)}\;=\;{\pi}_{j}{\scriptscriptstyle(\mathcal{A}_1\cup\mathcal{A}_2)} . \end{equation}
In particular, for the mixing proportions in Theorem 2 we have
 \begin{equation*} {\pi}_{j}{{\scriptscriptstyle(\mathcal{A})}} \cdot {\pi}_{j}{\scriptscriptstyle(\mathcal{A}_j^{\star})} \;=\; {\pi}_{j}{{\scriptscriptstyle(\mathcal{A})}}\cdot {\pi}_{j}{\scriptscriptstyle(({\mathcal{N}}\setminus\mathcal{A}) \cup \{j\})}\;=\;{\pi}_{j}{{\scriptscriptstyle(\mathcal{N})}\,} \qquad \text{for all } j\in\mathcal{A} . \end{equation*}
The complementary result to Theorem 2 is given next.
Proposition 3. Under Assumption 1, given that the total sum  $S_{\mathcal{N}} =\sum_{i\in {\mathcal{N}}}X_i>s>0$
, for each
 $\mathcal{A}\subseteq {\mathcal{N}}$
the conditional probabilities for the subset sum
 $S_\mathcal{A} =\sum_{j\in \mathcal{A}}X_j$
satisfy:
(i) for finite
$s>t>0$
:
and for finite
\begin{eqnarray*}\mathbb{P}\big(S_\mathcal{A}> t \mid S_{\mathcal{N}} >s\big) &\,=\,& \frac{\sum_{j\in\mathcal{A}} {\pi}_{j}{{\scriptscriptstyle(\mathcal{A})}\,} \mathbb{P}\left(X_j>t\right) \mathbb{P}\left(\!\sum_{k\in\mathcal{A}_j^{\star}} X_k > s-t\!\right)}{\sum_{i\in{\mathcal{N}}} {\pi}_{i}{{\scriptscriptstyle(\mathcal{N})}\,} \mathbb{P}(X_i>s)}\\&\,=\,& \frac{\sum_{j\in\mathcal{A}} \sum_{k\in\mathcal{A}_j^{\star}} {\pi}_{j}{{\scriptscriptstyle(\mathcal{A})}\,} {\pi}_{k}{\scriptscriptstyle(\mathcal{A}_j^{\star})} \,\textrm{e}^{- ({\lambda}_j -{\lambda}_k) t- {\lambda}_k s}}{\sum_{i\in{\mathcal{N}}} {\pi}_{i}{{\scriptscriptstyle(\mathcal{N})}\,} \,\textrm{e}^{-{\lambda}_i s}} , \end{eqnarray*}
$t\geq s$
:
with
\begin{eqnarray*}\mathbb{P}(S_\mathcal{A}> t \mid S_{\mathcal{N}} >s) &=& \frac{\sum_{j\in\mathcal{A}} {\pi}_{j}{{\scriptscriptstyle(\mathcal{A})}\,} \mathbb{P}\left(X_j>t\right)}{\sum_{i\in{\mathcal{N}}} {\pi}_{i}{{\scriptscriptstyle(\mathcal{N})}\,} \mathbb{P}(X_i>s)} = \frac{\sum_{j\in\mathcal{A}} {\pi}_{j}{{\scriptscriptstyle(\mathcal{A})}\,} \,\textrm{e}^{- {\lambda}_j t}}{\sum_{i\in{\mathcal{N}}} {\pi}_{i}{{\scriptscriptstyle(\mathcal{N})}\,} \,\textrm{e}^{-{\lambda}_i s}} , \end{eqnarray*}
$\mathcal{A}_j^{\star}\,:\!=({\mathcal{N}}\setminus\mathcal{A})\cup\{j\}$
;(ii) asymptotically for
$s\to\infty$
and some positive function t(s) with
$t(s)\to\infty$
:• if
$s-t(s)\to\infty$
:
which reduces in the special case
\begin{equation*}\mathbb{P}\big(S_\mathcal{A} >t(s) \mid S_{\mathcal{N}} >s\big) \,\sim\, \!\!\!\prod_{k\in \mathcal{A}\setminus\{{\mathfrak{a}}\}}\! \frac{{\lambda}_k -{\lambda}_{\mathfrak{n}}}{{\lambda}_k -{\lambda}_{{\mathfrak{a}}}}\, \,\textrm{e}^{-({\lambda}_{{\mathfrak{a}}}-{\lambda}_{\mathfrak{n}}) t(s)}\; \propto\; \frac{\mathbb{P}(X_{{\mathfrak{a}}} >t(s))}{\mathbb{P}(X_{{\mathfrak{n}}}> t(s))},\end{equation*}
${\mathfrak{a}}={\mathfrak{n}}$
to
$\mathbb{P}\big(S_\mathcal{A}>t(s) \mid S_{\mathcal{N}} >s\big) \,\to\, 1$
;• if
$s-t(s)\to-\infty$
:
\begin{equation*}\mathbb{P}\big(S_\mathcal{A}>t(s) \mid S_{\mathcal{N}} >s\big) \,\sim\, \frac{{\pi}_{{\mathfrak{a}}}{{\scriptscriptstyle(\mathcal{A})}\,}}{{\pi}_{{\mathfrak{n}}}{{\scriptscriptstyle(\mathcal{N})}\,}} \,\textrm{e}^{- \left({\lambda}_{{\mathfrak{a}}} t(s)-{\lambda}_{{\mathfrak{n}}} s\right)}\; \propto\; \frac{\mathbb{P}(X_{{\mathfrak{a}}} >t(s))}{\mathbb{P}(X_{{\mathfrak{n}}}> s)};\end{equation*}
• if
$s-t(s)\to c\in({-}\infty,\infty)$
:
with
\begin{equation*}\mathbb{P}\big(S_\mathcal{A} >t(s) \mid S_{\mathcal{N}} >s\big) \,\sim\, K_c \,\textrm{e}^{-({\lambda}_{{\mathfrak{a}}}-{\lambda}_{{\mathfrak{n}}}) s}\; \propto\; \frac{\mathbb{P}(X_{{\mathfrak{a}}} >s)}{\mathbb{P}(X_{{\mathfrak{n}}}> s)},\end{equation*}
$K_c \,:\!={\pi}_{{\mathfrak{a}}}{{\scriptscriptstyle(\mathcal{A})}\,} \textrm{e}^{{\lambda}_{{\mathfrak{a}}} c}/{\pi}_{{\mathfrak{n}}}{{\scriptscriptstyle(\mathcal{N})}}$
for
$c\leq 0$
and
$K_c \,:\!={\pi}_{{\mathfrak{a}}}{{\scriptscriptstyle(\mathcal{A})}} \sum_{k\in\mathcal{A}_{{\mathfrak{a}}}^{\star}} {\pi}_{k}{\scriptscriptstyle(\mathcal{A}_{{\mathfrak{a}}}^{\star})} \textrm{e}^{- ({\lambda}_k-{\lambda}_{{\mathfrak{a}}}) c}/{\pi}_{{\mathfrak{n}}}{{\scriptscriptstyle(\mathcal{N})}}$
for
$c>0$
, and with
$\mathcal{A}_j^{\star}\,:\!=({\mathcal{N}}\setminus\mathcal{A})\cup\{j\}$
,
${\mathfrak{n}}$
,
${\mathfrak{a}}$
as in (1).

















For the special case that  $\mathcal{A}={\mathcal{N}}$
, the results in Theorem 2 can be simplified by applying the no-memory property of the exponential distribution:
Corollary 2. Under Assumption 1:
(i) for finite
$s>t>0$
:
\begin{align*}\mathbb{P}\big(S_{\mathcal{N}}> s \mid S_{\mathcal{N}} >t\big) &= \frac{\sum_{i\in{\mathcal{N}}} {\pi}_{i}{{\scriptscriptstyle(\mathcal{N})}\,} \mathbb{P}(X_i>t) \mathbb{P}(X_i > s-t)}{\sum_{i\in{\mathcal{N}}} {\pi}_{i}{{\scriptscriptstyle(\mathcal{N})}\,} \mathbb{P}(X_i>t)} \\&= \frac{\sum_{i\in{\mathcal{N}}} {\pi}_{i}{{\scriptscriptstyle(\mathcal{N})}\,} \mathbb{P}(X_i>s)}{\sum_{i\in{\mathcal{N}}} {\pi}_{i}{{\scriptscriptstyle(\mathcal{N})}\,} \mathbb{P}(X_i>t)}=\frac{\sum_{i\in{\mathcal{N}}} {\pi}_{i}{{\scriptscriptstyle(\mathcal{N})}\,} \,\textrm{e}^{-{\lambda}_i s}}{\sum_{i\in{\mathcal{N}}} {\pi}_{i}{{\scriptscriptstyle(\mathcal{N})}\,} \,\textrm{e}^{-{\lambda}_i t}} ; \end{align*}
(ii) asymptotically for
$t\to\infty$
and some positive function s(t) with
$s(t) - t \to \infty$
:
\begin{equation*}\mathbb{P}(S_{\mathcal{N}}>s(t) \mid S_{\mathcal{N}} >t) \,\sim\, \,\textrm{e}^{- {\lambda}_{{\mathfrak{n}}} (s(t)-t)}\; \propto\; \frac{\mathbb{P}(X_{{\mathfrak{n}}} >s(t))}{\mathbb{P}(X_{{\mathfrak{n}}}> t)}.\end{equation*}


Differently to Theorem 1(i), where the no-memory property for GEM holds given that a single component exceeds some finite threshold, in Corollary 2(ii) the no-memory feature holds only asymptotically. Moreover, this corollary proves that the GEM distribution of sum  $S_{\mathcal{N}}$
belongs to the class of type-
 $\Gamma$
distributions which satisfy the gamma variation property:
 \begin{equation*} \lim_{t \to \infty}{\frac{\mathbb{P}(S_{\mathcal{N}} > t + z \psi (t))}{\mathbb{P}(S_{\mathcal{N}} > t)}} = \textrm{e}^{-z}\end{equation*}
for all  $0<z<\infty$
and some positive auxiliary function
 $\psi$
. More precisely, the result in Corollary 2(i) implies that the auxiliary function can be the constant
 $\psi\equiv 1/{\lambda}_{{\mathfrak{n}}}$
; for a detailed analysis of type-
 $\Gamma$
distributions and their relevance in the field of extreme value theory see, e.g., [Reference Barbe and Seifert6, Reference Seifert24].
Our results on conditional distributions for sums and subset sums of exponential variables might also be of interest for the analysis of phase-type distributions, as they are important representatives of this class.
5. Illustrative examples
Now we illustrate the practical relevance of the results presented in the previous sections. In the following we concentrate on the total average  $\bar{S}_{\mathcal{N}}\,:\!=(1/|{\mathcal{N}}|)\,\sum_{i\in{\mathcal{N}}}X_i$
taken over all elements in the system
 ${\mathcal{N}}$
, and the subset average
 $\bar{S}_\mathcal{A}\,:\!=(1/|\mathcal{A}|)\sum_{j\in\mathcal{A}}X_j$
taken over some subset
 $\mathcal{A}\subset{\mathcal{N}}$
. Our setting is determined by the cardinality
 $|\mathcal{A}|$
of the subset compared to the total number
 $|{\mathcal{N}}|$
of system elements, as well as by the rate parameters
 ${\lambda}_j$
for
 $j\in\mathcal{A}$
and
 ${\lambda}_i$
for
 $i\in{\mathcal{N}}$
. In particular, the smallest rate parameter
 ${\lambda}_{{\mathfrak{a}}}$
in the subset is of interest; more precisely, whether
 ${\mathfrak{a}}={\mathfrak{n}}$
or
 ${\mathfrak{a}}\neq{\mathfrak{n}}$
, with
 ${\mathfrak{a}}$
and
 ${\mathfrak{n}}$
defined in (1). First, we show how the statements in Theorems 1 and 2 help to gain interesting results concerning conditional distributions of these averages.
Proposition 4. Under Assumption 1, the conditional probabilities of the total average given the subset average are asymptotically proportional for all subsets  $\mathcal{A}\subseteq{\mathcal{N}}$
of the same cardinality:
 \begin{equation*}\mathbb{P}\big(\bar{S}_{\mathcal{N}}>\alpha t \big| \bar{S}_\mathcal{A} >t\big) \,\sim\, C(\mathcal{A}) \,\textrm{e}^{- (\alpha|{\mathcal{N}}|/|\mathcal{A}|-1){\lambda}_{\mathfrak{n}} t} \qquad \text{ for } \alpha>|\mathcal{A}|/|{\mathcal{N}}| , \ t\to\infty,\end{equation*}
with positive constants  $C(\mathcal{A})=\prod_{k\in \mathcal{A}_{{\mathfrak{a}},{\mathfrak{n}}}^{\star}} {\lambda}_k / ({\lambda}_k-{\lambda}_{\mathfrak{n}})$
, where
 $\mathcal{A}_{{\mathfrak{a}},{\mathfrak{n}}}^{\star}\,:\!= (({\mathcal{N}}\setminus\mathcal{A})\cup\{{\mathfrak{a}}\})\setminus\{{\mathfrak{n}}\}$
. Moreover, for
 $\mathcal{A}_1 \subset \mathcal{A}_2$
we have
 $C(\mathcal{A}_1) > C(\mathcal{A}_2)$
. Hence, the constants
 $C(\mathcal{A})$
decrease strictly monotonically from the value
 $C(\{{\kern1pt}j\})=\pi_{{\mathfrak{n}}}{{\scriptscriptstyle(\mathcal{N})}}>1$
for one-element subsets down to
 $C({\mathcal{N}})=1$
for the total system average.
The asymptotic result in Proposition 4 applies, for instance, in a situation where only partial information is available. Let a manufacturing company exploit  $|{\mathcal{N}}|$
different machines with (yearly) preventive maintenance times
 $X_i$
for
 $i=1,\ldots,|{\mathcal{N}}|$
, so that these maintenance times can be modeled as independent Exp
 $({\lambda}_i)$
random variables with
 ${\lambda}_i\neq {\lambda}_j$
for
 $i\neq j$
. Assume that in some subsidiary with
 $|\mathcal{A}|$
machines the subset average maintenance time
 $(1/|\mathcal{A}|)\sum_{j\in\mathcal{A}}X_j$
exceeds a high threshold t in the current year. The statement in Proposition 4 allows us to quantify the conditional probability of whether the total average maintenance time
 $(1/|{\mathcal{N}}|)\sum_{i\in{\mathcal{N}}}X_i$
for the whole company exceeds the value
 $\alpha t$
. Such statements are important for optimizing the maintenance schedule with respect to the most efficient allocation of the company’s resources.
The asymptotic statements in the next theorem allow us to compare the probabilities that either the total system average or a subset average exceeds a high threshold  $\beta s$
, given that the total system average
 $\bar{S}_{\mathcal{N}}$
exceeds a threshold s. This is the complementary result to Proposition 4. In particular, we contrast the conditional probabilities for averages based either on a concentrated (C) subset
 $\mathcal{A}\subset{\mathcal{N}}$
or on the diversified (D) total set
 ${\mathcal{N}}$
, and establish conditions when one of these probabilities is of a smaller asymptotic order
 $o(\cdot)$
than the other.
Theorem 3. Under Assumption 1, the conditional probabilities for concentrated (C) and diversified (D) subset averages, given that the total average  $\bar{S}_{{\mathcal{N}}}>s$
, namely
 \begin{equation*}\mathbb{P}_{\textrm{C}} (s) \,:\!= \mathbb{P}\big(\bar{S}_\mathcal{A} >\beta s \big| \bar{S}_{{\mathcal{N}}}>s\big), \qquad \mathbb{P}_{\textrm{D}}(s) \,:\!= \mathbb{P}\big(\bar{S}_{\mathcal{N}} >\beta s \big| \bar{S}_{{\mathcal{N}}}>s\big)\end{equation*}
for some  $\mathcal{A}\subset {\mathcal{N}}$
and
 ${\mathfrak{n}}, {\mathfrak{a}}$
as in (1), fulfill, for
 $s\to\infty$
, the following statements:
 \begin{eqnarray*} \mathbb{P}_{\textrm{C}}(s)\; =\; o(\mathbb{P}_{\textrm{D}}(s)) &\;\Leftrightarrow\;& {\lambda}_{{\mathfrak{a}}}/{\lambda}_{\mathfrak{n}}\; >\; R_{\beta}, \\ \mathbb{P}_{\textrm{C}}(s)\; \sim \;\; k_{\beta} \mathbb{P}_{\textrm{D}}(s) &\;\Leftrightarrow\;& {\lambda}_{{\mathfrak{a}}}/{\lambda}_{\mathfrak{n}}\; =\; R_{\beta},\\ \mathbb{P}_{\textrm{D}}(s) \; =\; o(\mathbb{P}_{\textrm{C}}(s)) &\;\Leftrightarrow\;& {\lambda}_{{\mathfrak{a}}}/{\lambda}_{\mathfrak{n}}\; <\; R_{\beta}, \end{eqnarray*}
whereby the boundary  $R_{\beta}$
is given as
 \begin{equation*} R_{\beta} = \begin{cases} 1, & \textit{ if } 0\,<\,\beta\, \leq \, 1\,,\\ 1+(\beta-1)|{\mathcal{N}}|/(\beta|\mathcal{A}|), & \textit{ if } 1\, <\, \beta\,
< \, |{\mathcal{N}}|/|\mathcal{A}|\,,\\ |{\mathcal{N}}|/|\mathcal{A}| & \textit{ if } \beta\, \geq\, |{\mathcal{N}}|/|\mathcal{A}| ,\end{cases}\end{equation*}
and the corresponding constants  $k_{\beta}\,:\!=1$
for
 $0<\beta\leq 1$
,
 $k_{\beta}\,:\!=\prod_{k\in \mathcal{A}\setminus\{{\mathfrak{a}}\}} ({\lambda}_k -{\lambda}_{\mathfrak{a}})/({\lambda}_k -{\lambda}_{{\mathfrak{n}}})$
for
 $1<\beta < |{\mathcal{N}}|/|\mathcal{A}|$
and
 $k_{\beta}\,:\!={\pi}_{{\mathfrak{n}}}{{\scriptscriptstyle(\mathcal{N})}\,}/{\pi}_{{\mathfrak{a}}}{{\scriptscriptstyle(\mathcal{A})}}$
for
 $\beta \geq |{\mathcal{N}}|/|\mathcal{A}|$
.
Theorem 3 quantifies in terms of the ratio  ${\lambda}_{{\mathfrak{a}}}/{\lambda}_{\mathfrak{n}}$
whether the asymptotic conditional probability for a subset average becomes negligible compared to that for the total average. More precisely, concentration on subset
 $\mathcal{A}$
leads to a conditional probability of a smaller order compared to taking the average over all random variables if and only if the corresponding condition in Theorem 3 is satisfied.
For example, this result proves to be useful in a system with  $|{\mathcal{N}}|$
risky investments, where the investor should decide whether to build a diversified (D) portfolio with a large number of investments included, or to concentrate (C) on a portfolio based on a subset
 $\mathcal{A}\subset{\mathcal{N}}$
of carefully selected investment opportunities. The relations between the conditional probabilities for the average concentrated (C) and diversified (D) portfolio losses in a financial stress situation with a large system loss are stated in Theorem 3.
The results of Theorem 3 indicate that construction of a diversified portfolio should be preferred for investments  $X_i$
from similar risk classes characterized by numerically similar rate parameters
 ${\lambda}_i$
,
 $i\in{\mathcal{N}}$
. However, in a system where the investments
 $X_i$
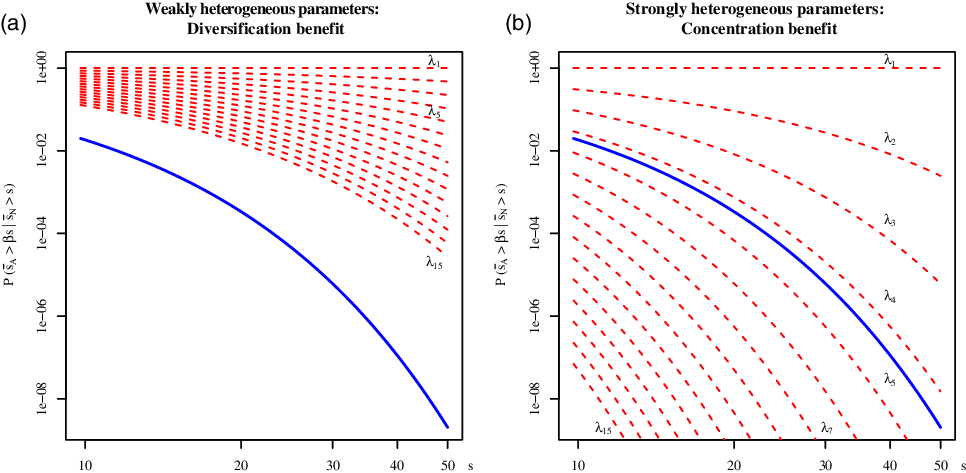
have strongly heterogeneous rate parameters, concentrating on a few objects identified by the criterion in Theorem 3 is advantageous in view of minimizing the probability of a large portfolio loss given a high system loss. We demonstrate this effect in the following example, which is visualized in Figure 2.
Log–log comparison of conditional probabilities for 15 totally concentrated subsets based on single elements  $\mathcal{A}\in\{\{1\}, \ldots,\{15\}\}$
(dashed lines) and for the system average based on the set
 ${\mathcal{N}}=\{1,\ldots,15\}$
(solid line) with
 $\beta=9$
. (a) Scenario with weakly heterogeneous rate parameters
 ${\lambda}_i$
. (b) Scenario with strongly heterogeneous rate parameters
 ${\lambda}_i$
. See Example 1.

Example 1. For independent exponential risk variables  $X_i$
,
 $i\in{\mathcal{N}}=\{1,\ldots,15\}$
, we compare the conditional survival functions based on the 15 one-element risks and that for the total risk average
 $\bar S_{{\mathcal{N}}}$
for two different scenarios:
(a) weakly heterogeneous rate parameters:
$({\lambda}_1,{\lambda}_2,\ldots,{\lambda}_{15})=(0.05, 0.075, \ldots, 0.4)$
,(b) strongly heterogeneous rate parameters:
$({\lambda}_1,{\lambda}_2,\ldots,{\lambda}_{15})=(0.05, 0.25, \ldots, 2.85)$
.


Both scenarios are comparable as the asymptotically dominant (i.e. the smallest) rate parameter takes the same value  ${\lambda}_{\mathfrak{n}}=0.05$
in (a) and (b).
In Figure 2 we plot for  $\beta=9$
the survival functions
 $\mathbb{P}(\bar{S}_\mathcal{A} >\beta x \mid \bar{S}_{\mathcal{N}} >x)$
for 15 concentrated single-object subsets
 $\bar{S}_\mathcal{A} = X_j$
for
 $\mathcal{A}=\{j\}$
,
 $j=1,\ldots,15$
(dashed lines), and for the system average
 $\bar{S}_\mathcal{A} =(1/|{\mathcal{N}}|)\sum_{i\in{\mathcal{N}}}X_i$
for
 $\mathcal{A}={\mathcal{N}}$
(solid line). This illustrates the criterion given in Theorem 3: in scenario (a) the ratio is
 ${\lambda}_j/{\lambda}_{\mathfrak{n}}<1+(\beta-1)|{\mathcal{N}}|/\beta=43/3$
for all
 $j\in{\mathcal{N}}$
, which shows that the whole system average is most beneficial here. In contrast, in scenario (b) we have
 ${\lambda}_j/{\lambda}_{\mathfrak{n}}<43/3$
only for
 $j\leq 4$
, which implies that concentration on the single objects
 $j\in\{5,6,\ldots,15\}$
is more advantageous compared to holding all objects in the system.
Remark 7. The criterion presented in Theorem 3 leads to qualitatively different recommendations with respect to concentration or diversification strategies compared to those for unconditional probabilities. In the latter case, the criterion to minimize the probability of the large subset average value  $\bar{S}_\mathcal{A}$
is as follows: concentration on subset
 $\mathcal{A}$
is beneficial in contrast to diversification on the whole system
 ${\mathcal{N}}$
in the sense that
 $\mathbb{P}(\bar{S}_\mathcal{A} >s) = o(\mathbb{P}(\bar{S}_{\mathcal{N}} >s))$
as
 $s\to\infty$
if and only if the ratio of the smallest rate parameters satisfies
 ${\lambda}_{{\mathfrak{a}}}/{\lambda}_{\mathfrak{n}} > |{\mathcal{N}}|/|\mathcal{A}|$
. These differences should be taken into account by, for example, comparing results on Value at Risk and conditional Value at Risk.
6. Proofs
Proof of Theorem 1 and Proposition 2. Due to the no-memory property of the exponential distribution we have that the shifted random variable  $X_j-x$
given
 $X_j>x$
follows an
 ${\textrm{Exp}}({\lambda}_j)$
distribution for
 $j\in{\mathcal{N}}$
, i.e. for the conditional density we have
 $f_{(X_j-x \mid X_j>x)}=f_{X_j}$
. We further partition the sum
 $S_{\mathcal{N}}$
as follows:
 $S_{\mathcal{N}}= \sum_{i\in{\mathcal{N}}} X_i = \sum_{i\neq j}X_i + (X_j -x) + x$
. Using that the variables
 $X_i$
for
 $i\neq j$
are independent from
 $X_j$
, we obtain, for the conditional density of
 $S_{\mathcal{N}} - x$
given
 $X_j>x$
,
 \begin{align*} f_{(S_{\mathcal{N}} -x \mid X_j>x)}(z) &= \int_0^z f_{\big(\!\sum_{i\neq j}X_i \mid X_j>x\big)}(z-u) f_{(X_j-x \mid X_j>x)}(u)\,\textrm{d}u\\ &= \int_0^z f_{\sum_{i\neq j}X_i }(z-u) f_{X_j}(u)\,\textrm{d}u \;=\; f_{S_{\mathcal{N}}}(z) . \end{align*}
This implies that
 \begin{eqnarray*} \mathbb{P}(S_{\mathcal{N}} >s \mid X_j>x) &=& \mathbb{P}(S_{\mathcal{N}} -x > s-x \mid X_j>x) \;=\; \mathbb{P}(S_{\mathcal{N}} > s-x) , \end{eqnarray*}
which proves statement (i) of Theorem 1.
Asymptotically for  $x\to\infty$
and
 $s(x)-x\to\infty$
we have that in
 $\mathbb{P}(S_{\mathcal{N}}>s(x)-x) = \sum_{i\in{\mathcal{N}}} {\pi}_i{{\scriptscriptstyle(\mathcal{N})}} \,\textrm{e}^{-{\lambda}_i (s(x)-x)}$
the summand for
 $i={\mathfrak{n}}$
with the smallest rate parameter
 ${\lambda}_{\mathfrak{n}}$
determines the asymptotics (cf. Corollary 1). Hence, we obtain
 \begin{equation*}\!\!\!\!\mathbb{P}\Bigg(\!\sum_{i\in{\mathcal{N}}}X_i >s(x) \mid X_j >x\Bigg) \sim \pi_{{\mathfrak{n}}}{{\scriptscriptstyle(\mathcal{N})}} \,\textrm{e}^{-{\lambda}_{\mathfrak{n}} (s(x)-x)} =\pi_{{\mathfrak{n}}}{{\scriptscriptstyle(\mathcal{N})}\,} \mathbb{P}(X_{{\mathfrak{n}}}>s(x)-x) , \end{equation*}
which gives statement (ii) of Theorem 1. The statements in Proposition 2 follow from Bayes’ theorem.
Proof of Theorem 2 and Proposition 3. To analyze the joint probability of the sums  $S_{\mathcal{N}} =\sum_{i\in{\mathcal{N}}}X_i$
and
 $S_\mathcal{A} =\sum_{j\in\mathcal{A}}X_j$
we partition the sum
 $S_{\mathcal{N}}$
into the subset sum
 $\sum_{j\in\mathcal{A}}X_j$
and its complement sum
 $\sum_{k\in{\mathcal{N}}\setminus\mathcal{A}}X_k$
, and use that these sums follow stochastically independent GEM distributions with parameters
 ${\lambda}_j,\pi_{j}{{\scriptscriptstyle(\mathcal{A})}}$
,
 $j\in\mathcal{A}$
, or
 ${\lambda}_k, \pi_{k}{\scriptscriptstyle({\mathcal{N}}\setminus\mathcal{A})}$
,
 $k\in{\mathcal{N}}\setminus\mathcal{A}$
, respectively. For
 $s > t$
we obtain
 \begin{align*} \mathbb{P}&\big(S_{\mathcal{N}} >s, S_\mathcal{A} > t\big) \;=\; \mathbb{P}\Bigg(\!\sum_{i\in{\mathcal{N}}} X_i >s, \sum_{j\in\mathcal{A}}X_j > t\Bigg) \\
& = \int_{t}^{s} \mathbb{P}\Bigg(\!\sum_{k\in{\mathcal{N}}\setminus\mathcal{A}}X_k >s-u\Bigg)\, f_{\sum_{j\in\mathcal{A}}X_j}(u) \, \textrm{d}u\; +\; \mathbb{P}\Bigg(\!\sum_{j\in\mathcal{A}}X_j>s\Bigg) \\
& = \sum_{j\in\mathcal{A}} \, \sum_{k\in{\mathcal{N}}\setminus\mathcal{A}} {\lambda}_j \pi_{j}{{\scriptscriptstyle(\mathcal{A})}\,} \pi_{k}{\scriptscriptstyle({\mathcal{N}}\setminus\mathcal{A})} \,\textrm{e}^{-{\lambda}_k s} \int_{t}^{s} \textrm{e}^{({\lambda}_k-{\lambda}_j)u} \, \textrm{d}u \; +\; \sum_{j\in\mathcal{A}} \pi_{j}{{\scriptscriptstyle(\mathcal{A})}} \,\textrm{e}^{-{\lambda}_j s} \\\
& = \sum_{j\in\mathcal{A}} \, \sum_{k\in{\mathcal{N}}\setminus\mathcal{A}} \frac{{\lambda}_j \pi_{j}{{\scriptscriptstyle(\mathcal{A})}\,} \pi_{k}{\scriptscriptstyle({\mathcal{N}}\setminus\mathcal{A})}}{{\lambda}_k -{\lambda}_j} \left[ \,\textrm{e}^{-{\lambda}_j s} - \,\textrm{e}^{-({\lambda}_j t+ {\lambda}_k (s-t))} \right] \; +\; \sum_{j\in\mathcal{A}} {\pi}_{j}{{\scriptscriptstyle(\mathcal{A})}\,} \,\textrm{e}^{-{\lambda}_j s} \\
& = \sum_{j\in\mathcal{A}}{\pi}_{j}{{\scriptscriptstyle(\mathcal{A})}} \Bigg[ \Bigg(1- \sum_{k\in{\mathcal{N}}\setminus\mathcal{A}} \pi_{k}{\scriptscriptstyle(\{j\}\cup\{k\})}\, \pi_{k}{\scriptscriptstyle({\mathcal{N}}\setminus\mathcal{A})}\Bigg) \,\textrm{e}^{-{\lambda}_j s} \\
& \quad + \sum_{k\in{\mathcal{N}}\setminus\mathcal{A}} \pi_{k}{\scriptscriptstyle(\{j\}\cup\{k\})} \, \pi_{k}{\scriptscriptstyle({\mathcal{N}}\setminus\mathcal{A})} \,\textrm{e}^{-({\lambda}_j t + {\lambda}_k(s-t))}\Bigg]. \end{align*}
Next, we use the properties from Eqs. (4) and (5), which together imply that
 \begin{equation*}1- \sum_{k\in{\mathcal{N}}\setminus\mathcal{A}}\!\pi_{k}{\scriptscriptstyle(\{j\}\cup\{k\})} \pi_{k}{\scriptscriptstyle({\mathcal{N}}\setminus\mathcal{A})} = 1-\! \sum_{k\in{\mathcal{N}}\setminus\mathcal{A}}\!\pi_{k}{\scriptscriptstyle(({\mathcal{N}}\setminus\mathcal{A})\cup\{j\})} = \pi_{j}{\scriptscriptstyle(({\mathcal{N}}\setminus\mathcal{A})\cup\{j\})} ,\end{equation*}
and obtain
 \begin{align*} \mathbb{P}&\Bigg(\!\sum_{i\in{\mathcal{N}}} X_i >s, \sum_{j\in\mathcal{A}}X_j > t\Bigg) \\
& = \sum_{j\in\mathcal{A}} {\pi}_{j}{{\scriptscriptstyle(\mathcal{A})}} \,\textrm{e}^{-{\lambda}_j t} \, \Bigg[ \pi_{j}{\scriptscriptstyle(({\mathcal{N}}\setminus\mathcal{A})\cup\{j\})} \,\textrm{e}^{-{\lambda}_j (s-t)} +\sum_{k\in{\mathcal{N}}\setminus\mathcal{A}}\! \pi_{k}{\scriptscriptstyle(({\mathcal{N}}\setminus\mathcal{A})\cup\{j\})} \,\textrm{e}^{-{\lambda}_k (s-t)}\Bigg]\\ \nonumber& = \sum_{j\in\mathcal{A}} {\pi}_{j}{{\scriptscriptstyle(\mathcal{A})}\,} \,\textrm{e}^{-{\lambda}_j t} \sum_{k\in ({\mathcal{N}}\setminus\mathcal{A})\cup\{j\}} \!\!\!\!\!\!\!\pi_{k}{\scriptscriptstyle(({\mathcal{N}}\setminus\mathcal{A})\cup\{j\})} \,\textrm{e}^{-{\lambda}_k (s-t)}\\
& = \sum_{j\in\mathcal{A}} {\pi}_{j}{{\scriptscriptstyle(\mathcal{A})}\,} \mathbb{P}(X_j >t) \, \mathbb{P}\Bigg(\!\sum_{k\in ({\mathcal{N}}\setminus\mathcal{A})\cup\{j\}}\!\!\!\!\!\! X_k> s-t\Bigg) . \end{align*}
Consequently,
 \begin{equation} \mathbb{P}\Bigg(\!\sum_{i\in{\mathcal{N}}}\! X_i\! >\! s \mid \sum_{j\in\mathcal{A}}\! X_j \! >\! t\Bigg) = \frac{\sum_{j\in\mathcal{A}} {\pi}_{j}{{\scriptscriptstyle(\mathcal{A})}\,} \mathbb{P}(X_j \! >\! t) \, \mathbb{P}\big(\!\sum_{k\in ({\mathcal{N}}\setminus\mathcal{A})\cup\{j\}}\! X_k \! > \! s\! -\! t\big)}{\sum_{j\in\mathcal{A}} {\pi}_{j}{{\scriptscriptstyle(\mathcal{A})}\,} \mathbb{P}(X_j \! >\! t)} . \end{equation}
Asymptotically for  $t\to\infty$
and
 $s(t)-t\to\infty$
the summands in (6) with
 $j={\mathfrak{a}}$
and
 $k={\mathfrak{n}}$
dominate, which implies that
 \begin{eqnarray*}\mathbb{P}\bigg(\!\sum_{i\in{\mathcal{N}}}X_i> s(t) \mid \sum_{j\in\mathcal{A}}X_j >t\bigg) \sim \pi_{{\mathfrak{n}}}{\scriptscriptstyle(({\mathcal{N}}\setminus\mathcal{A})\cup\{{\mathfrak{a}}\})} \,\textrm{e}^{- {\lambda}_{\mathfrak{n}} (s(t)-t)} . \end{eqnarray*}
Hence, statements (i) and (ii) in Theorem 2 for  $s>t$
are proven. For
 $s\leq t$
we obtain the trivial case that
 $\mathbb{P}(\!\sum_{i\in{\mathcal{N}}}X_i>s, \sum_{j\in\mathcal{A}}X_j>t) = \mathbb{P}(\!\sum_{j\in\mathcal{A}}X_j >t)$
, and consequently
 $\mathbb{P}(\!\sum_{i\in{\mathcal{N}}}X_i>s \mid \sum_{j\in\mathcal{A}}X_j >t) =1$
. The results in Proposition 3 follow by Bayes’ theorem.
Proof of Proposition 4. Statement (ii) in Theorem 2 gives that
 \begin{equation*}\mathbb{P}\Bigg((1/|{\mathcal{N}}|)\,\sum_{i\in {\mathcal{N}}}X_i>\alpha t \,\;\big|\;\, (1/|\mathcal{A}|)\,\sum_{j\in \mathcal{A}}X_j >t\Bigg) \,\sim\,\, C(\mathcal{A})\,\textrm{e}^{- (\alpha |{\mathcal{N}}|/|\mathcal{A}|\,-\,1){\lambda}_{{\mathfrak{n}}} t}\end{equation*}
for  $t\to\infty$
, with constants
 \begin{equation*} C(\mathcal{A})\,:\!={\pi}_{{\mathfrak{n}}}{\scriptscriptstyle(({\mathcal{N}}\setminus\mathcal{A})\cup\{{\mathfrak{a}}\})} \;=\!\!\! \prod_{\tiny\begin{array}{c}{k\in({\mathcal{N}}\setminus\mathcal{A})\cup\{{\mathfrak{a}}\}}\\k\neq {\mathfrak{n}}\end{array}}\!\!{\lambda}_k / ({\lambda}_k-{\lambda}_{\mathfrak{n}}) . \end{equation*}
This form of  $C(\mathcal{A})$
implies that by removing some element
 $\ell$
from set
 $\mathcal{A}$
, then for
 $\tilde{\mathcal{A}}\,:\!=\mathcal{A}\setminus\{\ell\}$
we have
 $C(\tilde{\mathcal{A}})=C(\mathcal{A})\cdot {\lambda}_i/({\lambda}_i-{\lambda}_{\mathfrak{n}})>C(\mathcal{A})$
, with
 $i\,:\!={\tilde{\mathfrak{a}}}=\textrm{argmin}\{{\lambda}_j\mid j\in\tilde{\mathcal{A}}\}$
if
 $\ell={\mathfrak{n}}$
or
 $i\,:\!=\ell$
if
 $\ell\neq{\mathfrak{n}}$
.
Proof of Theorem 3. Proposition 3(ii) with  $t(s)=|\mathcal{A}|\beta s/|{\mathcal{N}}|$
and Corollary 2(ii) imply that, for
 $\mathbb{P}_{\textrm{C}}(s)\,:\!=\mathbb{P}(\bar{S}_\mathcal{A} >\beta s \mid \bar{S}_{{\mathcal{N}}}>s)$
and
 $\mathbb{P}_{\textrm{D}}(s)\,:\!=\mathbb{P}(\bar{S}_{\mathcal{N}} >\beta s \mid \bar{S}_{{\mathcal{N}}}>s)$
, we have, asymptotically for
 $s\to\infty$
,
 \begin{eqnarray*}\mathbb{P}_{\textrm{C}}(s)&\,\sim\,& \begin{cases} \,\textrm{e}^{-({\lambda}_{{\mathfrak{a}}}-{\lambda}_{\mathfrak{n}}) |\mathcal{A}|\beta s/|{\mathcal{N}}|}\,/\, k_1 & \text{ for } 0<\beta< |{\mathcal{N}}|/|\mathcal{A}| , \\ \,\textrm{e}^{- \left(|\mathcal{A}|\beta{\lambda}_{{\mathfrak{a}}}/|{\mathcal{N}}|\,-{\lambda}_{{\mathfrak{n}}}\right) s} \,/\, k_2 & \text{ for } \beta\geq |{\mathcal{N}}|/|\mathcal{A}| ; \\\end{cases}\\\mathbb{P}_{\textrm{D}}(s)&\,\sim\,& \begin{cases} 1 & \text{ for } 0<\beta\leq 1 , \\ \,\textrm{e}^{-(\beta -1){\lambda}_{\mathfrak{n}} s} & \text{ for } \beta> 1 , \\\end{cases}\end{eqnarray*}
with constants  $k_1=\prod_{k\in \mathcal{A}\setminus\{{\mathfrak{a}}\}} ({\lambda}_k -{\lambda}_{\mathfrak{a}})/({\lambda}_k -{\lambda}_{{\mathfrak{n}}})$
and
 $k_2={\pi}_{{\mathfrak{n}}}{{\scriptscriptstyle(\mathcal{N})}\,}/{\pi}_{{\mathfrak{a}}}{{\scriptscriptstyle(\mathcal{A})}}$
. Consequently, we obtain, for
 $s\to\infty$
:
• for
$0<\beta\leq 1$
:
\begin{align*} \mathbb{P}_{\textrm{C}}(s)=o(\mathbb{P}_{\textrm{D}}(s)) \;\Leftrightarrow\; {\mathfrak{a}}\neq {\mathfrak{n}}, \text{ i.e. } {\lambda}_{\mathfrak{a}} /{\lambda}_{\mathfrak{n}} >1, \text{ and } \mathbb{P}_{\textrm{C}}(x)\sim \mathbb{P}_{\textrm{D}}(x) \;\Leftrightarrow\; {\mathfrak{a}}={\mathfrak{n}};\end{align*}
• for
$ 1< \beta< |{\mathcal{N}}|/|\mathcal{A}|$
:
\begin{eqnarray*} \mathbb{P}_{\textrm{C}}(s)=o(\mathbb{P}_{\textrm{D}}(s)) &\,\Leftrightarrow\,& ({\lambda}_{{\mathfrak{a}}}-{\lambda}_{\mathfrak{n}})|\mathcal{A}|\beta/|{\mathcal{N}}| > (\beta-1){\lambda}_{\mathfrak{n}} \\ &\,\Leftrightarrow\,& {\lambda}_{{\mathfrak{a}}}/{\lambda}_{\mathfrak{n}} >1+(\beta-1)|{\mathcal{N}}|/(\beta |\mathcal{A}|) ; \end{eqnarray*}
• for
$\beta\geq |{\mathcal{N}}|/|\mathcal{A}|$
:
\begin{equation*} \mathbb{P}_{\textrm{C}}(s)=o(\mathbb{P}_{\textrm{D}}(s)) \;\Leftrightarrow\; \beta |\mathcal{A}|{\lambda}_{{\mathfrak{a}}}/|{\mathcal{N}}|-\!{\lambda}_{\mathfrak{n}}> (\beta \! -\! 1){\lambda}_{\mathfrak{n}} \;\Leftrightarrow\; {\lambda}_{{\mathfrak{a}}}/{\lambda}_{\mathfrak{n}} >|{\mathcal{N}}|/|\mathcal{A}| .\end{equation*}


Acknowledgements
We would like to thank two anonymous reviewers for their constructive comments which led to improvements in the paper. This research has been financially supported in part by the Collaborative Research Center “Statistical modeling of nonlinear dynamic processes” (SFB 823, Teilprojekt A1) of the German Research Foundation (DFG).