

Introduction
For many years mathematical models have been used in a wide variety of disciplines to illustrate and interpret the data obtained through observation or measurement, and to reveal the cause-effect relationships. The models used in animal science can divided into three main categories: (1) teleonomic, (2) empirical and (3) mechanistic models (Thornley and France, Reference THORNLEY and FRANCE2007). With their goal-directed behaviour, teleonomic models are mathematical models that clearly formulated in terms of the target and are usually multi-stage. The models used in explaining the traits of economic significance in animals, i.e. growth, milk or egg production, are mostly in empirical or mechanistic forms (France and Dijkstra, Reference FRANCE and DIJKSTRA2006). Empirical models are statements describing the motion of the dependent variable without attempting to diagnose and explain the reasons. Although the most widely accepted forms of empirical functions are linear and non-linear models. Empirical models can be converted to more mechanistic structures if there is enough information about the system with the help of additional meaningful parameters containing this information (Zwitering et al., Reference ZWITERING, JONGENBURGER and VAN ’T RIET1990).
Numerous studies have been conducted to investigate carcass yields and carcass quality as well as egg production from poultry. After hatching, rapid growth is followed by a linear period of increase following an asymptotic route, resulting a sigmoidal growth pattern for poultry (Ricklefs, Reference RICKLEFS1968). Almost all of the models utilised to describe growth in poultry are mechanistic models with three or four biologically meaningful parameters (Narinc et al., Reference NARINC, KARAMAN, FIRAT and AKSOY2010). Gompertz, Logistic, Richards and von Bertalanffy are the most widely used growth models, varying not only in the number of parameters, but also in their flexibility around the point of inflection (Darmani Kuhi et al., Reference DARMANI KUHI, PORTER, LOPEZ, KEBREAB, STRATHE, DUMAS, DIJKSTRA and FRANCE2010).
In published literature, egg production modelling is scarce compared to the studies modelling growth in broilers, probably due to the longer time required to follow egg production. Models with biologically interpretable parameters are not as well-established as for growth models. Indeed, it is difficult to assess egg production with asymptotic functions. Egg production begins at the age of sexual maturity, quickly reaches the peak production level, following a linear trend after a while, and then decreases to zero, and hence more closely resembles milk production, and indeed some functions used in modelling egg production could also be used in the lactation curves of dairy cows (Gavora et al., Reference GAVORA, LILJEDAH, MCMILLAN and AHLEN1982). Non-linear regression and multi-stage modelling methods can be used in modelling egg production (Savegnago et al., Reference SAVEGNAGO, CRUZ, RAMOS, CAETANO, SCHMIDT, LEDUR, EL FARO and MUNARI2012). This review aims to introduce and compile the functions used for modelling egg production, and to underline the differences among these functions utilising the data obtained from commercial layer breeder flocks.
Functional forms
Egg yield is defined as the number of eggs from a poultry house (hen-housed) or the total number of eggs produced by live animals (hen-day) during a specific time period (daily, weekly, monthly, annually) or as the ratio of the total eggs produced by the number of animals. Egg production of an animal during the production period can be accumulated, however, this is not the method of choice for breeding or rearing purposes (Narinc et al., Reference NARINC, KARAMAN, AKSOY and FIRAT2013). The non-linear regression models used to indicate time-dependent changes in egg yield, such as Gamma, Mc Nally, Mc Millan, Adams-Bell, Compartmental, Modified Compartmental, Logistic-curvilinear, Gloor, Lokhorst and Narushin-Takma functions, usually include three to seven estimated parameters. Table 1 summarises these functions and expressions.
Non-lineair regression equations used for egg yield modelling.

In the models presented in Table 1, represents the estimated number or the rate of eggs to the number of birds in period of time (t). The Gamma model was proposed by Wood (Reference WOOD1967), where a is the initial production, b is the rate of increase to the peak, and c is the rate of decrease from the peak. The week of peak production (b/c) and persistency of peak production [−(b + 1)ln c] were derived from the model parameters. The McNally model is a modified version of the Gamma model developed by McNally (Reference MCNALLY1971) with the addition of an extra parameter, d, which is proportional to the square root of time. The McMillan function was developed by McMillan et al. (Reference MCMILLAN, FITZ-EARLE and ROBSON1970), where is the initial day of egg laying, M is the potential maximum daily output of eggs, is the rate of increase in egg laying and is the rate of decay of egg production. The Adams-Bell model (Adams and Bell, Reference ADAMS and BELL1980) modelled the laying period as a sum of a logistic function that describes the initial rise to peak output and a linear function for decline thereafter. The authors referred to the parameters in the model (a, b, c, r, and d) as constants to be evaluated and did not attribute any biological meaning to them. The Adams-Bell model is mostly used to predict total production from early records (Cason and Britton, Reference CASON and BRITTON1988). In compartmental function transformed into egg production model by McMillan (Reference MCMILLAN1981), it is assumed that the hens begin production at a maximum laying rate and the starting times are exponentially distributed within a hen group. In this function, k1 represents instantaneous rates of increase and k2 instantaneous rates of decrease in egg production and A is the maximum potential of egg production. The modified compartmental model was developed by Yang et al. (Reference YANG, WU and MCMILLAN1989), where is the scale parameter, is the rate of decrease of egg laying, is an indicator of variation in sexual maturity, and is the mean number of weeks in test until sexual maturity. The Logistic model, devised by Cason and Britton (Reference CASON and BRITTON1988). combined the decreasing term () of the compartmental model and an increasing term that is a logistic growth curve similar to the increasing term of the Adams-Bell model. In Gloor function, is the asymptote of egg production, is the rate of linear increase in egg laying, is the rate of increase in egg laying, and are the rate of decrease in laying ability (Gloor, Reference GLOOR1997). In Lokhorst function (Lokhorst, Reference LOKHORST1996), parameters a and r represent the logistic part and the second order polynomial is described with parameters b, c, and d. Hen-day production at the start of the laying period is determined by parameters a and b. The time between the start of the laying period and the day the maximum production is reached is influenced by parameter r. The results of the second order polynomial are subtracted from the asymptote of the logistic growth curve part, which represents the theoretical maximum hen-day egg production. Taking its name from the authors, the Narushin-Takma function (Narushin and Takma, Reference NARUSHIN and TAKMA2003) is used to model the egg production as a function of age with six parameters that are not biologically interpretable.
Spline regression models are used to model the growth or egg yield as the series of linear models, where the yield process is considered as the sum of yield periods. These models provide an alternative to the models having an asymptote, and can be utilised when the data are truncated before the asymptote is attained (Aggrey, Reference AGGREY2002). There is a further approach dealing with the system as a multi-stage process, including models such as Segmented Polynomial (Fialho and Ledur, Reference FIALHO and LEDUR1997), Persistency model (Grossman et al., Reference GROSSMAN, GOSSMAN and KOOPS2000) and Individual egg production model (Grossman and Koops, Reference GROSSMAN and KOOPS2001). Segmented Polynomial model (I) is the production curve having three segments (Fialho et al., Reference FIALHO and AVILA2001). In the first segment, the egg production is considered to be zero. Between the first laying and the peak production, the curve is represented by an ascending cubic function (Segment 2). Finally, following the peak, production is modelled with a linear decreasing function.
In the Segmented Polynomial model, yt is the level of production in eggs/hen/day, x is the age of the hen in weeks, xo is the age at initial production, xp is the age at peak production, and a,b are the constants.
Persistency model (II) was developed by Grossman et al. (Reference GROSSMAN, GOSSMAN and KOOPS2000) to describe the egg production curve with a new measure for persistency, based on the proposed definition, utilising it as a selection criterion to improve the total egg production.
where yt is the egg production rate at t weeks of laying, yp is the peak production level (egg/hen-day %); t2 is the age of hens in weeks at peak, r is the rate of production decrease after the peak (eggs/hen-day decrease per week), P is the number of weeks during which a constant egg production level is maintained after the peak.
Grossman and Koops (Reference GROSSMAN and KOOPS2001) presented an individual egg production model (III) where the weekly egg production of a hen is modelled in such a manner that the process is a sum of logistic functions. The model consisted of an increasing phase and a single decreasing phase.
Here, yt is the egg production at week t, m is the maximum production during a specific time interval, k1 is the proportion of maximum production for the increasing phase, k2 is the proportion of maximum production for the decreasing phase, and c2 is point of inflection from the upper level of the increasing phase to the lower level of the decreasing phase.
Modelling studies of egg production
Gavora et al. (Reference GAVORA, PARKER and MCMILLAN1971) and Timmermans (Reference TIMMERMANS1973; Reference TIMMERMANS1975) utilised the McMillan model to describe the egg productions in domestic fowl. Gavora et al. (Reference GAVORA, PARKER and MCMILLAN1971) noted that the McMillan model closely matched curves to records of egg production of hens and turkeys, particularly for the steeply increasing type. McNally (Reference MCNALLY1971) utilised the resemblance between lactation and egg production curves and fitted this to biweekly collected egg production data in a laying hen flock. Timmermans (Reference TIMMERMANS1973) fitted the incomplete Gamma function to egg production data. Congleton et al. (Reference CONGLETON, CHAMBERLAIN, MUIR and HAWES1981) modelled weekly production data from 60 experimental groups of 1,872 Harco Red x Rock sex-linked females, and reported that the incomplete gamma curves could not rapidly increase to a maximum and then abruptly change from a positive to a negative slope. Hence the prediction of egg yields in laying hens using incomplete gamma curves are found to be highly biased during the most of the process (Congleton et al., Reference CONGLETON, CHAMBERLAIN, MUIR and HAWES1981). Adams and Bell (Reference ADAMS and BELL1980) developed a model for hen-day percentage of egg production using a data from 232 commercial flocks of 25 poultry farms.
The majority of the works utilising the Compartmental model are in pharmacokinetic studies aiming to estimate drug concentrations in compartments of living systems (blood, muscle, liver etc.) after administration by tablet or inoculum (McMillan, Reference MCMILLAN1981). However, some researchers (McMillan et al., Reference MCMILLAN, FITZ-EARLE and ROBSON1970) have suggested using models in describing egg production of Drosophila spp. (common fruit fly). Physiological interpretations were provided for the model parameters, and formulae for estimations of egg production during any given period of interest were derived. Gavora et al. (Reference GAVORA, PARKER and MCMILLAN1971) noted that on a weekly, biweekly, or monthly basis, the shape of the egg production curves in poultry appeared to follow a similar pattern in Drosophila on a daily basis and reported that the curve provided a satisfactory description of egg data. Timmermans (Reference TIMMERMANS1975) indicated that the Compartmental model fitted well for egg production data in poultry, and demonstrated that the parameters in the equation changed substantially in a selection experiment with two genetically different strains.
McMillan et al. (Reference MCMILLAN, GOWE, GAVORA and FAIRFUL1986) compared three nonlinear and linear models with respect to their ability to predict 50-week egg production from actual egg production record lengths of 16, 20, and 24 weeks. The exponential curves of Wood (Reference WOOD1967) and McMillan et al. (Reference MCMILLAN, FITZ-EARLE and ROBSON1970), and linear regression were fitted to hen-housed and survival data of three strains of chicken. Contrary to the outcomes from linear and compartmental models, the Wood model did not present accurate predictions of actual data. It was concluded that, when the model is intended only to predict total egg production from partial data, the linear model should be the used due to its simplicity and lower costs of fitting. However, when the model is intended to serve several purposes (management of the flock and seasonal prices of inputs and outputs), the compartmental model is preferable as its parameters are biologically interpretable (McMillan et al., Reference MCMILLAN, GOWE, GAVORA and FAIRFUL1986). Cason and Britton (Reference CASON and BRITTON1988) evaluated performances of the Compartmental or McMillan model, the Adams-Bell model, and a Compartmental-type model on the basis of a logistic growth curve using weekly egg production data of six, first cycle and 13, moulted commercial layer flocks. The results of their study indicated that the predictions of total egg production based on 24 weeks’ data were significantly more accurate for the Adams-Bell and Logistic models than for the compartmental model in first cycle flocks, with no difference in moulted flocks. It was suggested by the researchers that the Adams-Bell model may be useful in decision making concerning replacement or moulting layer flocks.
A modified version of the Compartmental model (the Modified Compartmental model) was proposed by Yang et al. (Reference YANG, WU and MCMILLAN1989), whereby they defined a component of variation in sexual maturity with the help of two additional parameters. According to the findings of their study, they reported that the Modified Compartmental model not only provided theoretical advantages over the Compartmental model and Gamma model, but also gave a better fit.
Cason and Ware (Reference CASON and WARE1990) investigated the best fitting model among three modified (increasing and decreasing terms modified) growth curves (Nelder, Richards, Von Bertalanffy), and two egg-production models (Adams-Bell and Logistic) using the data collected up to 20 or 24 weeks of lay in 12 first-cycle flocks, selected for having ideal production curves. They reported that all models gave very good fit with R2 values of 0.99. However, when the models were used for extrapolation, the Nelder increasing and the linear decreasing term performed best. The Adams-Bell model or a simple linear regression exhibited better fitting performances from peak production to 20 or 24 weeks of production. Cason (Reference CASON1990) compared the Adams-Bell and Logistic-curvilinear models for weekly hen-day egg production data up to 24 weeks in 45 first-cycle flocks. It was concluded that the Adams-Bell model was preferable, as its linear decreasing term provides better fits than the Logistic decreasing term for modelling the entire egg production curve of the flock.
Mielenz and Müller (Reference MIELENZ and MÜLLER1991) fitted linear, exponential, Adams-Bell, and McMillan models for 450-d egg yield of laying hens and reported that all models fit equally well to the data. They indicated that any change in time interval led to changes of model performances. Miyoshi et al. (Reference MIYOSHI, MINH LUC, KUCHIDA and MITSUMUTO1996) fitted the Compartmental, Modified Compartmental, Gamma and Adams-Bell functions to annual egg production data (accumulated at 10-days intervals) for two lines of White Leghorn in which a long-term divergent selection for yolk content of albumen was applied. It was reported that the four models used in the study performed well in modelling the egg yields in terms of the goodness of fit criteria indicating that the models are adequate in modelling the egg production of the flock. However, they did not provide a way to predict the individual performances which is the main issue of any selection program, and hence the development of new models was deemed crucial.
A multiphasic model to describe the egg production curves of individuals was first developed by Koops and Grossman (Reference KOOPS and GROSSMAN1992). In this approach, egg laying or production phase was determined by the number of eggs within a Reference KLOMPclutch, including internally laid eggs (ovulation occurs but the ovum fails to be captured) and pause (ovulation fails to occur) between clutches. Koops and Grossman's multiphasic function was applied to define egg production of both chickens (Minh et al., Reference MINH, MIYOSHI and MITSUMOTO1995) and Japanese quail (Aggrey et al., Reference AGGREY, NICHOLS and CHENG1993; Soltan and El-Kaschab, Reference SOLTAN and EL-KASCHAB1997). Models to fit some traits of egg production, such as egg weight, feed intake, and second-term egg production was presented (Lokhorst Reference LOKHORST1996), and the evolutionary characters of these (as a function of the hen age) was described. Data for moulted and non-moulted commercial layer flocks were used to estimate the parameters of hen-day egg production model and egg size model (Gloor, Reference GLOOR1997).
A segmented polynomial model for estimation of egg production curves in laying hens was developed and described by Fialho and Ledur (Reference FIALHO and LEDUR1997). The Segmented Polynomial model was compared with Gamma, McMillan, McNally, Modified and Compartmental models, in terms of the prediction accuracy of unobserved data from partial or incomplete egg production data. The parameters of the Segmented Polynomial model were easily interpreted, which was an advantage in characterising egg production curves in practice. Fialho et al. (2001), modelled long-term egg production in experimental and commercial lines of White Leghorns using the Segmented Polynomial model, and suggested that the model should be used more frequently in modelling the production curves.
A multiphasic individual weekly egg production curve was developed by Grossman et al. (Reference GROSSMAN, GOSSMAN and KOOPS2000) for modelling persistency of egg production. To evaluate the model, six data sets were used, two from flocks (one pullet flock and one hen flock) and four from two pairs of individuals. Researchers suggested that using this function contributed to selection studies as a result of persistence. Shortly after, Grossman and Koops (Reference GROSSMAN and KOOPS2001) developed another multiphasic model for individual egg production in chicken using weekly egg production curve which was derived from the logistic function. Researchers concluded that prediction of annual (52-week) egg production based on part-record production (first 22 weeks) might lead to over-prediction, because persistency of production lasts longer than the part record.
Minvielle et al. (Reference MINVIELLE, COVILLE, KRUPA, MONVOISIN, MAEDA and OKAMOTO2000) modelled the hen-day egg production of eight different genetic groups in Japanese quail providing data collected up to 14 months of age. Narushin and Takma (Reference NARUSHIN and TAKMA2003), developed three alternative functions for modelling growth and egg yields, used hen-housed data in a one-year study using Shaver White laying hens. Logistic Curvilinear, Compartmental models and Lokhorst were compared with Narushin-Takma the Adams-Bell model and quite good results were obtained. Egg production of two lines, one line in which a selection was applied for early stage egg production and another for the high tonic immobility period, were used to fit the Modified Compartmental, Persistency and Individual egg production models by Minvielle et al. (Reference MINVIELLE, KAYANG, INOUE-MURAYAMA, MIWA, VIGNAL, GOURICHON, NEAU, MONVOISIN and ITO2006). QTL research was included and six QTL were found to be directly related to the characteristics of egg production. Despite its limited scope (number of microsatellites, the size of the phenotypic data set), this work showed that it was possible to use individual egg laying data collected daily to find new QTL, which in turn affected the shape of the egg laying curve (Minvielle et al., Reference MINVIELLE, KAYANG, INOUE-MURAYAMA, MIWA, VIGNAL, GOURICHON, NEAU, MONVOISIN and ITO2006). Oni et al. (Reference ONI, ABUBAKAR, DIM, ASIRIBO and DEYINKA2007) modelled the 52-week egg yields with the function of McNally in Rhode Island Red and White strains. In this study, the degree of heritability and genetic correlations among characteristics was estimated for partial egg production (16, 20, 24, and 52) and the model parameters (a, b, c, and d). The heritability estimates for the model parameters were higher than the estimated degree of heritability for partial egg yields and the researchers suggested that McNally model parameters to be more useful in selection studies.
The Persistency model was used for modelling egg yields between 23-52 weeks of Castellana Negra native Spanish hens by Miguel et al. (Reference MIGUEL, ASENJO, CIRIA and CALVO2007). Atta et al. (Reference ATTA, ELJACK and El OBIED2010) compared annual egg yields of two commercial flocks, using the Gamma model. Faridi et al. (Reference FARIDI, MOTTAGHITALAB, REZAEE and FRANCE2011), by modelling egg yields of commercial poultry breeder flocks with Adams-Bell, Modified Compartmental, and Narushin-Takma functions, reported that all three models gave good results according to the goodness of fit, and suggested that the Narushin-Takma model was a good alternative for modelling yield of eggs.
Savegnago et al. (Reference SAVEGNAGO, NUNES, S.L. FERRAUDO, G.S. LEDUR and MUNARI2011) analysed annual egg production of White Leghorn strains with Logistic and Neural Network models. It was concluded that the Neural Networks could be used as an alternative tool to fit egg production. In another study, conducted by Savegnago et al. (Reference SAVEGNAGO, NUNES, S.L. FERRAUDO, G.S. LEDUR and MUNARI2011), weekly egg production rates of selected (for egg production and egg quality) and non-selected (randombred control) lines of a White Leghorn hen population were used to fit non-linear (Logistic, Compartmental, Modified Compartmental, McMillan, McNally) and multiphasic (Segmented Polynomial, Persistency) models, and the changes in the egg-laying patterns due to selection were examined for these lines. The goodness of fit of the models was measured using Akaike's information criterion, mean square error, coefficient of determination, graphical analysis of the fitted curves, and the deviations of the fitted curves. According to the goodness of fit of the models, The Logistic, Modified Compartmental, Segmented Polynomial, and Persistency models presented the best goodness of fit. The results reflected that there were significant differences between the parameter estimates of the curves fitted for the selected and non-selected lines, thus indicating that the effect of selection changed the shape of the egg production curves. Narinc et al. (Reference NARINC, KARAMAN, AKSOY and FIRAT2013) investigated long-term egg production (using an average of 52 weeks as of the age of sexual maturity) in a random bred Japanese quail flock. Different non-linear models (Gamma, McNally, Adams-Bell, and Modified Compartmental) for hen-day egg data were compared using goodness of fit criteria. It was determined that all the models were adequate, but that the Adams-Bell model displayed a slightly better fit (pseudo R2= 0.9270, AIC= −307.47, BIC= −297.71) for the percentage of hen-day egg production in Japanese quail (pseudo R2= 0.8768 to 0.9111, AIC= -282.51 to -301.43, BIC= -274.71 to -295.57).
An illustrative case study
The number of eggs produced per unit of time is the basis for important egg production traits (Gloor, Reference GLOOR1997). Egg production curves describe the relation between the number of eggs and time of the laying period (Cason and Britton, Reference CASON and BRITTON1988; Yang et al., Reference YANG, WU and MCMILLAN1989). Non-linear or multiphasic models have been shown to be useful to characterise the mean egg production curve. The development of mathematical models of egg production may not only be of potential use for producers to forecast income and flock performance but also describe an alternative method in genetic studies of poultry (Miyoshi et al., Reference MIYOSHI, MINH LUC, KUCHIDA and MITSUMUTO1996). The purpose of the present study was to investigate the potential for using the available egg production functions to generate curves describing egg production in a breeder flock.
The generalised data on the hen-day egg production, taken from a breeder flock of Shaver White laying hens (Anonymous, 2013), were considered for calculations. The weekly egg production records over a 50 week laying period (from 20 to 70 wk. of age) were used for curve fitting. Weekly egg production rates were used to fit the mean population curve for the flock by means of the iterative Levenberg-Marquardt algorithm, with a nonlinear regression procedure (NLIN) within the SAS 9.3 software (SAS Institute Inc., 2011). The non-linear models applied to fit the egg production data were: Gamma, McNally, Modified Compartmental and Adams-Bell. The goodness of fit of each nonlinear model was evaluated by means of Akaike's information criterion (AIC), Bayesian information criterion (BIC), coefficient of determination (R2) and adjusted coefficient of determination (Adj. R2).
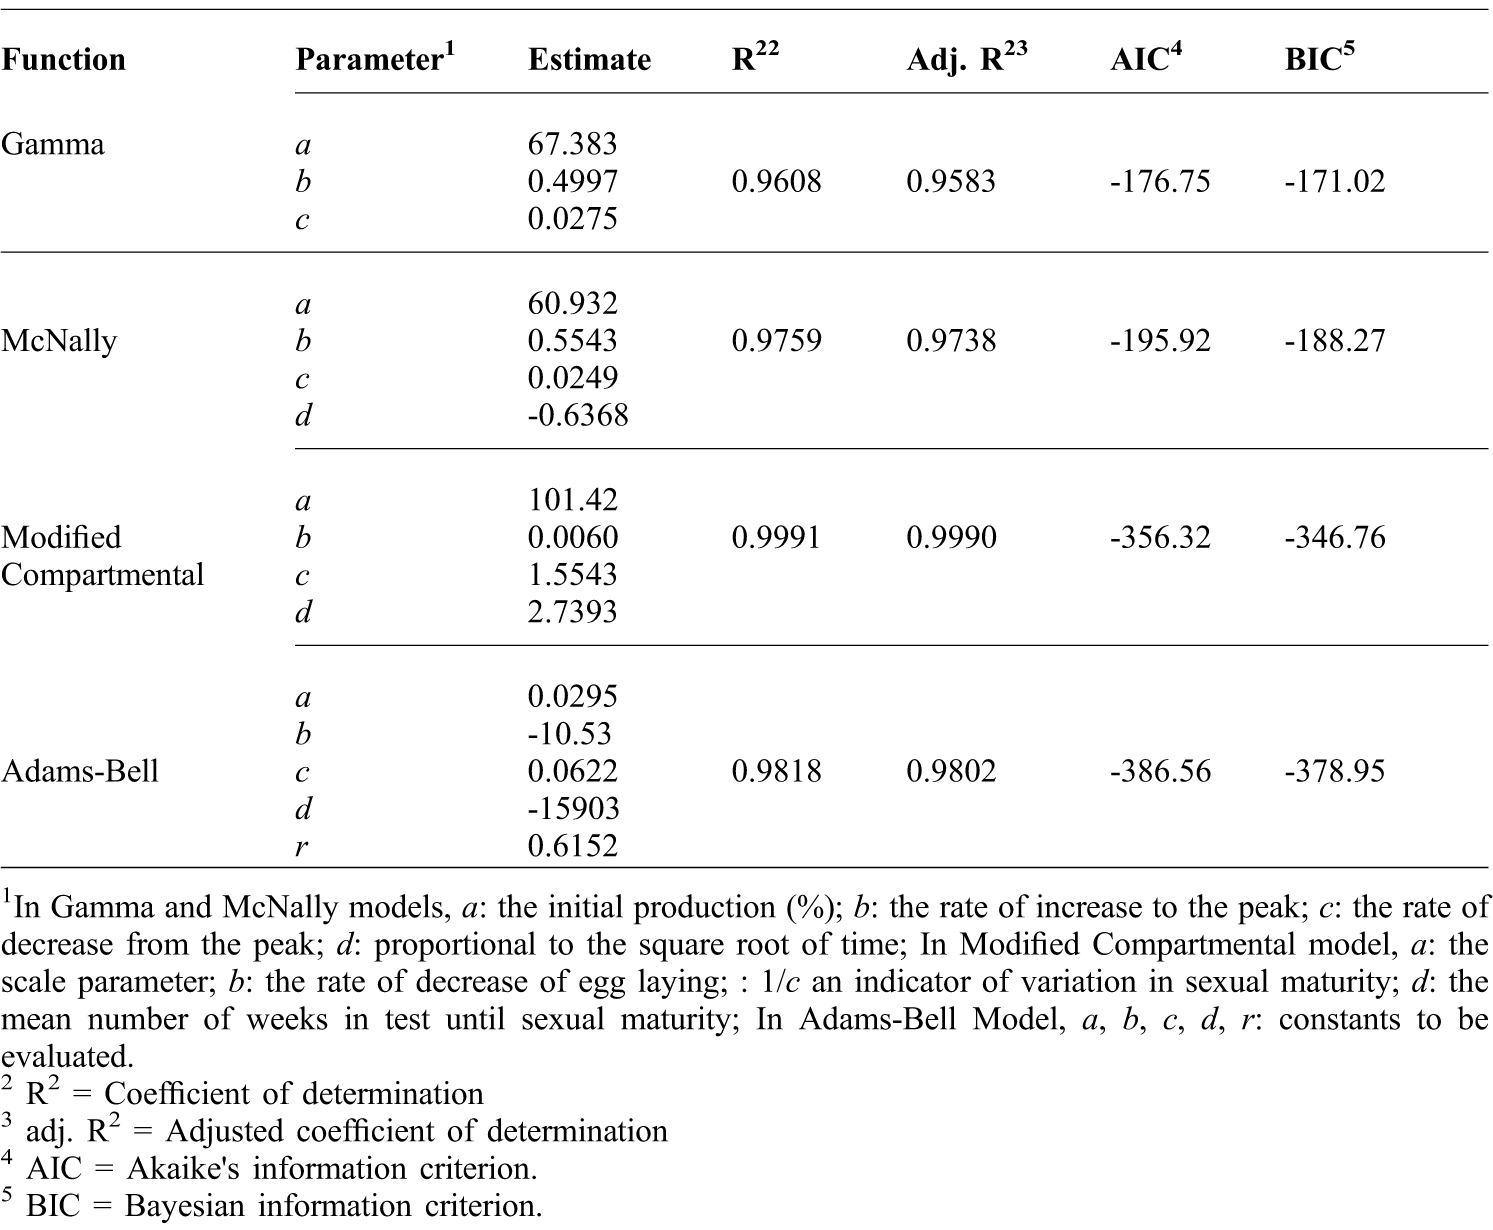
Parameter estimates and corresponding goodness-of-fit indices for each model are summarised in Table 2.
Estimates of model parameters and goodness of fit statistics of each model.
1In Gamma and McNally models, a: the initial production (%); b: the rate of increase to the peak; c: the rate of decrease from the peak; d: proportional to the square root of time; In Modified Compartmental model, a: the scale parameter; b: the rate of decrease of egg laying; : 1/c an indicator of variation in sexual maturity; d: the mean number of weeks in test until sexual maturity; In Adams-Bell Model, a, b, c, d, r: constants to be evaluated.
2 R2 = Coefficient of determination
3 adj. R2 = Adjusted coefficient of determination
4 AIC = Akaike's information criterion.
5 BIC = Bayesian information criterion.
Observed and predicted values for hen-day egg production (as fitted by four models) are plotted in Figure 1.
Actual and predicted hen-day percentages.
All models provided an acceptable fit to the data. According to R2 and adj. R2 values, the Adams-Bell (0.9818 and 0.9802, respectively) and Modified Compartmental (0.9991 and 0.9990, respectively) models provided the best fit for the egg production curves, and the Gamma function showed the lower values (0.9608 and 0.9583, respectively). Based on AIC and BIC, the order of performance of the models was the same as for R2 and adj. R2, with Adams-Bell giving the lowest values (-386.56 and -378.95, respectively) for these criteria. However, the differences between the values for the R2, adj. R2, AIC, BIC were generally so small that, in practice, the models had similar curve fittings.
Some of the parameters of the Gamma, McNally and Modified Compartmental models used in this study were biologically meaningful. Estimated peak yield times using the Gamma and McNally model parameters were found to be 18 and 26 weeks, respectively, and peak yield persistences were found to be 5.38 and 7.65 weeks, respectively. The results obtained when compared with the actual values seem quite deviated. No parameter of the Adams-Bell function, when giving quite good results for the goodness of fit, was found to be biologically meaningful.
Conclusions
Studies on egg production modelling have been carried out for many years. In this review, a great amount of the models are examined, and the studies in this field are summarised. Almost all of these functions have been developed to allow modelling based on flock averages. Most of the models have a mechanistic structure and there are few parameters that have biological meaning. In poultry, the number of studies on modelling growth is relatively higher than those for egg production. Studies for growth curves can be grouped under headings; ‘determination of best-fit growth model’, ‘comparison of various experimental growth of poultry species or groups’ and ‘estimates of genetic parameter for growth curve parameters’. However, almost all of the studies which modelled egg production used the ‘determination of best-fit model’ - only three studies were conducted in the other two subjects. The main reason for this situation is thought to be that the developed models have a more empirical structure, and so the comprehensibility of the models are low. To better understand the biology of egg production, and for genetic selection programs, it is necessary to study the egg production of individual hens. More biologically meaningful parameters need to be used in the individual models to be developed for this purpose.