Cardiac rhabdomyomas are observed in about 60% of patients with tuberous sclerosis complex.Reference Yates, Maclean and Higgins 1
Some of them may be symptomatic and fatal in the neonatal and early infancy period because of their mass and arrhythmic effects.Reference Webb, Thomas and Osborne 2
Cardiac surgery is the standard treatment for haemodynamically unstable patients.
Renal angiomyolipomas are also observed in about 80% of patientsReference Bissler and Kingswood 3 and their progressive enlargement can cause haemorrhage and renal failure.
Tuberous sclerosis complex results from mutation in either the hamartin or tuberin gene leading to the development of hamartomas.
Everolimus, a mammalian target of the rapamycin inhibitor drug, has the ability to reduce hamartomas, correcting the specific molecular defect causing tuberous sclerosis complex.
We report a case of a newborn with life-threatening inoperable cardiac rhabdomyomas and renal angiomyolipoma affected by tuberous sclerosis complex who presented an impressive and persistent response to everolimus.
Case report
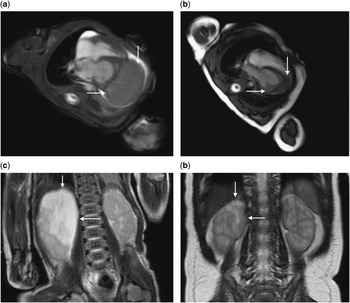
A fetus at 28 weeks’ gestation presented multifocal giant cardiac rhabdomyomas and a large lesion in the right kidney. A caesarean delivery was planned at 35 weeks’ gestation and a 2.0 kg male newborn was born. Sporadic ventricular extrasystoles were observed. Echocardiography showed multiple rhabdomyomas with a giant tumour (4.0×3.5×4.0 cm) over the apical and free wall of the left ventricle, including the left coronary artery. Severely reduced left ventricular volumes and function (end diastolic volume of 10 ml/m2 and ejection fraction of 35%) produced a hypoplastic left heart syndrome physiology with ductal-depending systemic circulation. Prostaglandin E1 (10 ng/kg/minute) was started in order to maintain the systemic blood flow. A thoraco-abdominal MRI showed a large renal mass (3.6×4.5×2.7 cm) characteristic for renal angiomyolipoma (Fig 1). A splice-site mutation (intron 29) of the tuberine gene diagnostic for tuberous sclerosis was found on genetic investigation. Because surgery was judged to be contraindicated, everolimus was proposed as off-label therapy to the family. When the patient was 1 week old and weighing 2.170 kg, everolimus at an oral dose of 0.25 mg once a day (0.11 mg/kg, 1.5 mg/m2) was started in order to achieve a steady-state serum level between 5 and 15 ng/ml, as per the work of Krueger et al.Reference Krueger, Care and Holland 4
( a ) Pretreatment thorax MRI: the cine 4Ch b-SSFP image shows a large para-apical rhabdomyoma (transverse diameter 35×25 mm, arrows). ( b ) Follow-up MRI (10 weeks later): the cine 4Ch b-SSFP image shows a relevant decrease in tumour size (transverse diameter 23×9 mm, arrows). ( c ) Pretreatment abdomen MRI: the coronal T2-weighted image displays a huge right renal angiomyolipoma (transverse diameter 36×45 mm, arrows) at the level of the apex. ( d ) Follow-up MRI (10 weeks later): the coronal T2-weighted image displays a remarkable reduction of the tumour mass (transverse diameter 20×10 mm, arrows).

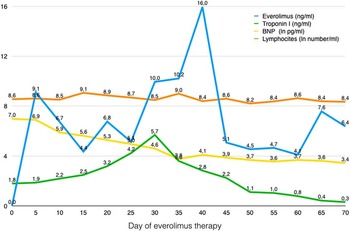
We monitored the serum level of everolimus twice a week. Doses were increased or lowered by 25% to remain in the therapeutic range and in the event of side effects. After five doses of everolimus, the targeted serum levels were achieved (Fig 2). After 10 days, extrasystoles disappeared and the clinical conditions improved. After 3 weeks of treatment, the echocardiogram showed a 70% increased dimension of the left ventricular cavity and normal ventricular function. Prostaglandin E1 infusion could be stopped and the patient remained haemodynamically stable. After 10 weeks, echocardiogram and MRI documented a very good reduction (>80%) of the major cardiac rhabdomyomas and a decrease (60%) in renal angiomyolipoma dimensions (Fig 1). Brain natriuretic peptide blood level (upper limit 100 pg/ml) decreased remarkably in 10 days, back to normal after 30 days of treatment (Fig 2). Troponin I (upper limit 0.055 ng/ml) showed a quick increase, reaching its peak value after 30 days of treatment before declining slowly (Fig 2). Lymphocyte count was stable during the whole study (Fig 2). The single side effect observed was a mild mucositis, at the 14th day of therapy, which resolved spontaneously. Among laboratory tests, only serum triglyceride level was slightly elevated (139 mg/dl after 10 weeks; upper limit <75 mg/dl). Everolimus was stopped at week 11. The final dose of everolimus was 0.06 mg/kg/day (1 mg/m2/day).
Blood level of brain natriuretic peptide (BNP), troponin I, everolimus, and number of lymphocytes expressed as follows: BNP in natural logarithm of pg/ml (upper limit: 4.6), troponin I in ng/ml (upper limit 0.055), everolimus in ng/ml, and lymphocytes in natural logarithm of number/ml (with a range from 7.6 to 9.3).

The patient is currently under strict follow-up and has been symptom- and progression-free for 9 months.
Discussion
Everolimus is a drug of the mammalian target of rapamycin inhibitor class that has been demonstrated in clinical studies to be effective in the treatment of tumours associated with tuberous sclerosis complex, such as subependymal giant-cell astrocytoma, angiomyolipoma, and lymphangioleiomyomatosis.Reference Krueger, Care and Holland 4 – Reference Morton, McLean, Booth, Snell and Whitford 6 Moreover, case reports have been published in which everolimus has shown efficacy in reducing the neoplastic mass of cardiac rhabdomyomas associated with the tuberous cardiac complex.Reference Tiberio, Franz and Phillips 7 – Reference Dogan, Yesil and Kayali 9
In our patient, everolimus was evidenced to be highly, rapidly, and durably effective against cardiac rhabdomyomas. Clinical and arrhythmic improvements started after 10 days and lasted for the whole period of therapy and beyond. The reduction in the rhabdomyoma masses and the increased left ventricular volume allowed a biventricular circulation. The duration of everolimus therapy lasted only 10 weeks, but it resulted in substantial reduction in cardiac rhabdomyoma and renal angiomyolipoma masses, which persisted during the 9-month follow-up period. In our case, brain natriuretic peptide and troponin showed peculiar time variations related to the timing of left volume increase and rhabdomyoma mass reduction, respectively. Monitoring brain natriuretic peptide and troponin I levels might offer non-invasive methods to assess the impact and burden of the disease.
Brain natriuretic peptide, in particular, can be an early biomarker of positive response to treatment. After discontinuing the therapy, it can be an indicator of rebound growth of the rhabdomyoma. This, consequently, may limit the need for MRI.
We initially adopted a dose of everolimus of 1.5 mg/m2/day (0.11 mg/kg/day), which was half the dose used in the study of Krueger et alReference Krueger, Care and Holland 4 because we were concerned about the prematurity and the low birth weight of our patient. We needed to reduce the doses to maintain the therapeutic range. The final dose of everolimus was 1.0 mg/m2/day (0.06 mg/kg/day), considerably lower than the doses used in the study by Krueger. Contrary to Demir et alReference Demir, Ekici, Yazal Erdem, Emir and Tunc 8 , we preferred the daily dosage and, in this way, we avoided giving a high dose to an immature newborn. Only in a single case did we observe a mild increase in the level of everolimus outside the therapeutic range following a dose increase.
The effective and safe use of everolimus requires both accurate blood-level monitoring and a small dose adjustment.
Everolimus has been proven to be safe during the whole duration of therapy. The only side effect we observed was a mild and short-lived form of mucositis. Increased triglyceride levels was the single serum abnormality noted.
In conclusion, our case shows the effectiveness, safety, and duration of action of mammalian target of rapamycin inhibition with everolimus as a therapy for symptomatic life-threatening cardiac rhabdomyomas and renal angiomyolipoma associated with tuberous complex in very young patients and very small neonates. In cardiac rhabdomyomas, everolimus represents an alternative form of treatment of symptomatic patients who are not manageable with surgical intervention, and for highly symptomatic patients it suggests a potential alternative to surgery in the future. Moreover, everolimus offers an option for the treatment of patients simultaneously affected by multi-organ hamartomas.
Acknowledgements
None.
Financial Support
This research received no specific grant from any funding agency, commercial or not-for-profit sectors.
Conflicts of Interest
None.