I. Background
When asked to describe the characteristics of a certain wine, most people would rely on sensory descriptions. Adjectives such as “smooth,” “robust,” “full-bodied,” and “dry,” to name a few, are common among both novice and expert wine enthusiasts to describe the perceived differences in wines. These descriptors are subjective, and they can be inconsistent and often unreliable because opinions and personal preferences can vary greatly from person-to-person. This inconsistency of wine ratings by experts has been well-documented in previous studies (Hodgson, Reference Hodgson2008; Cao and Stokes, Reference Cao and Stokes2010; Cao, Reference Cao2014). But the importance of subjective qualities should not be overlooked. Oczkowski (Reference Oczkowski2016) found that subjective expert opinion had similar predictive power as objective qualities when predicting the prices of Australian wines. Luxen (Reference Luxen2018) examined the wine ratings by prominent critics and discovered that wines with below-average ratings tend to cost less (i.e., less than 35 euro), wines with higher ratings tend to cost more (i.e., between 35 and 100 euro). McCannon (Reference McCannon2020) constructed a regression model using wine ratings and wine texts review to predict the price of wines.
However, many of these subjective qualities can be broken down into objective measurements via chemical analysis. Use of chemical analysis to classify wines has been widely implemented with some success. Cabrita et al. (Reference Cabrita, Aires-De-Sousa, Gomes Da Silva, Rei and Costa Freitas2012) implemented principle component analysis, variance partition methods, and neural networks to classify wines based on non-flavonoid phenolic compounds. The study found that the variance partitioning method has the best performance. Beltran et al. (Reference Beltran, Duarte-Mermoud, Soto Vicencio, Salah and Bustos2008) employed both dimension reduction and pattern recognition techniques in the aroma classification on three types of Chilean wines (Cabernet Sauvignon, Merlot, and Carmenere), where the most successful classification algorithm has a correct-classification rate above 85%. Santos et al. (Reference Santos, Páscoa, Sarraguça, Porto, Cerdeira, González-Sáiz, Pizarro and Lopes2017) have conducted a classification study by geographical origin, applying partial least squares-discriminant analysis to vibrational spectroscopic data from Portuguese white wines and observed a misclassification rate of 12.3%. Using an ordered probit model, Corsi and Ashenfelter (Reference Corsi and Ashenfelter2019) found that weather patterns (summer rainfall, in particular) were significant in predicting expert vintage ratings.
These classification studies generally rely on high-dimensional datasets and “black box” machine-learning techniques. While capable of producing satisfactory classification results, such studies have limited capacity for clear interpretation. There are two main reasons: (1) many of the original objective measurements of wines (i.e., chemical compounds) are technical and difficult to understand for those without expert knowledge, and (2) with a large number of variables contributing to the algorithm, it can be hard to visualize the classification rules and determine which aspects of the data have the most significant effects (hence the “black box”). The ability to interpret these classifiers with familiar and relatable language is of great interest.
In this study, principal component analysis (PCA) is combined with a k-nearest neighbor (kNN) algorithm to produce a simpler and more interpretable classification rule. We used a publicly available dataset on wines with 13 highly correlated variables measuring their chemical compounds (Wine Data Set, 1991). The outcome variable for classification is cultivar, which represents three Italian varieties: Nebbiolo (the grape that produces Barolo and Barbaresco wines), Grignolino, and Barbera. The dataset has been cited by several articles and is commonly used to demonstrate machine-learning techniques, specifically within the realm of classification. For example, it has been used to show how combinations of linear and quadratic programming can be leveraged to create stronger classification algorithms (Bredensteiner and Bennett, Reference Bredensteiner and Bennett1999). Kubica and Moore (Reference Kubica and Moore2003) have employed the dataset to apply the learning explicit noise systems method to distinguish between corrupted and uncorrupted data. As recently as 2018, it has also been used to demonstrate the visualization of neural networks in classification problems (Duch, Reference Duch2018).
PCA can be thought of as a dimension reduction and feature extraction tool, which has been applied in wine data analysis. It identifies patterns in a (large) group of correlated variables and transforms the patterns into a reduced number of uncorrelated features (i.e., principal components) without loss of important information. In the previously referenced study analyzing aroma chromatograms (Beltran et al., Reference Beltran, Duarte-Mermoud, Soto Vicencio, Salah and Bustos2008), PCA was applied to reduce the number of classifiers from 600 original covariates to 20 principal components. The phenolic compounds study (Cabrita et al., Reference Cabrita, Aires-De-Sousa, Gomes Da Silva, Rei and Costa Freitas2012) also had success in reducing the dimensionality from 11 to 2 using PCA, while still maintaining roughly 85% of the original variability. There are also a number of studies applying PCA to the same dataset used in this article (Suthampan, Reference Suthampan2017; Zhong and Fukushima, Reference Zhong and Fukushima2006) to reduce the effects of multicollinearity, an unavoidable issue when dealing with a large number of correlated covariates. In this article, PCA is applied not only to reduce multicollinearity but also to make the results of our analysis more interpretable—an arguably greater benefit to using PCA in many cases.
The goal of this study is to transform complex classification rules into terms that are easily understood by any wine connoisseur. In the following section, we will take a closer look at the dataset in question, categorizing each covariate into different categories and examining the correlation between covariates. In the methodology section, a brief overview is provided for kNN classification and PCA. In the analysis and results section, we implement the procedures combining kNN and PCA to the dataset. In the discussion section, we will interpret our findings and provide direction for further analysis.
II. Examination of the Dataset
The dataset we use consists of measurements on 178 wines obtained from a chemical analysis of three different cultivars (i.e., Nebbiolo, Grignolino, and Barbera), grown in a region called Piedmont in northwestern Italy. The data from the chemical analysis includes 13 numerical explanatory variables: Alcohol, Malic Acid, Ash Levels, Alkalinity of Ash, Magnesium Levels, Total Phenols, Flavonoids Phenols, Non-flavonoid Phenols, Proanthocyanins, Color Intensity, Hue, OD280/OD315, and Proline.
Nebbiolo, Grignolino, and Barbera cultivars produce red wines. The Nebbiolo-based wines Barolo and Barbaresco wines are inarguably the most renowned wines from Italy. They are aromatic with a floral character and have bright ruby color that fades over time. They have elevated acidity (makes the tongue feel wet) and tannins (makes the tongue feel astringent and dry), which are critical features of their success. They also have relatively high alcohol levels. Known to be the most widely grown grape in Piedmont, Barbera produces ruby-hued wines that have bright cherry flavors, floral and spicy aromas, and high alcohol levels. These grapes are high in acidity and have softer tannins and some roundness, which gives a sense of viscosity and thickness to the wine. Grignolino grapes produce wines that are less popular compared to the Nebbiolo-based Barolo and Barbaresco, or Barbera but are known for their extraordinary pale red color. Although the acidity level and tannin level of these grapes are high, Grignolino wines are known for the absence of warmth and intrigue. They tend to have fruity aromas, fruity and herbal flavors, and light alcohol levels (Wine-Searcher, 2020).
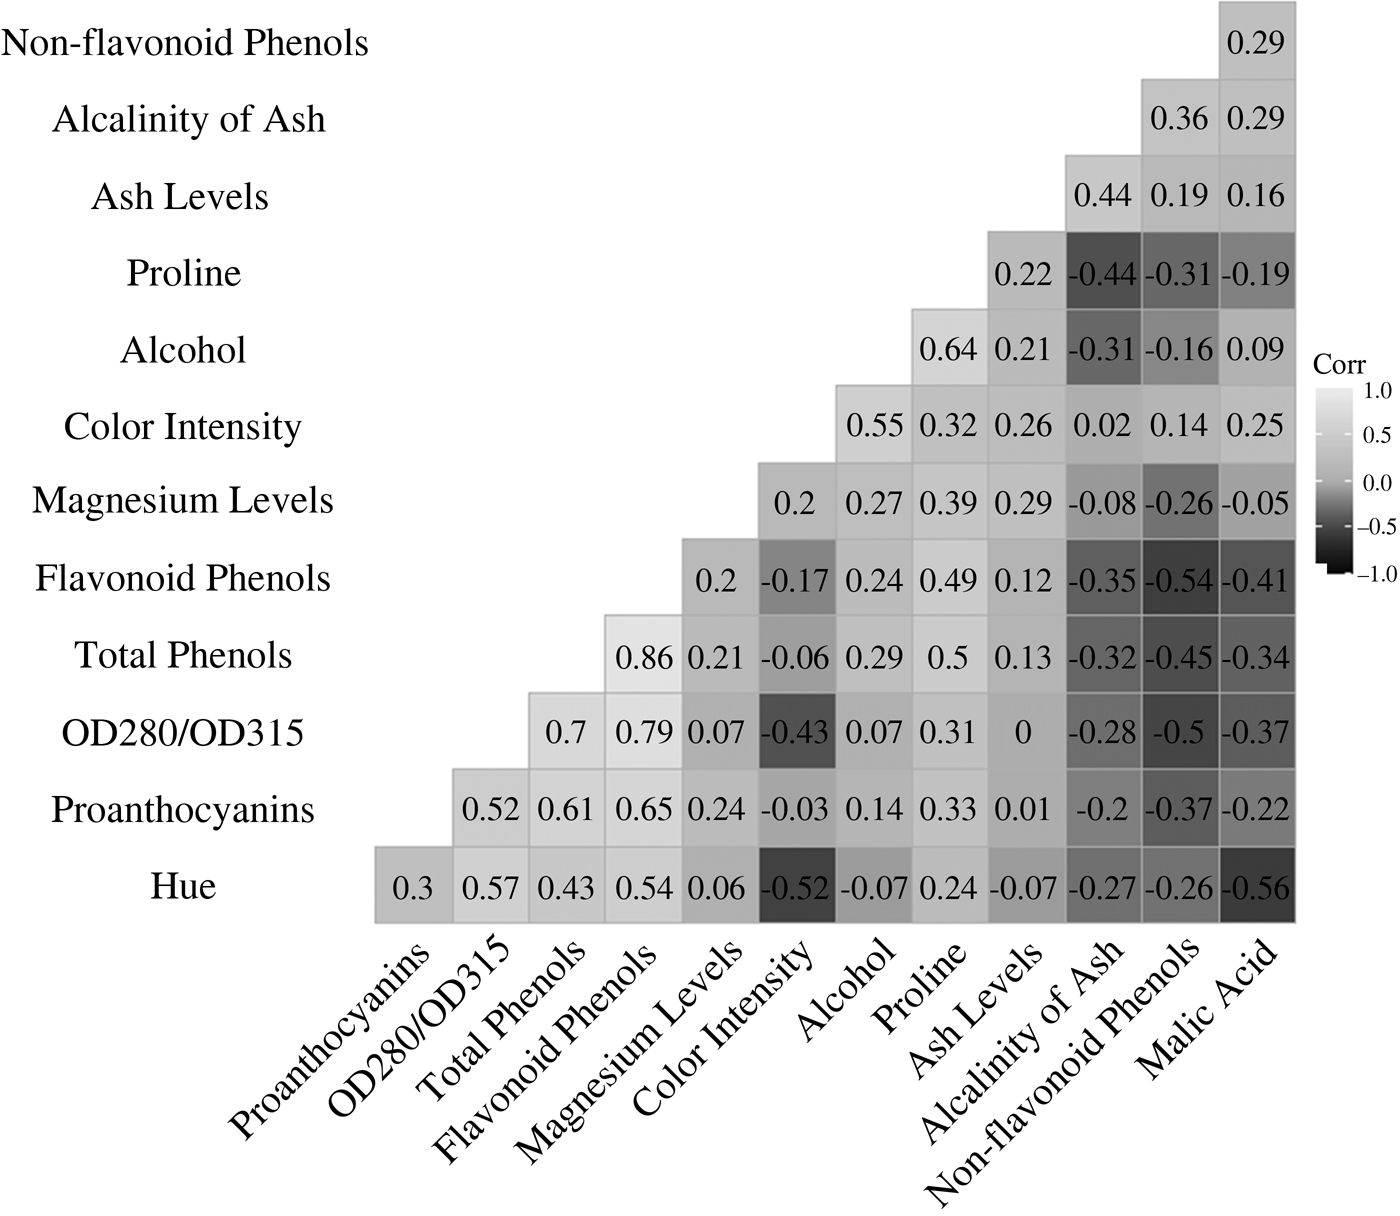
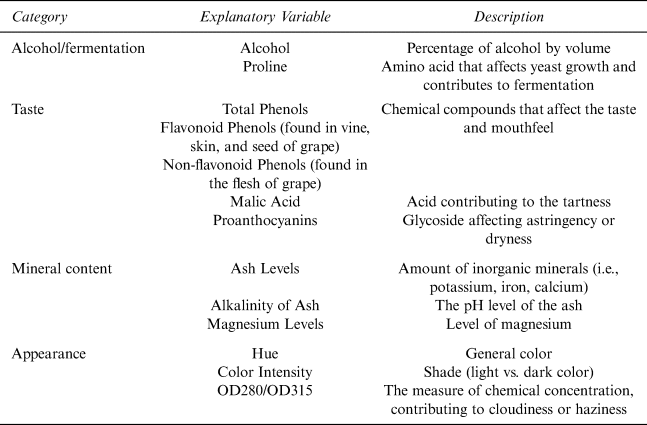
To better understand the relationship among the 13 explanatory variables, we categorized them as described in Table 1. It is essential to take note that these were broad categorizations based on the similar traits observed in the variables and that they are not strictly defined categories. Resonating the similarities that we see in Table 1, the correlation matrix in Figure 1 shows that most of the variables are highly correlated (the higher the correlation between variables, the higher the intensity of the color in Figure 1). As we emphasized earlier, since these are not strictly defined categories, we also observe a high correlation between variables across the categories. For example, the variable OD280/OD315 in “Appearance” shows a high correlation (magnitude of correlation > 0.5) with the three variables that describe the Phenol content in “Taste.” In addition, the variables Alcohol in “Alcohol/Fermentation” and Color Intensity in “Appearance” also have a high correlation.
Sample Correlation Matrix of the Explanatory Variables

Description and Categorization of the Explanatory Variables

Our primary goal is to categorize wines by cultivar with an interpretable classifier based on the information of this chemical analysis. The initial correlational examination demonstrates high levels of multicollinearity present in the data. The methods we used in the study are constructed to reach our goal while dealing with the significant multicollinearity among a large number of covariates in the dataset.
III. Methodology
In this section, we briefly introduce PCA and kNN classification with 10-fold cross-validation, which we use to decide the optimum kNN algorithm.
A. PCA
PCA is primarily a dimension reduction method. That is, if we have a dataset with a large number of correlated variables, we can use PCA to transform those to a smaller number of uncorrelated principal components that would still explain most of the information in the dataset. The use of PCA paves the way for the interpretation of the data structure based on the underlying dominant features that are capable of providing a more accurate summary of the correlated covariates.
Principal components are linear combinations of the original variables. If there are g number of variables, we can produce g number of principal components. The first principal component (PC1) explains the highest proportion of variance within the data. The second principal component (PC2) is independent of PC1, and it explains the second-highest proportion of variance within the data. Likewise, the subsequent PCs will have the next highest proportion of variance, and they will be independent of the others. Theoretically, all g PCs are required to reproduce the total variability structure. However, most of the variability can often be captured by a much smaller number (h, h ≪ g) of PCs (Johnson and Wichern, Reference Johnson and Wichern2019) without loss of important information. Reducing the dimension in a dataset helps make data analysis more efficient and data visualization more straightforward. Usually, we standardize the variables before PCA is employed to avoid issues of variables with larger scales dominating variables with smaller scales.
B. Classification: kNN Classification with Cross-Validation
One of the simplest classification learning algorithms is the kNN classification. It is a non-parametric learning algorithm that identifies the k nearest neighbors in the dataset to a new instance and assigns the most common label of the k nearest neighbors to the new instance based on a similarity measure. The similarity measure that we used in our study is the following Euclidean distance,

where d(x p, x q) is the square root of the sum of the squared differences between a new instance (x p) and an existing instance (x q) across all input attributes j = (1, …, D).
The value k is known as the tuning parameter, and it has a direct effect on the performance of kNN. A conventional approach to choose k is through cross-validation. In particular, we employ the 10-fold cross-validation, where we randomly split the dataset into ten folds. Then, we keep one of the folds as the test set and use the training data in the other nine folds to predict the labels for wines in the test set. We rotate this procedure ten times for all the folds and obtain the average of the misclassification rates across all the rotations pertaining to a particular choice of k. By conducting this procedure over a range of values of k, we can identify the optimal value for the tuning parameter in kNN.
IV. Analysis and Results
In the analysis, we first applied PCA to the 13 variables on the chemical compounds to reduce the dimensionality and extract underlying features on the chemical property of the wines. Then we used cross-validation to determine the optimal number of PCs and the number of neighbors (k) used in kNN. Our analysis found that using only the first two PCs yielded the best classification performance.
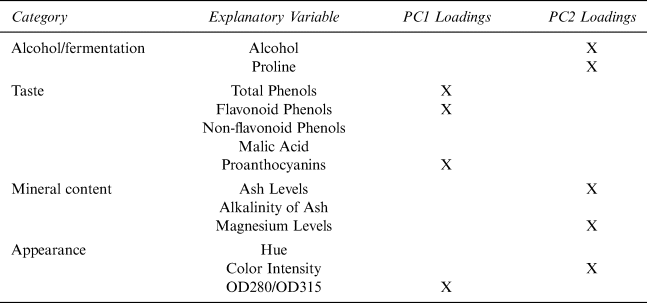
Table 2 provides a summary of covariates that have large contributions in the formation of PC1 and PC2. Of the four important variables in PC1, three of them (Total Phenols, Flavonoid Phenols, and Proanthocyanins) are measurements related to “Taste,” while OD280/OD315 measures the cloudiness or haze of wine under “Appearance.” Although we have divided these variables into distinct categories, it is clear from the correlation matrix (Figure 1) that there is a certain amount of overlap across the categories. Given that OD280/OD315 has a strong positive correlation with these “Taste” variables and that it also measures the concentration of chemical compounds, it is reasonable to interpret PC1 as a measure on the strength of the taste of wines.
Structure for the First 2-PCs with the Key Variables

Table 2 also shows that Color Intensity, Alcohol Content, Proline, Ash Levels, and Magnesium Levels are the key variables in the construction of PC2. Alcohol Content and Proline are both related to fermentation (Table 1). Color Intensity, although in the appearance category, has a strong association with Alcohol and a moderate association with Proline, which is shown in the correlation matrix (Figure 1). Ash Levels and Magnesium Levels also have a moderate association with Alcohol and Proline. Based on this examination, it is reasonable to interpret PC2 mainly as a measure of alcohol and fermentation levels.
We incorporated principal component (PC) selection in the cross-validation process and treated the number of PCs and the number of neighbors in kNN as the tuning parameters. Under each configuration of the tuning parameters, we repeated the 10-fold cross-validation 105 times with randomized training/testing split and computed the averages to be the empirical misclassification rates.
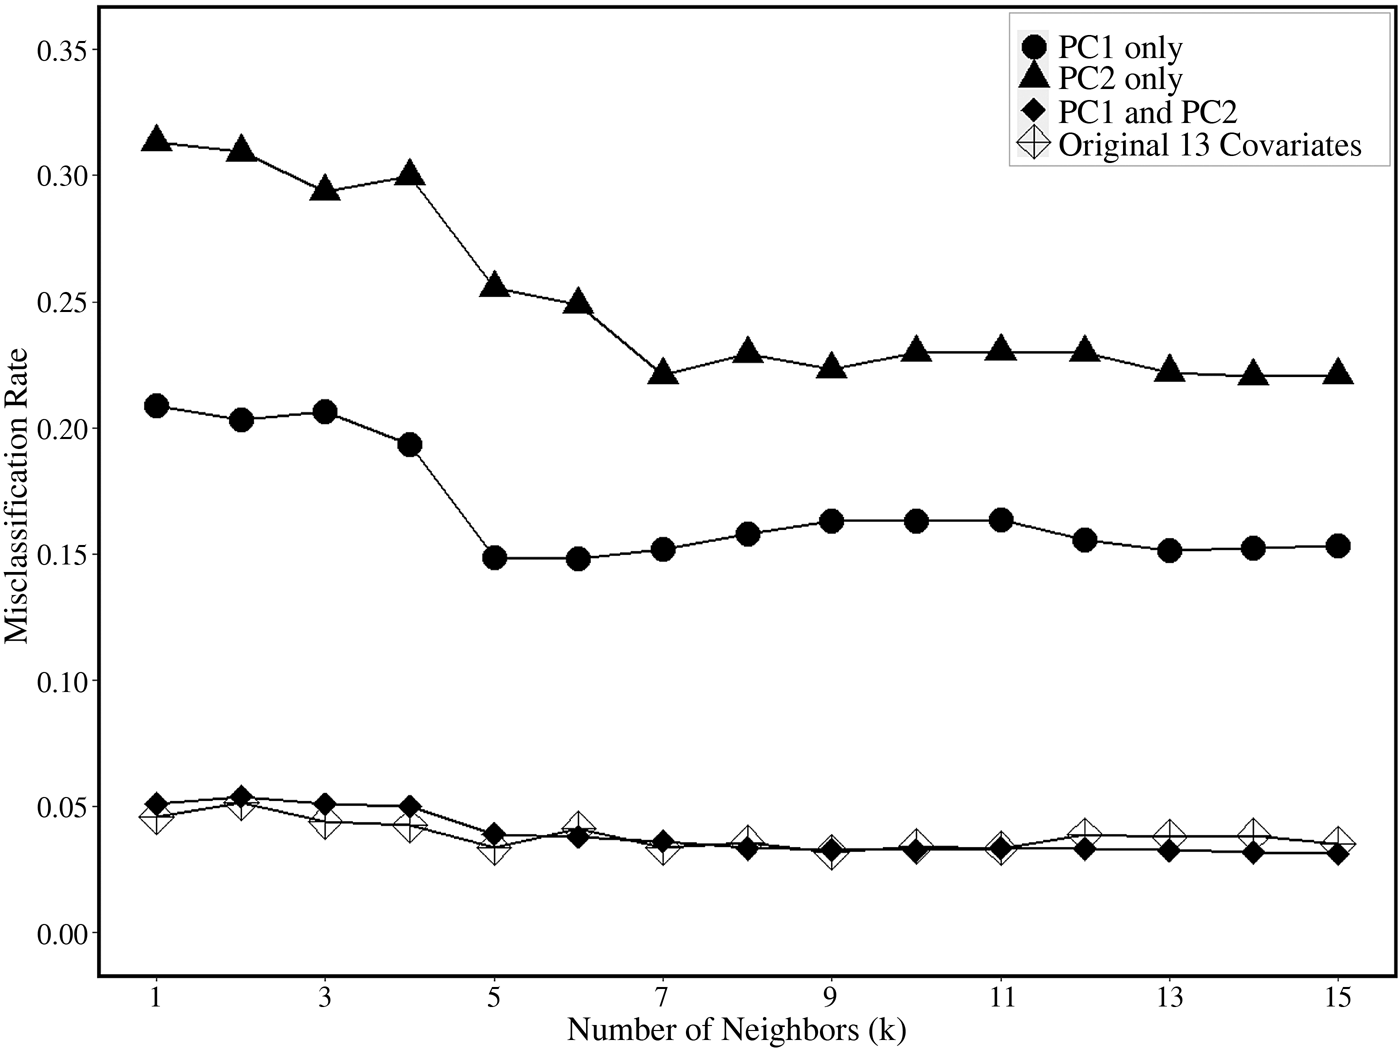
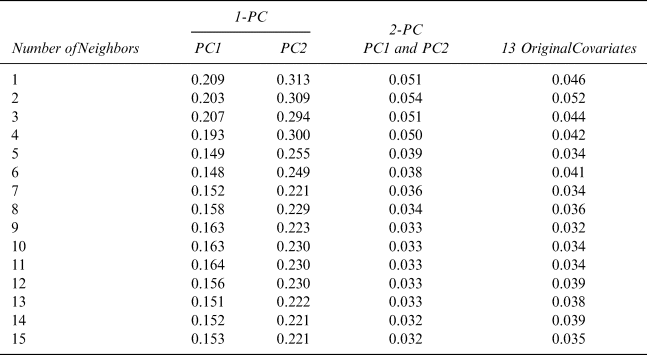
In the remainder of the section, we compare different classifiers with and without PCA. The misclassification rates for the different classifiers are reported in Table 3. They are also plotted against each other for a more straightforward visual comparison in Figure 2. In the 1-PC case, we applied the kNN algorithm to one PC at a time (i.e., only on PC1 and only on PC2, respectively). The lowest misclassification rate achieved by PC1 is around 15% at k = 5, whereas the lowest rate on PC2 is about 22% at k = 15. Note that kNN with PC1 enjoys a substantially lower misclassification rate, by a margin of about 10% on every configuration of k than that with PC2.
Misclassification Rates Among Different Classifiers

Misclassification Rates Among Different Classifiers

In the 2-PC case, the kNN algorithm is applied to the first two PCs (i.e., on PC1 and PC2 together). The misclassification rate in the 2-PC case demonstrated a substantial improvement over the 1-PC case. As shown in Figure 2, the lowest misclassification rate is achieved at 3.3% at k around 10. We also examined the performance of classification with more than two PCs and found that adding more PCs in addition to the first two PCs will not reduce the misclassification rate. Furthermore, the performance of the 2-PC classifier is almost the same as that of the kNN classifier based on the 13 original variables. Taken together, the 2-PC classifier with k = 10 seems to provide an optimal balance between classification accuracy and interpretability.
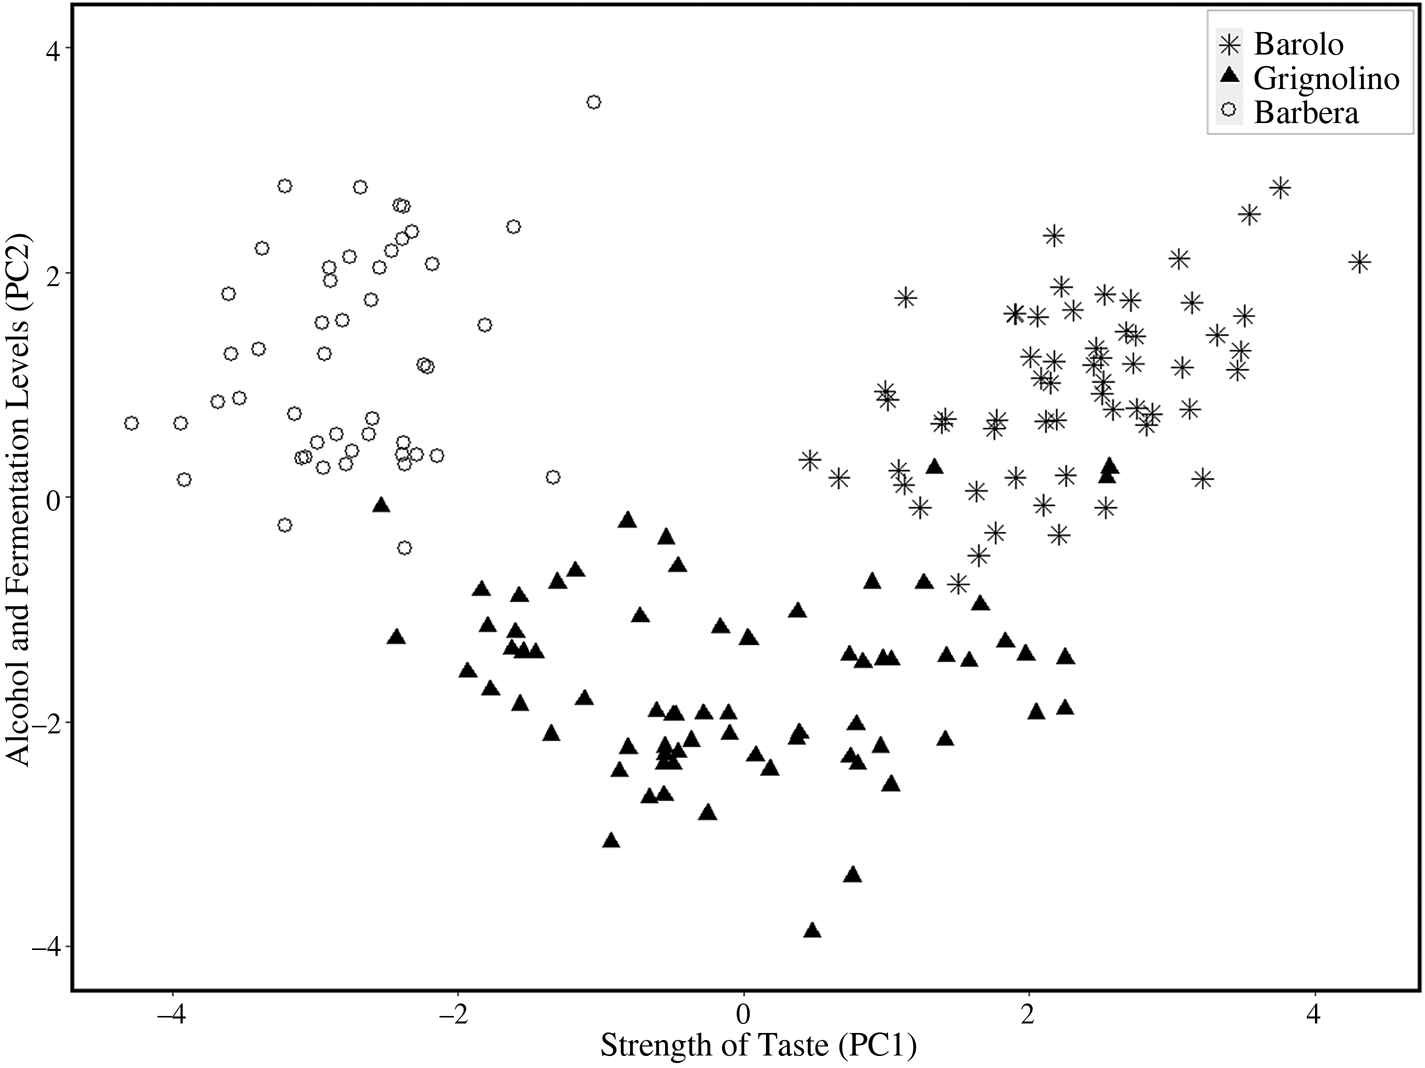
Now we take a more in-depth examination of the classification results comparing the 1-PC classifier and the 2-PC classifier. In Figure 3, all 178 observations in the dataset are denoted with an asterisk, filled triangle, and circle corresponding to their respective cultivar labels (i.e., Nebbiolo, Grignolino, and Barbera). The coordinates of the observations are their respective PC1 and PC2 scores. Notice that there are three distinctive clusters belonging to the three cultivars. On the PC1 dimension (i.e., the strength of taste), Nebbiolo wines have the weakest strength, Grignolino wines have medium strength, and Nebbiolo wines have the strongest. On the PC2 dimension (i.e., level of alcohol and fermentation), Nebbiolo and Barbera wines have mostly positive values, whereas the Grignolino cluster has mostly negative values. Figure 3 unveils the reason for the classifier to perform relatively poorly in the 1-PC case. The data in the 1-PC case correspond to the projections of observations in the scatter plot onto the PC1 axis and to the PC2 axis, respectively. In the PC2-only case, it is evident from the graph that many observations would be mingled together on the PC2 coordinates, that is, Nebbiolo and Barbera are indistinguishable by PC2. In the PC1-only case, Nebbiolo and Barbera overlap with Grignolino, yet the overlapping is not quite as severe as that observed in the PC2-only case. This explains the improvement in the lowest misclassification rate by the PC1-only classifier (15%) over that by the PC2-only classifier (22%). By comparison, the 2-PC classifier results in a much better separation of the three cultivar groups, where they can be almost perfectly classified. Lastly, although the kNN classifier based on the 13 original variables has very similar performance compared to the 2-PC classifier, it cannot be interpreted based only on two features, nor can it be visualized in such a simple and informative plot.
Scatter Plot of Wines on the PC1 and PC2 Coordinates

V. Discussion
In this article, we show that kNN classification combined with PCA can be an efficient classifier with straightforward interpretation, which helps to shed light on the important features of wines in the classification. Due to the advantage of only using a small number of principal components in kNN, we can easily evaluate the importance of each feature, represented by individual principal components. In addition, data visualization of the classifier can be constructed with less effort while delivering insightful information in the classification.
The misclassification rate achieved by this study is relatively standard for this dataset. However, the interpretation of the classifier in this analysis deserves more attention. As discussed in the introduction, intelligible interpretation is something many studies of this type lack, despite its importance to wine research. Based on a review of the current literature, this study is the first analysis of this particular dataset to describe the classification algorithm in terms easily understood by all.
Although the misclassification rate is good by many standards, this study cannot make broader inferences to other types of wine outside of Nebbiolo, Grignolino, and Barbera. However, it does provide a template for future analysis of wine classification that can be easily interpreted. Applying these methods to data with a greater number of variables and a broader variety of cultivars will be the subject of further analysis.