Introduction
Agricultural production will be impacted by future climate change in multiple ways. Besides efforts on the reduction of greenhouse gas emissions, it demands adaptation of plant and livestock production to alleviate losses, capture benefits and manage changing risks. Impacts on livestock can be direct or indirect and determine the quantity and quality of livestock products (Mader et al., Reference Mader, Frank, Harrington, Hahn and Nienaber2009). Indirect impacts include changes in feed quality and quantity, water availability or infestation of pests and diseases. More directly, weather conditions can affect animal welfare, behaviour and physiology, such as by altering feed uptake and digestion. Vulnerability to climate change can be described as a function of climate sensitivity, exposure and adaptive capacity (see e.g. McCarthy et al., Reference McCarthy, Canziani, Leary, Dokken and White2001). Consequently, direct impacts from changing weather conditions are of specific importance to sensitive livestock (e.g. sensitive on high temperatures) in production systems with limited control options of the microclimate, such as for cattle production in Austria.
Several studies analysed direct climate change impacts on livestock. Mader et al. (Reference Mader, Frank, Harrington, Hahn and Nienaber2009) modelled hog, beef and dairy production in the mid-US region under climate change up to 2100 with mixed results. With respect to milk yields, changes are between −1.0% and −7.5% for the summer period from June to October. A model study on climate change impacts in Lower Saxony (Germany) by Martinsohn and Hansen (Reference Martinsohn and Hansen2013) results in annual milk yield losses of up to 0.4% over the total lactation period for the years 2071 to 2100. Although these studies link changing weather conditions, mainly temperature and humidity, to livestock productivity, others remain at the level of biophysical impacts on livestock well-being (e.g. Fuhrer and Calanca, Reference Fuhrer and Calanca2012). Nevertheless, they all have in common the application of temperature–humidity indices (THI) that can be linked to yield effects based on experimental and statistical data.
In Austria, dairy and cattle production are among the most important sectors with respect to agricultural production values and farm incomes. Several climate impact studies on the plant production sector or selected crops from local to national levels are available and reveal mixed impacts with both gains and losses in average productivity owing to heterogeneity in climate zones and production systems (e.g. Thaler et al., Reference Thaler, Eitzinger, Trnka and Dubrovsky2012; Schönhart et al., Reference Schönhart, Mitter, Schmid, Heinrich and Gobiet2014). With respect to the impacts on livestock production, integrated modelling frameworks on land use at the national level assess changes in forage quantity (Kirchner et al., Reference Kirchner, Schmidt, Kindermann, Kulmer, Mitter, Prettenthaler, Rüdisser, Schauppenlehner, Schönhart, Strauss, Tappeiner, Tasser and Schmid2014; Schönhart et al., Reference Schönhart, Mitter, Schmid, Heinrich and Gobiet2014) but do not include direct impacts on livestock productivity. In this article, we contribute to this research gap by applying THI models to be eventually included in integrated modelling frameworks. We estimate direct climate change impacts on milk yields and sales revenues for dairy and suckler cows at national level, taking into account uncertainty in model and parameter choices.
Material and methods
We apply regionally downscaled climate change data at daily resolution. Data are derived from the regional climate model ALADIN driven by the global climate model ARPEGE under the greenhouse gas emission scenario SRES A1B. Climate data are input to five THI models to estimate daily THI values at NUTS-3 spatial resolution from 1951 to 2100. Walter and Löpmeier (Reference Walter and Löpmeier2010) review publications on THI models. We select the five most recent models presented in their study (see Table 1).
Overview on THI models applied to NUTS-3 regions (based on Walter and Löpmeier, Reference Walter and Löpmeier2010)

THI=temperature–humidity indices; Tdb=dry bulb temperature; RH=relative humidity (%); Tdp=dew point temperature; Tmax=maximum daily temperature; RHmin=relative humidity (%) at Tmin; RHmax=relative humidity (%) at Tmax; Tmin: minimum daily temperature.
1 For Rava_Misz, we apply the original formulation presented in Ravagnolo and Misztal (Reference Ravagnolo and Misztal2000).
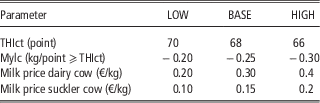
In order to estimate milk yield losses, THI values above critical thresholds (THIct) are linked to milk yield loss coefficients (mylc) for each additional THI-point (THIp) above mylc per day. To estimate losses in milk sales revenues at NUTS-3 and national levels, physical yield losses are valued by assumed milk prices, milk yields and cow numbers based on national statistics for the year 2010 (BMLFUW, 2013). We correct for the non-lactating (dry) period by multiplying the estimates with a factor of 0.8125, assuming equal distribution of non-lactating periods during a year. Owing to lacking data, we assume milk yields for suckler cows and value their milk yield losses by a fictitious market price (see Table 2). Results are calculated for each day, but presented as 30-years average for the periods 1981 to 2010 and 2071 to 2100 to reveal impacts from climate trends. Uncertainties are a major concern in climate change impact studies. Consequently, we apply five THI models and three scenarios on parameter assumptions to show a range of possible impacts (see Table 2). The scenario BASE represents an average market price situation. Parameters to estimate milk yield losses in BASE are derived from the study by Kolb (Reference Kolb2012). He revealed significant negative relationships between THI levels and yields in a typical Austrian dairy region based on milk yield records of an individual farm and a proximate weather station. The LOW scenario represents lower climate change impacts, by assuming a higher THIct, lower mylc and milk prices. On the contrary, HIGH is characterized by a low THIct, but high mylc and milk prices.
Scenario assumptions on parameter values

THIct=temperature–humidity indices values above critical thresholds; mylc=milk yield loss coefficients.
Results
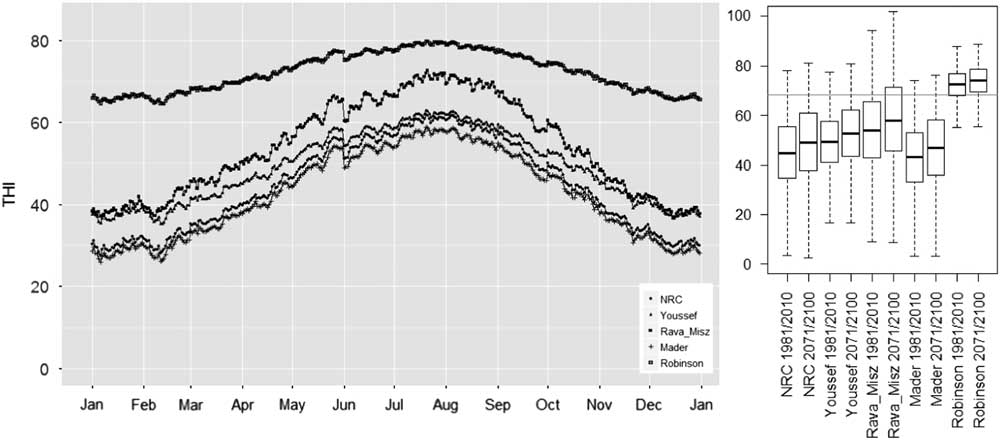
Outputs of the five THI models are heterogeneous for both absolute THI levels and distribution within an average year in the period 1981 to 2010 (Figure 1, left). Although National Research Council (NRC), Youssef, Rava_Misz and Mader, all show correlated temporal trends and, except for Youssef, also similar absolute levels, the THI model Robinson results in considerably higher THI values and a flatter curve within the year. As has been expected, all models share a general temporal pattern with lower THI values during the winter months and a peak in July and August. Figure 1 (right) presents the distribution of THI values over all NUTS-3 regions and two periods 1981 to 2010 and 2071 to 2100. All five THI models show increasing average THI values between +1.6 to +4.5 points at the aggregated national level. Furthermore, all NUTS-3 regions face increasing THI values and ranges over the years in a period, which indicates increasing variability in weather conditions.
Average daily THI values for five THI models in the period 1981 to 2010 at national level (left); distribution of THI values over all days and NUTS-3 regions for the periods 1981 to 2010 and 2071 to 2100. The grey line indicates THIct of the BASE scenario (right). THI=temperature–humidity indices.

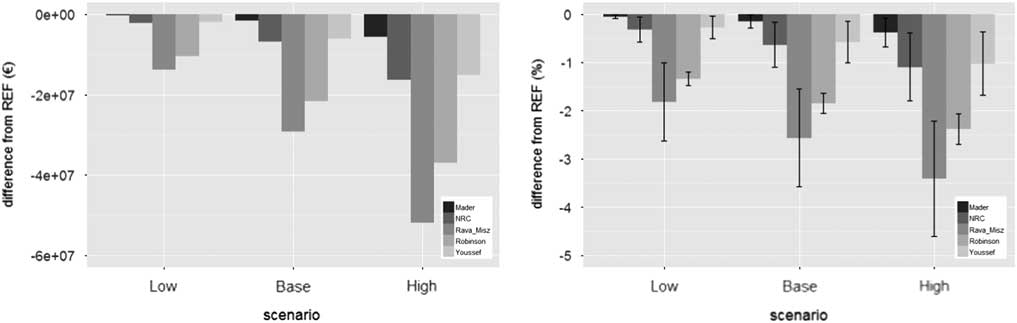
Figure 2 presents the economic losses in milk sales revenues from climate change in the period 2071 to 2100 compared with the reference period 1981 to 2010. Absolute losses (Figure 2, left) at the national level range from 0 to 50 million €, depending on the THI model and scenario. Estimates are based on current livestock numbers. The largest losses are from THI model Rava_Misz. Impacts according to the model Mader are rather low, although both models are sensitive to climate change (compare Figure 1, right). Although climate change in Rava_Misz substantially increases THI values beyond THIct, the model Mader remains below it (for a discussion on the unequal robustness of these results, see the ’Discussion’ section). Relative impacts (Figure 2, right) from climate change, that is, yield losses relative to total production in a NUTS-3 region, are modelled between 0% and 3% on a national average for the period 2071 to 2100. Variation of losses among regions is between 0% and 6% and dependent on the THI model and scenario.
Absolute (left, in €) and relative (right, in %) losses of annual milk sales revenues from climate change impacts in the period 2071 to 2100 for five THI models and three scenarios (changes from the period 1981 to 2010; bars in the right figure indicate s.d. with n=35 NUTS-3 regions). THI=temperature–humidity indices.

Discussion
Results indicate increasing pressures from climate change on milk yields in the future, although the impacts appear moderate compared with those estimated for the plant production sector in recent studies (e.g. Schönhart et al., Reference Schönhart, Mitter, Schmid, Heinrich and Gobiet2014). We ran scenarios and applied five THI models to cover methodological uncertainties and to depict a range of possible impacts. However, not all results are equally robust and uncertainties remain. It includes the future climate – only one climate scenario has been considered in this study – or the aggregation bias from average climate conditions in a NUTS-3 region, which are different to those on pastures and in barns at a particular place. Bohmanova et al. (Reference Bohmanova, Misztal and Cole2007) reveal the importance of THI model choices according to regional climate conditions. Models, THIct and mylc need to be calibrated with empirical data. The assumptions on THIct and mylc in the BASE scenario are derived from observations but aligned to only one of the five THI models, that is, NRC (c.f. Kolb, Reference Kolb2012). Consequently, results for NRC in BASE are more robust than others. The reduction of 0.6% in annual milk yields at the national average in 2071 to 2100 for NRC in BASE is similar to the losses of 0.4% estimated for Lower Saxony (Martinsohn and Hansen, Reference Martinsohn and Hansen2013).
The results from THI models Rava_Misz and Robinson as well as assumptions under scenario HIGH appear unlikely. Although annual losses in sales revenues in these model–scenario combinations would be substantial, they are not equal to farm income losses. Farmers can adapt to climate change, for example, by installing low-tech options such as fans or sprinklers, providing shading on pastures or breeding more robust livestock. Grazing on elevated pastures during summer may be a further option in Alpine regions (Fuhrer et al., Reference Fuhrer, Smith and Gobiet2013). Furthermore, these results do not take into account possible savings from reduced feed uptake under heat stress (e.g. Walter and Löpmeier, Reference Walter and Löpmeier2010), eventual increases in milk yields owing to warmer winters, changes in pest and disease pressures, and impacts of climate change on milk quality, as well as feed quantities and quality. Martinsohn and Hansen (Reference Martinsohn and Hansen2013) conclude that benefits from increasing maize yields outweigh the losses leading to net benefits from climate change in their German case study region. Increasing productivity of Austrian grasslands in the humid western regions (Schönhart et al., Reference Schönhart, Mitter, Schmid, Heinrich and Gobiet2014) may allow similar conclusions. Such diverging effects can be analysed once THI models are included in integrated modelling frameworks.
Conclusions
This article presents possible direct impacts of climate change on milk yields of Austrian cows. A total of five THI models were applied to account for changes in temperature and humidity at NUTS-3 level. THI values were linked to milk loss coefficients, and physical milk yield were valued by market prices to reveal losses in sales revenues. All THI models show increasing THI levels for the national aggregate and all NUTS-3 regions. This implies increasing pressures on livestock production under the assumed climate change scenario. The most plausible results show a loss of 0.6% in annual milk yields at aggregated national level with considerable variation among NUTS-3 regions, which can be reduced by adaptation. Calibrated THI models appear as robust tools, which can be easily included in integrated modelling frameworks on climate change impact assessment. To further reduce uncertainties, more research is required to calibrate THI models under regional circumstances and to cover other climate change impacts such as on livestock pests and diseases.
Acknowledgements
Research has been supported by CATMILK (Adaptation in Austrian cattle and milk production; Austrian Climate Research Programme, ACRP) and by the Federal Ministry of Agriculture, Forestry, Environment and Water Management of Austria within the FACCE-JPI Knowledge Hub MACSUR.
Further information
The LiveM International Livestock Modelling and Research Colloquium was hosted by the Basque Centre for Climate Change (BC3) at the Maritime Museum in Bilbao, Spain between 14 and 16 October 2014. LiveM is the livestock and grassland modelling theme of the EU knowledge hub Modelling European Agriculture with Climate Change for Food Security (MACSUR). The MACSUR project is a pilot knowledge hub started by FACCE-JPI in 2012. It provides an opportunity to explore the role and potential of multi-disciplinary networking structures to address complex regional and global issues. More information on MACSUR and the LiveM theme can be found at www.macsur.eu, with PDFs of slides from conference presentations available through the conference website (http://www.livem2014bilbao.com/).