


I. INTRODUCTION
In modern communication systems highly efficient transmitters are desirable for simplifying heat sinking, reducing dc power consumption and cost, and increasing reliability, with regard to both base station and handset applications. On the other hand, the major contribution in overall efficiency is related to the final stage of the transmitter, that is the power amplification stage, and several efforts have been made during the last years to design highly efficient power amplifiers (PAs).
In this context, switched mode PAs are good candidates for high-efficiency operation. In particular, the adoption of Class E strategy, firstly proposed by Sokal and Sokal in the 1970s [Reference Sokal and Sokal1], has been receiving a large amount of interest from radio frequency (RF) PA designers, thanks to its simplified design formulas and its high performances in terms of output power and efficiency.
In a Class E PA, the switching behavior of the active device and the absence of power delivered at harmonics of the fundamental frequency allow one to minimize DC power consumption and achieve an ideal unitary efficiency.
These conditions are obtained by the proper design of the output matching network, whose component's values are determined in closed-form expressions and satisfy the operating conditions stated by Sokal and Sokal [Reference Sokal and Sokal1].
To date, many papers have already demonstrated the possibility of integrating the Class E PA either in wireless systems such as global system for mobile communications/general packet radio service (GSM/GPRS), universal mobile telecommunications system (UMTS), and wireless local area network (WLAN) terminals [Reference Ui and Sano2] or in PA architectures such as envelope elimination and restoration [Reference Wang, Peng, Yousefzadeh, Maksimovic, Pajic and Popovic3].
However, the nonideal switching operation of the active device is still a critical issue, in particular when the operating frequency increases. In fact, a maximum operating frequency (f Max), derivable from a simplified analysis, exists even for an ideal Class E PA and is directly dependent on the device physical limits (I Max and breakdown voltage) and inversely dependent on bias point (V DC) and device output capacitance (C ds). Even if some solutions could be adopted by changing the value of V DC, Class E maximum operating frequency is mainly determined by the value of C ds, andis usually limited to a few gigahertz [Reference Mader, Bryerton, Markovic, Forman and Popovic4].
Nonetheless, Class E PA development recently registered an improvement related to the proliferation of emerging technologies such as SiGe–HBT and Si–LDMOS devices [Reference Popp, Lie, Wang, Kimball and Larson5]. The former, thanks to high cut-off frequencies, represents a useful solution to minimize problems related to f Max [Reference Milosevic, van der Tang and van Roermund6]. Anyway, for base station applications a high output power level is required, thus making LDMOS devices preferable when compared to SiGe–HBT [Reference Litwin, Chen, Johansson, Ma, Olofsson and Perugupalli7], thanks to their higher breakdown voltage and maximum allowable current. However, LDMOS maximum frequency in Class E operation is limited to hundreds of megahertz.
The aim of this contribution is to determine how it is possible to extend the Class E operating mode above the stated maximum frequency, through the optimization of the voltage waveform and the proper choice of fundamental load impedance. The approach described herein is based on a numerical optimization of load impedance. In order to validate the proposed methodology, a 2.14-GHz Class E PA in LDMOS technology has been designed and characterized and its performances are discussed in this paper.
II. FREQUENCY DOMAIN ANALYSIS
A) Low frequency-domain analysis
The basic topology of the single-ended Class E PA is depicted in Fig. 1. The power dissipated in the active device is minimized through a switching mode operation, while the output network is designed to ideally filter out the power delivered at harmonic frequencies of the fundamental one. As a result, a theoretical maximum efficiency of 100% is achieved. In order to carry out a simplified closed-form analysis of a Class E amplifier, referring to Fig. 1, it is convenient to assume the active device as a perfect switch, its output capacitance C ds included in the capacitance C 1, and the series C 0–L 0 acting as an ideal filter at operating frequency. Under these assumptions, the values of R L, ΔL, and C 1 can be dimensioned to satisfy the Class E operating conditions formulated by Sokal and Sokal in [Reference Sokal and Sokal1], i.e.
1) a purely sinusoidal current across the load R L;
2) zero voltage switching condition (ZVS), which implies nonsimultaneous nonzero voltage and current across the switch;
3) zero voltage derivative switching condition (ZVDS), which implies that the current starts to increase from zero after the switch is turned on.
Classical Class E topology.

Time domain expressions derived in [Reference Mader, Bryerton, Markovic, Forman and Popovic4] are herein reported for convenience, considering the most common case of a 50% duty cycle. The total current is written as the sum of a DC component that is the bias current I DC, and a sinusoidal component, having its own amplitude a and its phase φ, which are determined applying ZVS and ZVDS conditions [Reference Mader, Bryerton, Markovic, Forman and Popovic4]:

The voltage across the switch is obtained by integration of the current during the OFF period and is given by

Class E ideal voltage and current waveforms are shown in Fig. 2. Although Class E PA time domain analysis is a relatively simple and straightforward process, a frequency domain approach is useful to better describe the harmonic content of switch voltage and current and to easily determine the load impedances Z n at fundamental frequency and at its harmonics.
Ideal Class E waveforms.

Applying a Fourier analysis on the current and voltage waveforms, their harmonic coefficients are expressed by [Reference Mader, Bryerton, Markovic, Forman and Popovic4]

where I DC is the DC drain current component, and

where Ψn assume the following expression:

Therefore, the optimum fundamental impedance Z 1 (see Fig. 1) to be synthesized at the switch terminals to fulfil Class E requirements is simply expressed by the ratio between fundamental frequency components of device voltage and current, given by

From the above analysis, it is worth noting that a dependence on frequency only appears in the voltage Fourier coefficients, while current coefficients are unaffected. This would suggest some consequence on high-frequency Class E design and it has been exploited in the presented analysis, leading to interesting conclusions reported in the following.
B) High frequency-domain analysis
Closed-form expressions and the use of a very simple load network justify the attractiveness of the Class E approach. However, even considering ideal conditions for the output matching network and waveforms, a frequency limit in Class E operation can be inferred [Reference Mader, Bryerton, Markovic, Forman and Popovic4, Reference Colantonio, Giannini, Giofrè, Yarleque Medina, Schreurs and Nauwelaers8], depending upon bias voltage, device maximum current, and device output capacitance C ds. An approximate expression is given here:

Being a lower limit of C 1 represented by the device output capacitance C ds, the Class E operating frequency is intrinsically limited by the active device itself. Above this maximum frequency, Class E wave shaping is no longer satisfied and the ideal Class E behavior could not be obtained.
This limitation has to be taken into account, especially for micro- and millimeter-wave applications. Usually, at these frequencies the switching behavior of any active device suffers from the presence of parasitic effects, which tend to increase switching time transitions, resulting in low-pass filtering behavior. Hence, the loss of higher frequency voltage components does not allow the desired wave shaping, with a consequent degradation in power and efficiency levels.
As a consequence, considering the active device as the parallel connection of a perfect switch and the parasitic capacitance C ds, the higher voltage harmonics are assumed as effectively shorted by C ds and only a few harmonic loads can be reasonably controlled [Reference Mader, Bryerton, Markovic, Forman and Popovic4, Reference Raab9]. At the same time, the current waveform can still be considered unaffected. The resulting drain voltage and current waveforms are depicted in Fig. 3.
Drain waveforms considered in the analysis: the current is unaffected, while the voltage is truncated at the third order.

Although still representing a good approximation of Class E behavior [Reference Raab9], it is clear from Fig. 3 that the new drain voltage waveform does not fulfil ZVS and ZVDS conditions [Reference Colantonio, Giannini, Giofrè, Yarleque Medina, Schreurs and Nauwelaers8]. Moreover, device physical constraints are violated, since negative values on the voltage waveform are observed. As pointed out in [Reference Colantonio, Giannini, Giofrè, Yarleque Medina, Schreurs and Nauwelaers8, Reference Cipriani, Colantonio, Giannini and Giofrè10], two solutions can be adopted in order to optimize the drain voltage waveform, while avoiding the occurrence of negative values. Obviously, it is possible to increase the drain bias voltage, but this would mean a nonnegligible increase in the DC dissipated power with a consequent degradation of output performance. In addition, an increased peak voltage value could exceed breakdown limitations of the transistor. A second strategy consists in the optimization of the Z 1 value, assuming that the current components previously determined are unchanged, in order to meet the device limits and without losing Class E behavior.
Then, a numerical algorithm has been developed, in order to overcome the limitations related to C ds and to extend the Class E approach above its maximum operating frequency, as described in the following section.
III. DEVELOPED ALGORITHM
Using the above-described frequency domain approach, voltage and current expressions are written as functions of circuit parameters, and in particular as functions of output capacitance C 1. Without loss of generalization, the following assumptions are possible:
1) the switch has zero on-resistance and infinite off-resistance,
2) a purely sinusoidal current still flows into the load (i.e. the band-pass filter in the output network is ideal); and
3) the harmonic loads are only due to the output capacitance C 1.
Defining harmonic load at every harmonic component as

the voltage waveform can be rewritten as the sum of contributions of current at each harmonic multiplied by the respective value of impedance, assuming θ = ωt:

Based on the above-listed assumptions, the impedance presented at each harmonic after the first one is only due to the capacitance C 1. Thus the above expression (9) is modified into the following:

When operating below f Max, at fundamental frequency it is possible to provide an expression for Z 1:

When operating at high frequencies, usually above a few gigahertz, the high-order harmonics – above third order – can be considered as effectively shorted because of the presence of C 1, and their effect neglected. This results in truncating at the third order the expression describing the voltage waveform.
Thus the drain voltage expression is rewritten, introducing a normalization parameter, k, defined as the ratio between actual operating frequency and maximum frequency (k = ω/ωMax) rated from a time domain analysis [Reference Mader, Bryerton, Markovic, Forman and Popovic4]. The parameter k is assumed to be greater than or equal to unit, to adequately describe the PA behavior at and above f Max:

Then, considering capacitance C 1 to be constant and the bias point to be given by V DD and I DC, the proposed solution implies finding the optimum value of Z 1 in order to simultaneously satisfy the following conditions:
1) to prevent negative voltage on the drain and
2) to maximize the amplitude of the fundamental component of drain voltage, and consequently the output performances.
As a first step, a discrete formulation for the function v DS(t) has been derived:

taking into account the relationship

so that the number of samples of v DS is equal to M in a period, regardless of actual frequency. Nonetheless, the dependence on operating frequency still appears in the higher harmonics impedance expression. In order to maintain a good approximation, the number of samples per period M was chosen relatively high and equal to 200.
Then, the unknown fundamental impedance Z 1 was written in a polar form and its value was swept around the ideal one. In particular, the magnitude was varied in a range 0.1–1.9 times the ideal value and the phase was varied between −90 and 90° in steps of 1°, so assuming whatever realizable value using passive components. Therefore,
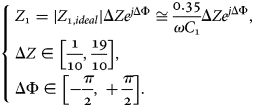
Function v DS(m) was numerically computed inferring at the end the couples of Δ Z and ΔΦ that avoid negative values in the voltage waveform and simultaneously maximize the amplitude of the fundamental component of the drain voltage, so determining the optimum load for Class E operation at selected normalized frequency. The process was iterated for k going from 1 to 5 in steps of 0.1, obtaining a plot of impedance variation versus normalized frequency.
Figure 4 reports the Δ Z and ΔΦ behaviors as a function of k. A quasi-monotonic decrease in the variation of the magnitude of fundamental impedance is observed, leading to a consequent decrease in the fundamental voltage amplitude as well as in maximum drain voltage. The phase behavior is monotonically decreasing, causing almost purely resistive impedance at the fundamental harmonic as the frequency increases.
Δ Z and ΔΦ behaviors as a function of k.

The resulting drain efficiency, reported in Fig. 5, is significantly different from unity, due to the nonideal operating conditions that a finite number of harmonics causes even for k = 1. The main reason for efficiency decrease is the lower value of fundamental voltage amplitude with respect to the ideal one.
Drain efficiency as a function of normalized frequency.

A peak value of the drain efficiency is observed at 1.6 times the maximum frequency, resulting in a combination of voltage and current that effectively minimizes the power dissipated in the transistor.
The above analysis suggests a useful and immediate approach in the design of a high-frequency Class E PA, improving the closed-form relationships of the classical methodology.
IV. PA DESIGN AND REALIZATION
Based on the results obtained previously, and in order to validate the developed algorithm, a Class E PA was designed at 2.14 GHz, using a medium-power LDMOS transistor. The device non-linear model was available from the foundry, allowing direct access to the intrinsic section.
The bias point was chosen in order to maintain the Class E operating point within the physical limits of the device. Maximum current and breakdown voltage are, respectively, 2.5 A and 70 V, estimated by DC simulation on the device model. The theoretical Class E boundary conditions impose

Thus a V DC of 20 V and a V GS of 3.3 V (I DC = 800 mA) were chosen. The device output capacitance C ds was estimated by S-parameter simulations in 4.2 pF. This implies a maximum frequency of about 520 MHz for pure Class E conditions.
The ideal Class E impedance is Z 1 = 25.1e j36°, calculated at the intrinsic section of the active device.
Since the nominal frequency chosen for the design was 4.1 times greater than the maximum one allowable for Class E ideal operation, as can be deduced from Fig. 4, a decrease of 30% in magnitude and an absolute phase of 17° are expected for high-frequency Class E impedance. Initial values of load impedance, determined in simulation with ideal harmonic tuners, effectively demonstrate the pertinence of the used approach. An optimum impedance of Z 1,opt = 17.5e j17° was obtained.
Simulated performance at the intrinsic drain section is reported in Fig. 6, showing a maximum efficiency of about 76%, slightly less than the value expected from Fig. 5. In fact, the knee voltage effect (i.e. on-resistance value) has been omitted in the algorithm for the sake of simplicity, but it has some influence on the overall performance when it is not negligible.
Simulated output performance at the intrinsic section.

Simulated drain voltage and current waveforms and intrinsic load line are reported in Fig. 7, demonstrating a good approximation of ideal Class E behavior even above f Max.
Simulated drain waveforms (a) and load line (b).

An essential schematic of the amplifier is reported in Fig. 8. The output matching network was designed to present the optimum load at the intrinsic section of the transistor. It was synthesized using a hybrid approach, with the use of surface mounting lumped elements. Additional work was performed on the input matching network to assure unconditional stability (by resistors R 1 and R 2 in Fig. 8) and the conjugate input matching of the PA. Then, both networks were implemented on a commercial substrate (ɛ r = 10, h = 640 µm). The realized PA is depicted in Fig. 9.
PA schematic.

Photograph of the realized PA.

V. EXPERIMENTAL RESULTS
Linear and nonlinear measurements were finally performed on the realized PA and compared with simulations with nonideal circuit elements at the nominal bias point (V DC = 20 V and I DC = 800 mA).
Measured small signal S-parameters are reported in Fig. 10, showing good agreement with the simulations.
S-parameters simulations and measurements.

Large signal measurements were performed at 2.14 GHz using continuous wave excitation. As a consequence, the amplifier should be considered to operate in Class E only when reaching a deep compression level, i.e. above 25 dBm of input power, with reference to Fig. 11.
Output performance of the designed PA at 2.14 GHz at nominal bias point.

From Fig. 11, an appreciably lower measured efficiency and PAE as compared to simulation (40% instead of 56%) is evident. In fact, the measured output power is about 1 dB lower than the simulated value (39.8 dBm against 40.7 dBm at 30 dBm input power), and above all the actual DC current absorption predicted by the nonlinear model of the active device was lower than that measured, causing a decrease in efficiency.
Try to increase efficiency, further measurements were performed with a slightly higher drain bias voltage and at a lower bias current, i.e. V DC = 26 V and I DC = 500 mA. Measurements against simulations are depicted in Fig. 12. In such conditions, the amplifier can reach 41 dBm of output power and a maximum efficiency of 49% at 2.14 GHz.
Output performance of the designed PA at 2.14 GHz at V DC = 26 V.

In Fig. 13, plots of drain efficiency and output power versus frequency are reported, measured in the frequency range of 2.1–2.2 GHz at a constant gain of about 11 dB, namely in the Class E operating region.
Output performance as a function of frequency.

VI. CONCLUSION
In this paper analysis on the high-frequency Class E design approach was presented. Starting from the classical approach, a numerical analysis, based on the optimization of the fundamental impedance, was performed to extend Class E feasibility at higher frequencies. The method developed was validated designing a PA based on an LDMOS device, at a frequency 4.1 times higher than the maximum allowable for a traditional Class E design. The PA was realized and characterized, showing an output power of 10 W with an associated efficiency of 49% over a 100-MHz bandwidth.
 Elisa Cipriani was born in Palestrina, Roma, Italy, on August 29, 1981. She received a degree in electronic engineering (M.S.), summa cum laude, from the University of Roma “Tor Vergata” in 2007. She is currently working toward a Ph.D. degree in space systems and technologies at the same university. Her main research activities concern power amplifiers theory and design, with a focus on high-efficiency switching mode power amplifiers and efficiency enhancement architectures.
 Paolo Colantonio was born in Roma, Italy, on March 22, 1969. He received a degree in electronic engineering from the University of Roma “Tor Vergata” in 1994 and a Ph.D. degree in microelectronics and telecommunications in 2000. In 1999 he became a Research Assistant at the same university, where from 2002 he has been a Professor of Microwave Electronics. His main research activities are in the field of nonlinear microwave circuit design methodologies, nonlinear analysis techniques, and modeling of microwave active devices.
 Franco Giannini was born in Galatina (LE), Italy, on November 9, 1944. He received a degree in Electronics engineering (summa cum laude) from the University of Roma “La Sapienza,” Rome, Italy, in 1968. From 1980, he has been a Full Professor of applied electronics with the University of Rome Tor Vergata, Rome, Italy. From 2001, he has been an Honorary Professor with the Warsaw University of Technology (WUT), Warsaw, Poland. He has been involved with problems concerning modeling, characterization, and design methodologies of linear and non-linear active microwave components, circuits, and subsystems, including monolithic microwave integrated circuits (MMICs). He is a consultant for various national and international industrial and governmental organizations, including the International Telecommunication Union and the European Union. He has authored or coauthored over 340 scientific papers. Prof. Giannini is the chairman of the Italian National Society of Electronics (GE). He is the member of the Board of Directors of the Italian Space Agency (ASI). He is a president of the GAAS Association. He has also been a member of numerous committees of international scientific conferences. He was the recipient of the Doctor Honoris Causa degree from the WUT in 2008.
 Rocco Giofrè was born in Vibo Valentia, Italy, on August 13, 1979 and he received a degree in electronic engineering (M. S. Eng.), summa cum laude, from University of Roma Tor Vergata in 2004. He is currently working toward a Ph.D. degree in space systems and technologies at the same university. His current research interests include RF power amplifier theory, design and test, linearization techniques, and efficiency improving techniques. He was the recipient of the 2005 Young Graduated Research Fellowship presented by the Gallium Arsenide Application Symposium Association (GAAS) and of the best paper award at the 2nd EuMIC Conference in 2007.



