INTRODUCTION
Mid-ocean ridges are undersea mountain ranges forming the largest continuous topographic feature on Earth; a global network almost 85,000 km long (Kennett, Reference Kennett1982). Ridges play an important role in the distribution of benthos in the open ocean. It is hypothesized that they are stepping stones and pathways for the dispersal of slope fauna into the open ocean, but that they can also act as barriers to the dispersal of abyssal seafloor fauna (Wilson & Kaufman, Reference Wilson, Kaufmann, Keating, Fryer, Batiza and Boehlert1987; Vinogradova, Reference Vinogradova1997; Dinter, Reference Dinter2001; Mironov, Reference Mironov, Mironov, Gebruk and Southward2006). Characterized by high relief, rough topography and remoteness from land, ridges are very difficult to access even with modern oceanographic technologies. Few previous investigations have been dedicated to the targeted study of benthic fauna of ridge systems, except those which have focused on hydrothermal vent habitats.
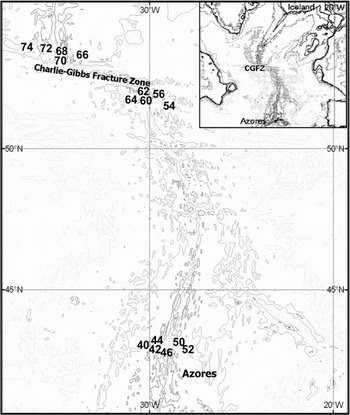
The Mid-Atlantic Ridge (MAR) is the spreading zone between the Eurasian and American plates. As a result of volcanic and tectonic processes, new seafloor is continually being formed as the two plates spread at a rate of 2–4 cm yr−1 (Fornari & Embley, Reference Fornari, Embley, Humphris, Zierenberg, Mullineaux and Thomson1995). Between Iceland and the Azores the ridge extends over 1500 nautical miles (nm), and is characterized by rough bottom topography comprising underwater peaks (minimum depth 700–1000 m), a central rift valley, recent volcanic terrain, fracture zones, and seamounts. The northern Reykjanes Ridge is wide (the inner rift is 15–17 km at 58°N) and relatively shallow (500–1000 m deep) and extends from Iceland to the Charlie-Gibbs Fracture Zone (CGFZ) at approximately 52°N where the ridge is offset 5° to the east (see Figure 1). The CGFZ at its deepest is ~4500 m (Felley et al., Reference Felley, Vecchione and Wilson2008) and is the deepest connection between the north-east and north-west North Atlantic. South of the CGFZ there are two more significant fracture zones—the Faraday and Maxwell at 50°N and 48°N, respectively.
Map of the study area indicating the position of each sampling station.

The MAR has an important influence on the deep-water circulation of the North Atlantic, it separates the eastern and western basins of the North Atlantic along the majority of its length, but there is flow of deep-water between the basins through the CGFZ (Lackschewitz et al., Reference Lackschewitz, Endler, Genrke, Wallrabe-Adams and Thiede1996). The dominating deep water mass at bathyal depths is the North Atlantic Deep Water (NADW) which is formed by mixing of the overflowing water masses from the Norwegian and Greenland Seas with Labrador Sea Water. The near surface circulation is complex, but it is dominated by the North Atlantic Current (NAC) which is one of the major currents originating from the North Atlantic Drift. The NAC crosses the MAR in two to four branches flowing in a north-easterly direction between 45°N and 52°N (Lackschewitz et al., Reference Lackschewitz, Endler, Genrke, Wallrabe-Adams and Thiede1996; Søiland et al., Reference Søiland, Budgell and Knutsen2008) carrying warmer, more saline water across the ridge to the European shelf and into the Norwegian Sea. Along the northern boundary of the NAC lies the Sub-Polar Front separating cooler and less saline sub-polar water to the north from warmer Atlantic water to the south (Kraus & Käse, Reference Kraus and Käse1984). The frontal zone moves temporally, but normally it is located just south of the CGFZ (Søiland et al., Reference Søiland, Budgell and Knutsen2008).
The central North Atlantic bathyal fauna of the MAR has been less studied than those of several open ocean seamounts which have been the focus of comprehensive research programmes (Hempel & Nellen, Reference Hempel and Nellen1972; Mironov, Reference Mironov1994; Rogers, Reference Rogers1994; Pfannkuche et al., Reference Pfannkuche, Müller, Nellen and Weper2000; Mironov & Krylova, Reference Mironov, Krylova, Mironov, Gebruk and Southward2006). Prior studies of benthic fauna on the MAR have been restricted to the Reykjanes Ridge (Kuznetsov, Reference Kuznetsov1985; Copley et al., Reference Copley, Tyler, Sheader, Murton and German1996; Tendal, Reference Tendal1998; for a review see Mironov & Gebruk, Reference Mironov, Gebruk, Mironov, Gebruk and Southward2006), and some of these studies on background benthic fauna were conducted in parallel to investigations on hydrothermal vent habitats on the MAR (Young, Reference Young1998). Historical, and somewhat scattered, data on bathyal fauna from the area north of the Azores have been published (Koehler, Reference Koehler1909), but knowledge is limited concerning the general ridge fauna from bathyal depths between the Azores and the CGFZ.
The bathyal fauna of the open central North Atlantic is of great interest to marine biogeographers due to the complex biogeographical history of the region. The North Atlantic was subjected to sharp climatic, geomorphological and hydrological changes in the Pliocene and Pleistocene (references in Mironov & Gebruk, Reference Mironov, Gebruk, Mironov, Gebruk and Southward2006). The region has been invaded by species from remote areas, such as the North Pacific, the Indo-Pacific and the Antarctic. In addition there is a strong relationship with the western Atlantic fauna, especially in the southern part of the central North Atlantic (Dilman, Reference Dilman, Mironov, Gebruk and Southward2006; Mironov & Gebruk, Reference Mironov, Gebruk, Mironov, Gebruk and Southward2006; Mironov & Krylova, Reference Mironov, Krylova, Mironov, Gebruk and Southward2006). The role of bathyal fauna originating from these different areas and their subsequent redistribution is different in the northern part of central North Atlantic (the Reykjanes Ridge) compared to the south (e.g. the Meteor Seamounts). The hypothesized pathway of dispersal along the Mid-Atlantic Ridge is that fauna invaded from the north and south, and met at moderate latitudes between the Azores and the CGFZ. Mironov & Gebruk (Reference Mironov, Gebruk, Mironov, Gebruk and Southward2006) highlighted an important zone of change in the bathyal benthic fauna between the Reykjanes Ridge and the Azores suggesting the presence of a biogeographical boundary which supports this theory. Changes in the Asteroidea from the Reykjanes Ridge to the Azores have also been shown recently by Dilman (Reference Dilman2008) by comparing samples from 42–53°N on the MAR and those from the Reykjanes Ridge (Dilman, Reference Dilman, Mironov, Gebruk and Southward2006). Interestingly data on the benthopelagic fish community also support this theory. Hareide & Garnes (Reference Hareide and Garnes2001) suggested the area between 48 and 52°N as a region of high species turnover and this was later narrowed to 50 to 52°N by King et al. (Reference King, Bagley and Priede2006).
The northern MAR (42–53°N) was the target area of the MAR–ECO project, one of the field projects of the Census of Marine Life programme (Bergstad & Godø, Reference Bergstad and Godø2003; Bergstad, Reference Bergstad, Menezes and Høines2008a; www.mar-eco.no). This pilot project aims to understand the biodiversity, distribution patterns, abundance and trophic relationships of pelagic, benthopelagic and epibenthic fauna inhabiting the mid-oceanic North Atlantic, from Iceland to the Azores. A major field effort of the project was the international expedition on the RV ‘G.O. Sars’ in June–July 2004. Principal results of this expedition were published in the thematic issue of Deep-Sea Research Part II (2008, Volume 55, numbers 1–2) ‘Mid-Atlantic Ridge habitats and biodiversity’. Mortensen et al. (Reference Mortensen, Buhl-Mortensen, Gebruk and Krylova2008) in that issue considered studies of corals in MAR–ECO. A separate thematic issue of Marine Biology Research (2008, Volume 4, numbers 1–2) ‘Benthic fauna of the Mid-Atlantic Ridge: results of the MAR–ECO expedition’ was dedicated to taxonomic studies of benthic organisms collected on the MAR–ECO cruise.
In the present paper we analyse composition, taxonomic structure and distribution patterns of bathyalFootnote 1 benthic fauna from the section of the Mid-Atlantic Ridge between the Azores and southern tip of the Reykjanes Ridge. The analysis is based on trawl samples obtained on the ‘G.O. Sars’ MAR–ECO cruise in 2004.
MATERIALS AND METHODS
The material used in the present study was obtained on the 2nd leg of the ‘G.O. Sars’ MAR–ECO cruise in July 2004. The following three areas were sampled: north of the Azores, between 42° and 43°N; south-east of the CGFZ at 51°N and north-west of the CGFZ at 53°N (Figure 1).
Most activities were concentrated at pre-determined locations (deemed ‘Super Stations’; 2.5 nm × 2.5 nm). These had been selected to produce a transect of stations traversing the ridge, with one central station at the ridge axis and two to three stations either side of the ridge at depths closest to 1000 m, 2000 m and 3000 m. To locate suitable sites, the best available charts were used in advance of the cruise, in addition to real time bathymetric maps produced by a Simrad EM 300 kHz multi-beam bottom profiler and associated charting software (Olex) whilst at sea (for details see De Lange Wenneck et al., Reference De Lange Wenneck, Falkenhaug and Bergstad2008). Sampling sites within these ‘Super Stations’ were termed ‘Local Stations’.
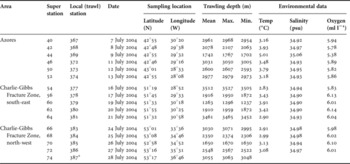
Samples of benthos from trawls taken at 16 Local Stations (Table 1) are included in this analysis. The trawls were taken at depths from 1237 to 3527 m. The trawl at Super Station 74 (north-west of CGFZ, mean depth 3055 m) provided a qualitative sample and therefore this station was excluded from the statistical analysis. Owing to limitations in sampling, specimens within all the trawl catches could not be counted and weighed; therefore the analysis is based on species presence–absence data.
Details of MAR–ECO trawl stations used in the analysis. Environmental data were taken near bottom with a CTD sensor (Søiland et al., Reference Søiland, Budgell and Knutsen2008).

Max., maximum; min., minimum;*, failed trawl.
The bottom trawl used was a Campelen 1800 shrimp trawl as described in De Lange Wenneck et al. (Reference De Lange Wenneck, Falkenhaug and Bergstad2008). The horizontal opening between the upper bridles at the wing tips is 17 m at 50 m door spread, and the distance between Danlenos at the tips of the ground gear was 12 m. The vertical opening was 4.5 m at 50 m door spread. The cod-end had a 22 mm mesh in addition to a liner with 5 mm mesh size. The groundgear (rockhopper type, with discs of 35 cm diameter) travelled 3.5 m behind the headrope in the centre of the trawl. There was also 10 m of chain as the first part of the lower bridles in front of the Danlenos. According to video recordings made by low light cameras on the headrope, the rockhoppers travelled within the soft substrate, more than halfway submerged, so that most of the epifauna resting on the bottom was caught. To monitor the trawl configuration and performance a full suite of newly developed wireless SCANMAR (Scanmar AS, Norway) deep-water sensors were applied. Tows were made at a speed of 1.5 knots with a bottom time of 50–60 minutes Catches were standardized according to the distance trawled, i.e. the observed distance at which the trawl had bottom contact.
The fauna was first sorted on the cruise by higher taxa. Samples were then preserved in 80% alcohol or 4% buffered formaldehyde depending on taxon. Selected specimens in the best condition were photographed prior to preservation. All benthic samples were deposited in the Museum of Zoology, University of Bergen (Norway) and have since been identified to species level by relevant taxonomic experts (listed in the Acknowledgements).
To determine patterns of bathyal benthic faunal distribution along the ridge in the MAR–ECO area, we evaluated between-station species similarity using the non-metric multidimensional scaling (nMDS) within the PAST (PAlaeontological STatistics version 1.18) statistical programme (Hammer et al., Reference Hammer, Harper and Ryan2003). Correlation matrices were generated using the Sorensen's index of similarity on presence–absence data.
The east–west division of fauna (across the ridge) was investigated by comparing percentages (from the total in each of the three areas) of species occurring east or west of the ridge, those restricted to the ridge axis and those common at both sides of the ridge. Species were considered as ‘axial’ if they were found only at axial stations (Station 46 and Station 70). Species found at the ridge axis and east or west of the ridge, were considered as ‘eastern’ or ‘western’ respectively. The taxonomic structure of fauna was compared by evaluating the percentage of higher taxa (usually order or class) in the three studied areas (the Azores and south-east and north-west of the CGFZ) and those found shallower or deeper than 2000 m.
RESULTS
Faunal composition
The 16 trawl stations used in the present study (Table 1) were distributed between the three sampled areas as follows: 6 trawls in the Azoren area and 5 each south-east and north-west of the CGFZ respectively. Five trawls were taken at depths between 1000 m and 2000 m, 6 trawls between 2000 m and 3000 m and 5 trawls >3000 m.
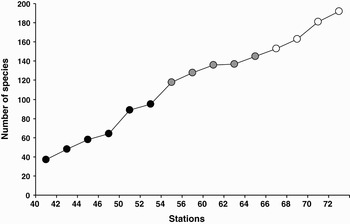
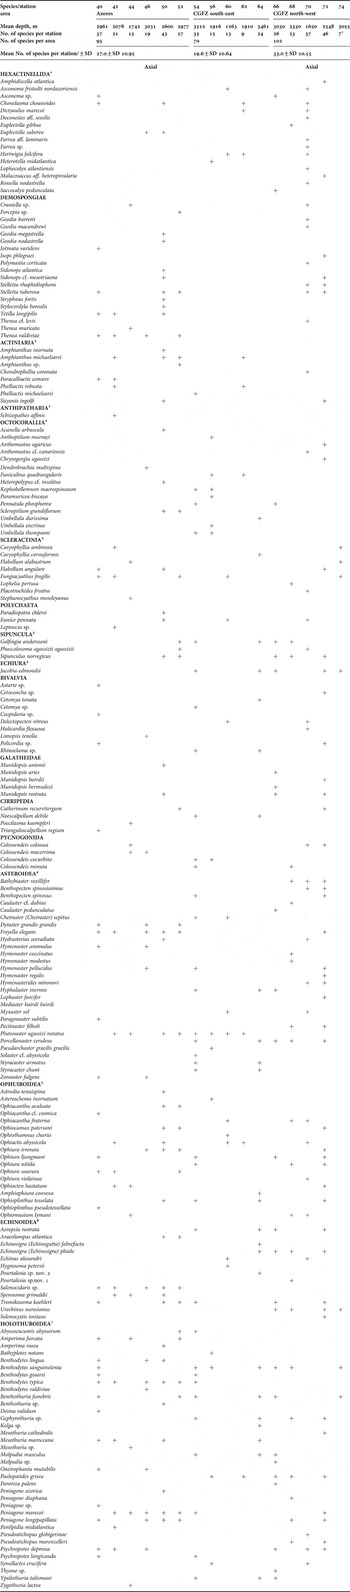
A total of 192 species of benthic organisms were identified from all 16 trawls, representing 16 higher taxa (family and higher) (see Table 2). Echinoderms (Holothuroidea, Asteroidea, Ophiuroidea and Echinoidea) were represented by 95 species forming 49.5% of the total species number, 18.2% (35 species) were sponges (Demospongiae and Hexactinellida), and 16.7% (32 species) were Anthozoa (Actinaria, Anthipatharia, Octocorallia and Scleractinia). These three taxonomic groups contributed to 84.4% of the total species number. ‘Minor’ groups (with ≤5 species) included Galatheidae, Echiura, Sipuncula, Pycnogonida, Cirripedia and Polychaeta. The number of species per station ranged from 9 (Station 62) to 46 (Station 72) (Table 2). A species-accumulation curve is shown in Figure 2. By the end of sampling this curve did not reach the saturation point indicating incomplete representation of regional fauna in our samples.
Species accumulation curve. Black symbols, the Azores; grey symbols, south-east of the Charlie-Gibbs Fracture Zone (CGFZ), white symbols, north-west of CGFZ.

Inventory of benthic invertebrates sampled by the MAR–ECO expedition. For published details on taxonomy and distribution of MAR–ECO benthos see: 1Tabachnik & Collins (2008); 2Molodtsova et al. (Reference Molodtsova, Sanamyan and Keller2008); 3Murina (Reference Murina2008); 4Dilman (Reference Dilman2008); 5Martynov & Litvinova (Reference Martynov and Litvinova2008); 6Mironov (Reference Mironov2008); 7Gebruk (Reference Gebruk2008). *Station 74 was excluded from most of the analyses as the trawl failed.

The highest number of species per area was found north-west of the CGFZ with 102 species (mean of 33 per trawl). In the Azores area 95 species were recorded (mean of 27 per trawl), and the lowest number of species were sampled south-east of the CGFZ with a total of 70 species (mean of 20 per trawl).
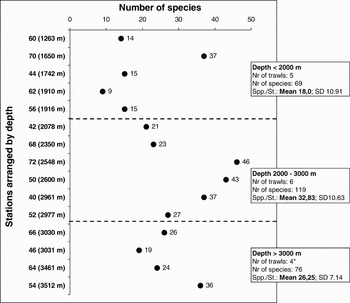
The total number of species and the mean species number per station were highest between 2000 and 3000 m water depth. A total of 119 species with a mean of 33 species per trawl were sampled from 2000–3000 m. At depths <2000 m the total number of species sampled was 69, with a mean 18.0 per trawl, and at depths >3000 m a total of 76 species were sampled, with a mean 26.25 per trawl. The pattern of change of species number along depth is shown in Figure 3.
Change in the number of benthic species with depth in MAR–ECO samples. *Station 74 (3055 m) excluded from analysis.

Comparison of faunal composition and structure along the ridge
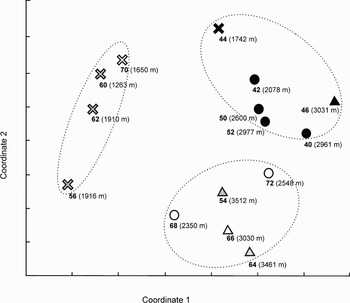
Analysis of similarities between stations using the nMDS revealed three clusters of stations (Figure 4). One cluster was formed by stations from the Azorean area. The two other clusters, stations from the CGFZ (both south-east and north-west stations) grouped according to depth: stations shallower than 2000 m and those deeper than 2000 m.
Between station similarity based on non-metric multi-dimensional scaling (nMDS). Correlation matrices were generated using the Sorensen's index o presence–absence data. Symbols correspond to depth strata: crosses, stations <2000 m; circles, stations between 2000 and 3000 m; triangles, stations >3000 m. Colour of symbols corresponds to the sampling region: black symbols, the Azores; grey symbols, south-east of the Charlie-Gibbs Fracture Zone (CGFZ), white symbols, north-west of CGFZ.

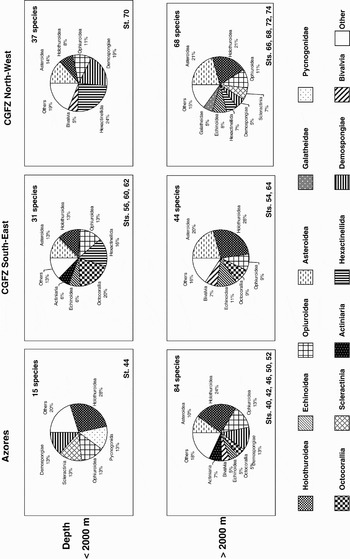
Considering the depth related clustering of stations around the CGFZ we examined the taxonomic structure of the fauna as a percentage of higher taxonomic classifications in all the three areas for those stations shallower and deeper than 2000 m. The species contributing most to each cluster were different, shallower and deeper than 2000 m (Figure 5). North-west of the CGFZ the three leading taxonomic groups that dominated at depths shallower than 2000 m were sponges Hexactinellida (24% of species), Demospongiae (19%) and Asteroidea (14%). At depths exceeding 2000 m the dominant fauna were the Holothuroidea (21%), Asteroidea (21%) and Ophiuroidea (11%). South-east of the CGFZ at depths less than 2000 m the five dominant faunal groups were the Octocorallia (20%), Hexactinnelida (16%) and three echinoderm taxa; Asteroidea, Holothuroidea and Ophiuroidea, each contributing equally (13%). In contrast deeper than 2000 m the fauna contributing most significantly were the Holothuroidea (28%), Asteroidea (20%) and Echinoidea (11%). In the Azorean region the dominant fauna contributing to the cluster both deeper and shallower than 2000 m were the Holothuroidea (24% and 28%), Ophiuroidea (14% and 13%) and Demospongiae (14% and 13%) (Scleractinia and Pycnogonida also contributed 13% to the faunal composition shallower than 2000 m). Thus, there are some differences in the composition and the taxonomic structure of bathyal benthic fauna between the Azores area and the two areas around the CGFZ.
Taxonomic structure shown as percentage of taxa in the three sampling areas. Stations are separated by depth; those shallower than 2000 m and those deeper than 2000 m.

East–west division of fauna
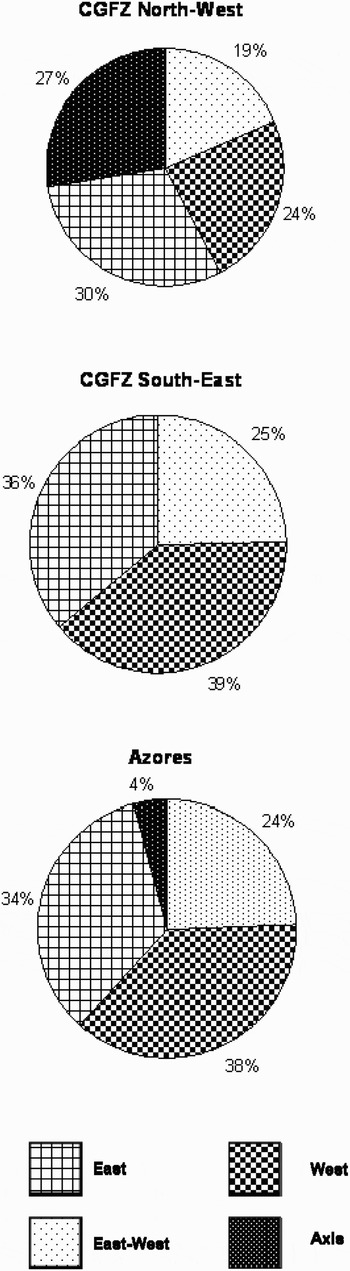
We also examined whether there were any trends in changes of bathyal fauna across the ridge (in the east–west direction). The percentage of species occurring east or west of the ridge axis was compared in all the three areas (Figure 6). In the Azores area and south-east of CGFZ we found relatively high and similar percentage of species restricted to either the eastern or western side of the ridge: 38–39% of western species and 34–36% of eastern species respectively. Species found on both sides of the ridge in these two areas constituted 24% in the Azorean region and 25% south-east of the CGFZ. These results indicate that the bathyal invertebrate fauna do have some differences in their faunal composition east and west of the ridge.
Percentage of species with different patterns of distribution across the ridge (east–west division). Species indicated as axial were not found east or west of the ridge. Species found at the ridge axis and east or west of the ridge were considered as ‘eastern’ or ‘western’ correspondingly. Species observed both east and west of the axial valley are termed east–west.

The pattern was different on the transect north-west of the CGFZ where 30% of species were found east of the ridge, 24% in the west, 19% on both sides and 27% on the ridge axis. A very high percentage of species found at the ridge axis in this area is probably due to sampling bias: only one trawl conducted west of the ridge on the north-west transect was successful, the second western trawl (Station 74) suffered from technical problems and the number of species in that catch was very low (7 spp.). Therefore, the true pattern of faunal change across the ridge in this area remains unknown due to undersampling on the western side of the ridge.
DISCUSSION
The MAR–ECO expedition obtained the first data on the bathyal invertebrate fauna of the Mid-Atlantic Ridge between the Azores and the Charlie-Gibbs Fracture Zone. In total 192 species of benthic fauna were identified. This number is relatively high for a limited number of trawls (16) which were not geared toward sampling invertebrates. Mironov & Gebruk (Reference Mironov, Gebruk, Mironov, Gebruk and Southward2006) report a total of 201 species from the Reykjanes Ridge from 1000 to 3000 m based on a series of Russian expeditions, though it does not include the most recent studies in this area by other programmes such as BIOICE (Tendal, Reference Tendal1998). These studies therefore appear to confirm that the MAR–ECO samples have undersampled the invertebrate benthic fauna species present on the MAR, and this is further confirmed by the species accumulation curve (Figure 2).
The bathyal fauna was dominated by echinoderms (49.5% of the total species number), sponges and anthozoans over all three transects. These three taxonomic groups jointly gave 84.4% of the total species number sampled. The data are in agreement with Copley et al. (Reference Copley, Tyler, Sheader, Murton and German1996) who showed that the same three taxanomic groups dominated the bathyal fauna of the northern Reykjanes Ridge: 81.2% of 101 species (identified from 102 dredge samples between 225 and 2600 m depth) were represented by sponges (38.6%), anthozoans (21.8%) and echinoderms (20.8%). However, Mironov & Gebruk (Reference Mironov, Gebruk, Mironov, Gebruk and Southward2006) present a conflicting image of the distribution of invertebrate species of the MAR. Of 201 species sampled on the Reykjanes Ridge between 1000 m and 3000 m depth by Sigsbee trawl (22 samples) and Okean grab (66 samples) the most dominant faunal group were polychaetes with 84 species (41.2% of the total number of species), followed by anthozoans (19.4%) and echinoderms (17.9%). The discrepancy in the dominance of fauna presented is most likely due to a difference in a sampling gear: the Mironov & Gebruk (Reference Mironov, Gebruk, Mironov, Gebruk and Southward2006) data were collected using a method which sampled more infauna.
Despite the opportunistic collection of these samples some taxa from this study were new to science and they have since been described. These include the genus Solenocystis from the echinoid family Pourtalesiidae (Mironov, Reference Mironov2008) and a further 15 new species, including five species of glass sponges (Tabachnik & Collins, Reference Tabachnik and Collins2008), four species of elasipodid holothurians (Gebruk, Reference Gebruk2008), three species of ophiuroids (Martynov & Litvinova, Reference Martynov and Litvinova2008), and one species of Asteroidea (Dilman, Reference Dilman2008), Echinoidea (Mironov, Reference Mironov2008) and Echiura (Murina, Reference Murina2008). The new species comprise ~8% of the total species, however, this number may increase since not all specimens in the collection have been identified to species level (Table 2).
When comparing each sampling area by species richness, the northernmost sampling region (the southern tip of the Reykjanes Ridge) had the highest species richness. The 102 species recorded in this area is relatively high for only four successful trawls compared with the 201 species reported by Mironov & Gebruk (Reference Mironov, Gebruk, Mironov, Gebruk and Southward2006) for the Reykjanes Ridge (see details above). The diversity of bathyal invertebrate fauna is known to be significantly higher on seamounts south of the Azores, e.g. Mironov & Krylova (Reference Mironov, Krylova, Mironov, Gebruk and Southward2006) report ~400 species from the Meteor Seamount area. More comparable, quantitative samples taken along the ridge (at similar depths and with similar gear) are needed for a thorough understanding of how biodiversity changes along and across the MAR.
The peak of species number in our samples and the highest mean number of species per station occurred between 2000 and 3000 m. The mean species number was lower >3000 m compared with the 2000–3000 m depth-range, and much lower at depths <2000 m. Such a trend has been illustrated for the North Atlantic before. In the north-west Atlantic Rex (Reference Rex and Rowe1983) reported a peak (of expected number of species) at depths 2500–3000 m. A similar trend was shown by Gage et al. (Reference Gage, Lamont, Kroeger, Paterson and Gonzalez2000) for the Rockall Trough in the north-east Atlantic. At the same time in the Goban Spur area in the north-east Atlantic species diversity (the number of species per number of individuals) was shown to increase with increasing water depth from 200 m to 4115 m (Flach & De Bruin, Reference Flach and De Bruin1999).
The nMDS analysis of between-station species similarity revealed differences between stations in the CGFZ area (51°N–53°N) and the Azores (42°N). The stations from the Azores formed a separate cluster to those samples from the CGFZ, which separated out by depth. The taxonomic structure of the benthic fauna supports the nMDS results with differences in the faunal composition between the Azores and the CGFZ areas. In the two transects in the CGFZ region the dominant taxonomic groups with the highest percentage of species were different, shallower and deeper than 2000 m. In contrast in the Azores area the same groups dominated both shallower and deeper than 2000 m. However, in the Azores area only one trawl was conducted shallower than 2000 m (Station 44) and the number of species at this station was low (15). North-west of the CGFZ had only one station shallower than 2000 m (Station 70), but yielded a high number of species (37). The low number of species shallower than 2000 m in the Azores area may be an artefact of insufficient sampling and therefore more samples are required to conduct rigorous analysis and draw firm conclusions as to the faunal trends present.
Overall the results of the present study point at some turnover in bathyal benthic fauna between the CGFZ and the Azores and are in agreement with the suggestion that a biogeographical boundary exists in this area. Mironov & Gebruk (Reference Mironov, Gebruk, Mironov, Gebruk and Southward2006) speculated that a biogeographical boundary at bathyal south of the Reykjanes Ridge may correspond approximately to the position of the Sub-Polar Front. The front lies south of the CGFZ at about 51°–52°N along the northern boundary of the warm North Atlantic Current, representing a major hydrographical boundary separating cold sub-polar water from warmer Atlantic water (Søiland et al., Reference Søiland, Budgell and Knutsen2008). The front is a surface feature and may only directly influence near-bottom waters in the shallower areas of the MAR, however, food supply to the seafloor is likely to reflect productivity in epi- and mesopelagic layers. Observations from leg 1 of the MAR–ECO expedition show that surface chlorophyll concentration (Gaard et al., Reference Gaard, Gislason, Falkenhaug, Søiland, Musaeva, Vereshchaka and Vinogradov2008), zooplankton abundance (Opdal et al., Reference Opdal, Godø, Bergstad and Fiksen2008), and meso- and bathypelagic nekton density (Sutton et al., Reference Sutton, Porteiro, Heino, Byrkjedal, Langhelle, Anderson, Horne, Søiland, Falkenhaug, Godø and Bergstad2008) were considerably higher in the cool waters north of and in the frontal zone compared with the warmer waters to the south. The food supply to the seafloor is therefore likely to differ between these two areas and can be an important factor controlling the composition and structure of benthic fauna. As highlighted by King et al. (Reference King, Bagley and Priede2006) and Bergstad et al. (Reference Bergstad, Falkenhaug, Astthorsson, Byrkjedal, Gebruk, Piatkowski, Priede, Santos, Vecchione, Lorance and Gordon2008b) productivity and abundance patterns in the overlaying water masses are one of the most important factors structuring composition of demersal fish fauna on MAR.
In the pelagic realm, the Sub-Polar Front forms a boundary between two provinces: the Arctic and the North Atlantic Drift province (Sathyendranath et al., Reference Sathyendranath, Longhurst, Caverhill and Platt1995). According to Briggs (Reference Briggs1995) at approximately 50°N there is a boundary between the Warm-Temperate and South Boreal plankton groups in the Atlantic (see also Dinter, Reference Dinter2001). However, further data are required to validate and investigate such a biogeographical boundary.
The two transects of stations north and south of the CGFZ were designed to examine the potential barrier effect of the fracture zone on the distribution of fauna. Results of our between-station similarity analysis did not reveal such an effect on the bathyal fauna: stations north and south from the fracture show little separation and tend to cluster according to depth (Figure 4). Notably, in all the three areas at stations deeper than 2000 m the taxonomic structure was more uniform compared to shallower stations: four classes of echinoderms (Asteroidea, Holothuroidea, Echinoidea and Ophiuroidea) dominated the species composition over all transects.
Near-bottom temperature and salinity showed very limited variation among our sampling locations, therefore, it appears unlikely that these physical factors are directly affecting the species composition. At all sites, the O2 concentration was above levels likely to influence species presence. The highest temperature and lowest O2 concentration was observed at the shallowest southern location (mean depth 1742 m) placed at a depth corresponding to the bottom of a pelagic oxygen minimum zone.
Our data on changes in bathyal fauna across the ridge showed that the fauna had some differences east and west from the ridge in two of the transects: the Azores and south-east of the CGFZ. The percentage of species occurring only east or only west of the ridge in these two areas was relatively high (72 and 75% respectively) and also it was very similar, indicating that the ridge may structure local faunas in the east–west direction. However, the number of trawls analysed in each area was too small to make firm conclusions. At the southern tip of the Reykjanes Ridge (north-west of the CGFZ) the pattern of change across the ridge was unclear with 27% of species found only at the ridge axis. Since only one station was taken west of the ridge, this result is most likely a sampling bias.
There were no east–west differences found for the Chaetognatha based on the MAR–ECO data (Pierrot-Bults, Reference Pierrot-Bults2008). The demersal fish trawling data from MAR–ECO revealed some east–west differences in species composition and occurrence indicating that the ridge may act as a barrier to the east–west distribution of some species (Bergstad et al., Reference Bergstad, Falkenhaug, Astthorsson, Byrkjedal, Gebruk, Piatkowski, Priede, Santos, Vecchione, Lorance and Gordon2008b) although, as noted by the authors, they were concerned by the lack of replication.
In conclusion, results of the present work indicate presence of a biogeographical boundary in benthic fauna between the Azores and southern end of the Reykjanes Ridge, which may be the result of a change in the overlying regime of surface productivity and its export. That hypothesis could be tested by a future synthesis of MAR–ECO and ECOMAR data. The ECOMAR project (Ecosystems of the Mid-Atlantic Ridge at the Charlie-Gibbs Fracture Zone and Sub-Polar Front; www.oceanlab.abdn.ac.uk/ecomar) is a multidisciplinary consortium of UK scientists focusing on the region from 48 to 54°N on the MAR. ECOMAR, over five years from 2007 to 2011, will conduct targeted sampling of the benthic fauna (vertebrates and invertebrates) at four fixed locations on either side of the ridge at 48°N and 54°N. This project will provide additional data to determine the processes driving the biogeography of the communities found on the MAR. A further facet would be to compare this data with that from bathyal depths on the North Atlantic continental slopes. A synthesis study will help to gain a fuller understanding of the biogeographical patterns of bathyal benthic megafauna in the central North Atlantic.
ACKNOWLEDGEMENTS
We thank the officers and the crew of the RV ‘G.O. Sars’ for their help at sea. We are also grateful to the taxonomic experts who provided species identifications: A.B. Dilman (Asteroidea), N.B. Keller (Scleractinia), E.M. Krylova (Bivalvia), A.V. Martynov and N.M. Litvinova (Ophiuroidea), E. Macpherson and M. Segonzac (Galatheidae), A.N. Mironov and K. Minin (Echinoidea), T.N. Molodtsova (Octocorallia), V.V. Murina (Echiura and Sipuncula), O. Poltarukha (Cirripedia), N. Sanamyan (Actiniaria), K.R. Tabachnik and A.G. Collins (Porifera), E.P. Turpaeva (Pycnogonida). The authors also thank Alexandr Mironov and Vadim Mokievsky for their helpful comments on the manuscript. This work was an element of MAR–ECO, a field project under the Census of Marine Life programme.