Introduction
Beneath Antarctic ice shelves lie one of the last unexplored habitats on Earth, and the best accessible proxy for potentially life-supporting habitats on other planetary bodies (Lorenz et al. Reference Lorenz, Gleeson, Prieto-Ballesteros, Gomez, Hand and Bulat2011). In the Antarctic, ice shelves are generally hundreds of metres thick and have persisted for hundreds to tens of thousands of years. With ongoing climate change it may be that a shift in ice shelf stability is being observed (Pudsey & Evans Reference Pudsey and Evans2001, Scambos et al. Reference Scambos, Hulbe and Fahnestock2003 and references therein, Ingels et al. Reference Ingels, Aronson and Smith2018 and references therein); recent catastrophic collapses of Antarctic ice shelves include Larsen Inlet (1992), Prince Gustav Channel (1995), Larsen A (1995), Muller (1999), Larson B (2002), Jones (2003), Wilkins (2008), Wordie (2009), and now the potentially collapsing Thwaites (2014) (Joughin et al. Reference Joughin, Smith and Medley2014). These are examples of severe habitat change (Evans & Pudsey Reference Evans and Pudsey2002, Mueller et al. Reference Mueller, Padman, Domack, Huber, Willmott, Leventer and Brachfeld2006) and highlight a vanishing opportunity to define these communities before the sub-ice shelf habitat, and the animals it supports, disappear.
Ice shelves isolate the seafloor beneath them from sunlight and photosynthetic primary productivity, alter water motion from waves and currents, and prevent gas exchange between surface ocean waters and the atmosphere. Light sufficient for photosynthetic activity does not penetrate hundreds of metres of ice (Azam et al. Reference Azam, Beers, Campbell, Carlucci, Holm-Hansen, Reid and Karl1979, Perovich Reference Perovich1990). In the dark under ice shelves, food must be advected in from sunlit regions, or primary productivity must use an energy source other than sunlight.
With too little direct radiation for photosynthesis, advected primary productivity may be the primary food source. Current velocities under ice shelves are not well defined in detail, but are slow on average. Under the McMurdo Ice Shelf (MIS), observed currents average 0.09 m s−1 to the south-east on the east side (Robinson et al. Reference Robinson, Williams, Barrett and Pyne2010), though on the west side, current flow is apparently northward from under the ice shelf (Dunbar et al. Reference Dunbar, Leventer and Stockton1989, Hughes Reference Hughes2013). Though maximum speeds can be several times the average, for transport to locations far under the ice shelves, the average velocity is more relevant. A rough calculation shows that it would take approximately ten days for currents to transport 80 km under the MIS, and Dunbar et al. (Reference Dunbar, Anderson, Domack and Jacobs1985) estimate particulate transport distances of tens of kilometres under the adjacent Ross Ice Shelf (RIS), and a water residence time of months to six years.
The Ross and McMurdo Ice Shelves have been focused areas of research because of the global importance of the adjacent West Antarctic Ice Sheet (WAIS), and the proximity to McMurdo Station. The RIS is the largest ice shelf in Antarctica and a major buttress for WAIS, and as such, the collapse of the RIS could trigger global rise in sea level of a few metres (van Haastrecht Reference Van Haastrecht2017). McMurdo Ice Shelf is a small outcrop off the larger RIS that has distinctive characteristics such as ice accretion from below and ablation above (Debenham Reference Debenham1965), the reverse of the accumulation above and melt below that characterize the RIS.
Recent technological advances have allowed exploration of these isolated habitats. Previous glimpses via drop cameras and instrumentation deployed through holes in ice shelves provided tantalizing suggestions that at least a few individuals of a few species are present even in very remote regions. In 1977, the Ross Ice Shelf Project observed crustaceans and fishes 430 km back from the ice edge (Bruchhausen et al. Reference Bruchhausen, Raymond, Jacobs, DeVries, Thorndike and DeWitt1979). In 2003, 100 km from the edge of the Amery Ice Shelf, Riddle et al. (Reference Riddle, Craven, Goldsworthy and Carsey2007) observed a diverse benthic community. Other, natural opportunities for observations included a series of cracks in the RIS near White Island. Tens of kilometres from the ice edge, the benthic community found was diverse, though possibly influenced by local photosynthetic productivity from light through the cracks (Littlepage & Pearse Reference Littlepage and Pearse1962. Dayton & Oliver Reference Dayton and Oliver1977). In 1995, the collapse of the Larsen A Ice Shelf exposed unusual benthic communities that were 100 km back from the edge (Domack et al. Reference Domack, Ishman, Leventer, Sylva, Willmott and Huber2005). Recently, remotely operated vehicles (ROVs) and autonomous underwater vehicles (AUVs) have begun penetrating through thick ice, and far beneath ice shelves, making direct observations more possible.
This paper offers the first descriptions of macrofaunal benthic communities found beneath the McMurdo Ice Shelf. It includes a detailed assessment of spatial variability and explores whether these communities are persistent in situ or are constantly resupplied by external sources.
Materials and methods
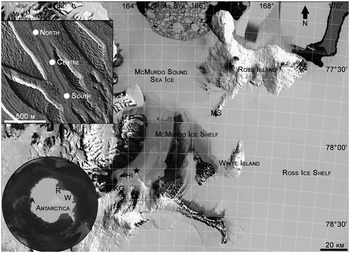
Opportunities to collect biological and ecological data under ice shelves are rare and often opportunistic. Advantage of such an opportunity was taken during a project with other primary goals, the SCINI (Submersible Capable of under Ice Navigation and Imaging) engineering development project (Cazenave et al. Reference Cazenave, Zook, Carroll, Flagg and Kim2011). The western McMurdo Ice Shelf is sourced from the Koettlitz Glacier, and is influenced by freezing of the seasonal freshwater melt onto the bottom of the ice (Debenham Reference Debenham1965). North-east of Heald Island there are several channels in the ice called barrancas (Priestley & Scott Reference Priestley1915) where during summer the ice in the bottom of the valleys is only metres thick, and it is possible to drill through with minimal surface logistics, to access the marine environment under the ice shelf (Fig. 1).
Map showing the study area, shown as a black star, in relation to major features mentioned in the text. Degrees latitude south and longitude east. Map data and imagery from Google, SIO, NOAA, US Navy, NGA, GEBCO, Landsat/Copernicus, US Geological Survey, PGC/NASA, DigitalGlobe. MS = McMurdo Station; HI = Heald Island; KG = Koettlitz Glacier. Upper left inset of the study area shows the topographic detail of the barranca, and the locations of the three sampling sites as white dots. Lower left inset of the Antarctic continent shows the locations of other studies under ice shelves referred to in the text, and the West Antarctic Ice Sheet. L = Larsen A Ice Shelf; A = Amery Ice Shelf; R = Ross Ice Shelf Project site; W = West Antarctic Ice Sheet.

The micro-ROV SCINI was deployed at three sites (north, centre, and south, with 500 m between sites) from a base camp at 78°13.2'S, 164°14.1'E, between 25 Nov and 6 Dec 2008 (Fig. 1). The walls of the barranca were approximately 25 m high, and the bottom approximately 200 m wide. In the thinnest central portion of the barranca, the ice was 1.1 m thick, and underwater, it sloped steeply away to an ice thickness of 20 m, forming an inverted canyon, which was filled with fresh water overlying denser seawater. The fresh water was over-pressured and initially gushed out of the hole at a rate of 0.32 l s−1, until eventually it stood level with the ice surface. The under-ice surface was solid and smooth, with no indications of freezing occurring during the summer dates when the work in the present paper was done. The depth to the seafloor under the ice was 188 m.
Transect and quadrat imagery were collected with SCINI. Images incorporated parallel lasers that allowed scaling of image area, and animal densities are reported as number m−2 for benthic imagery and number m−1 for midwater imagery. Quadrat size was optimally 0.4 m2, and operationally ranged between 0.3 and 1.6 m2. Quadrat image quality was 2.5 megapixels, and replication varied between 11 and 20 (Table I). Transects were 0.3 megapixel images recorded 5x s−1; this allowed stopping the frames for species identification without loss of image quality. Transect length was determined from the ROV navigation system when possible. An average transect speed was derived and used with the elapsed time to estimate distance travelled when the ROV navigation system was not working. Transects were recorded from the seafloor (n ranged from 5–17, and area from 3.30–33.52 m2) and the water column at 10 m, 30 m, 50 m, 100 m, 153 m, 173 m and 183 m depth (± 5 m, distances from 9.0–88.2 m). In order to increase replication enough for statistical analysis, midwater transects were collated into 10–50 m, 100–153 m, and 173–183 m depth bins. All data are available at BCO-DMO (https://www.bco-dmo.org/project/743648).
Number of replicates of each sampling type at each depth and site. Dotted lines separate samples that were grouped in depth bins for analysis.

The SIMPER routine (PRIMER Version 6) was used to determine which fauna were distinctive to each site. ANOSIM was used to test for differences between sites (for quadrats, and transects separately), and between sites and depths for midwater transects.
Ancillary environmental data were collected at the central site. An S4 current meter was deployed from 25 November–8 December 2008, at 90 m depth. Conductivity-temperature-depth (CTD) casts from the surface to the seafloor were done on 25 November 2008 and 1 December 2008.
Results
Fauna
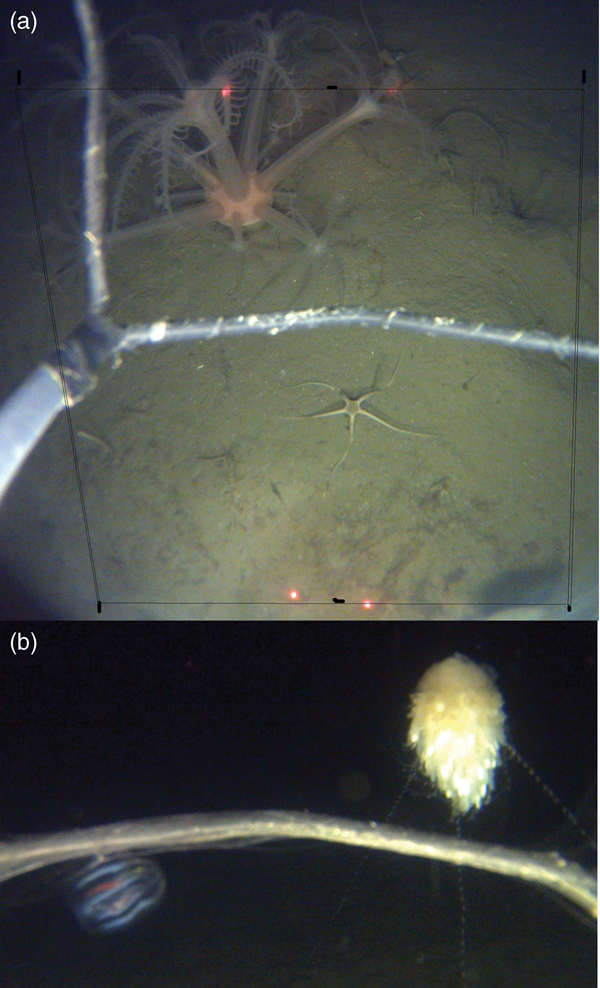
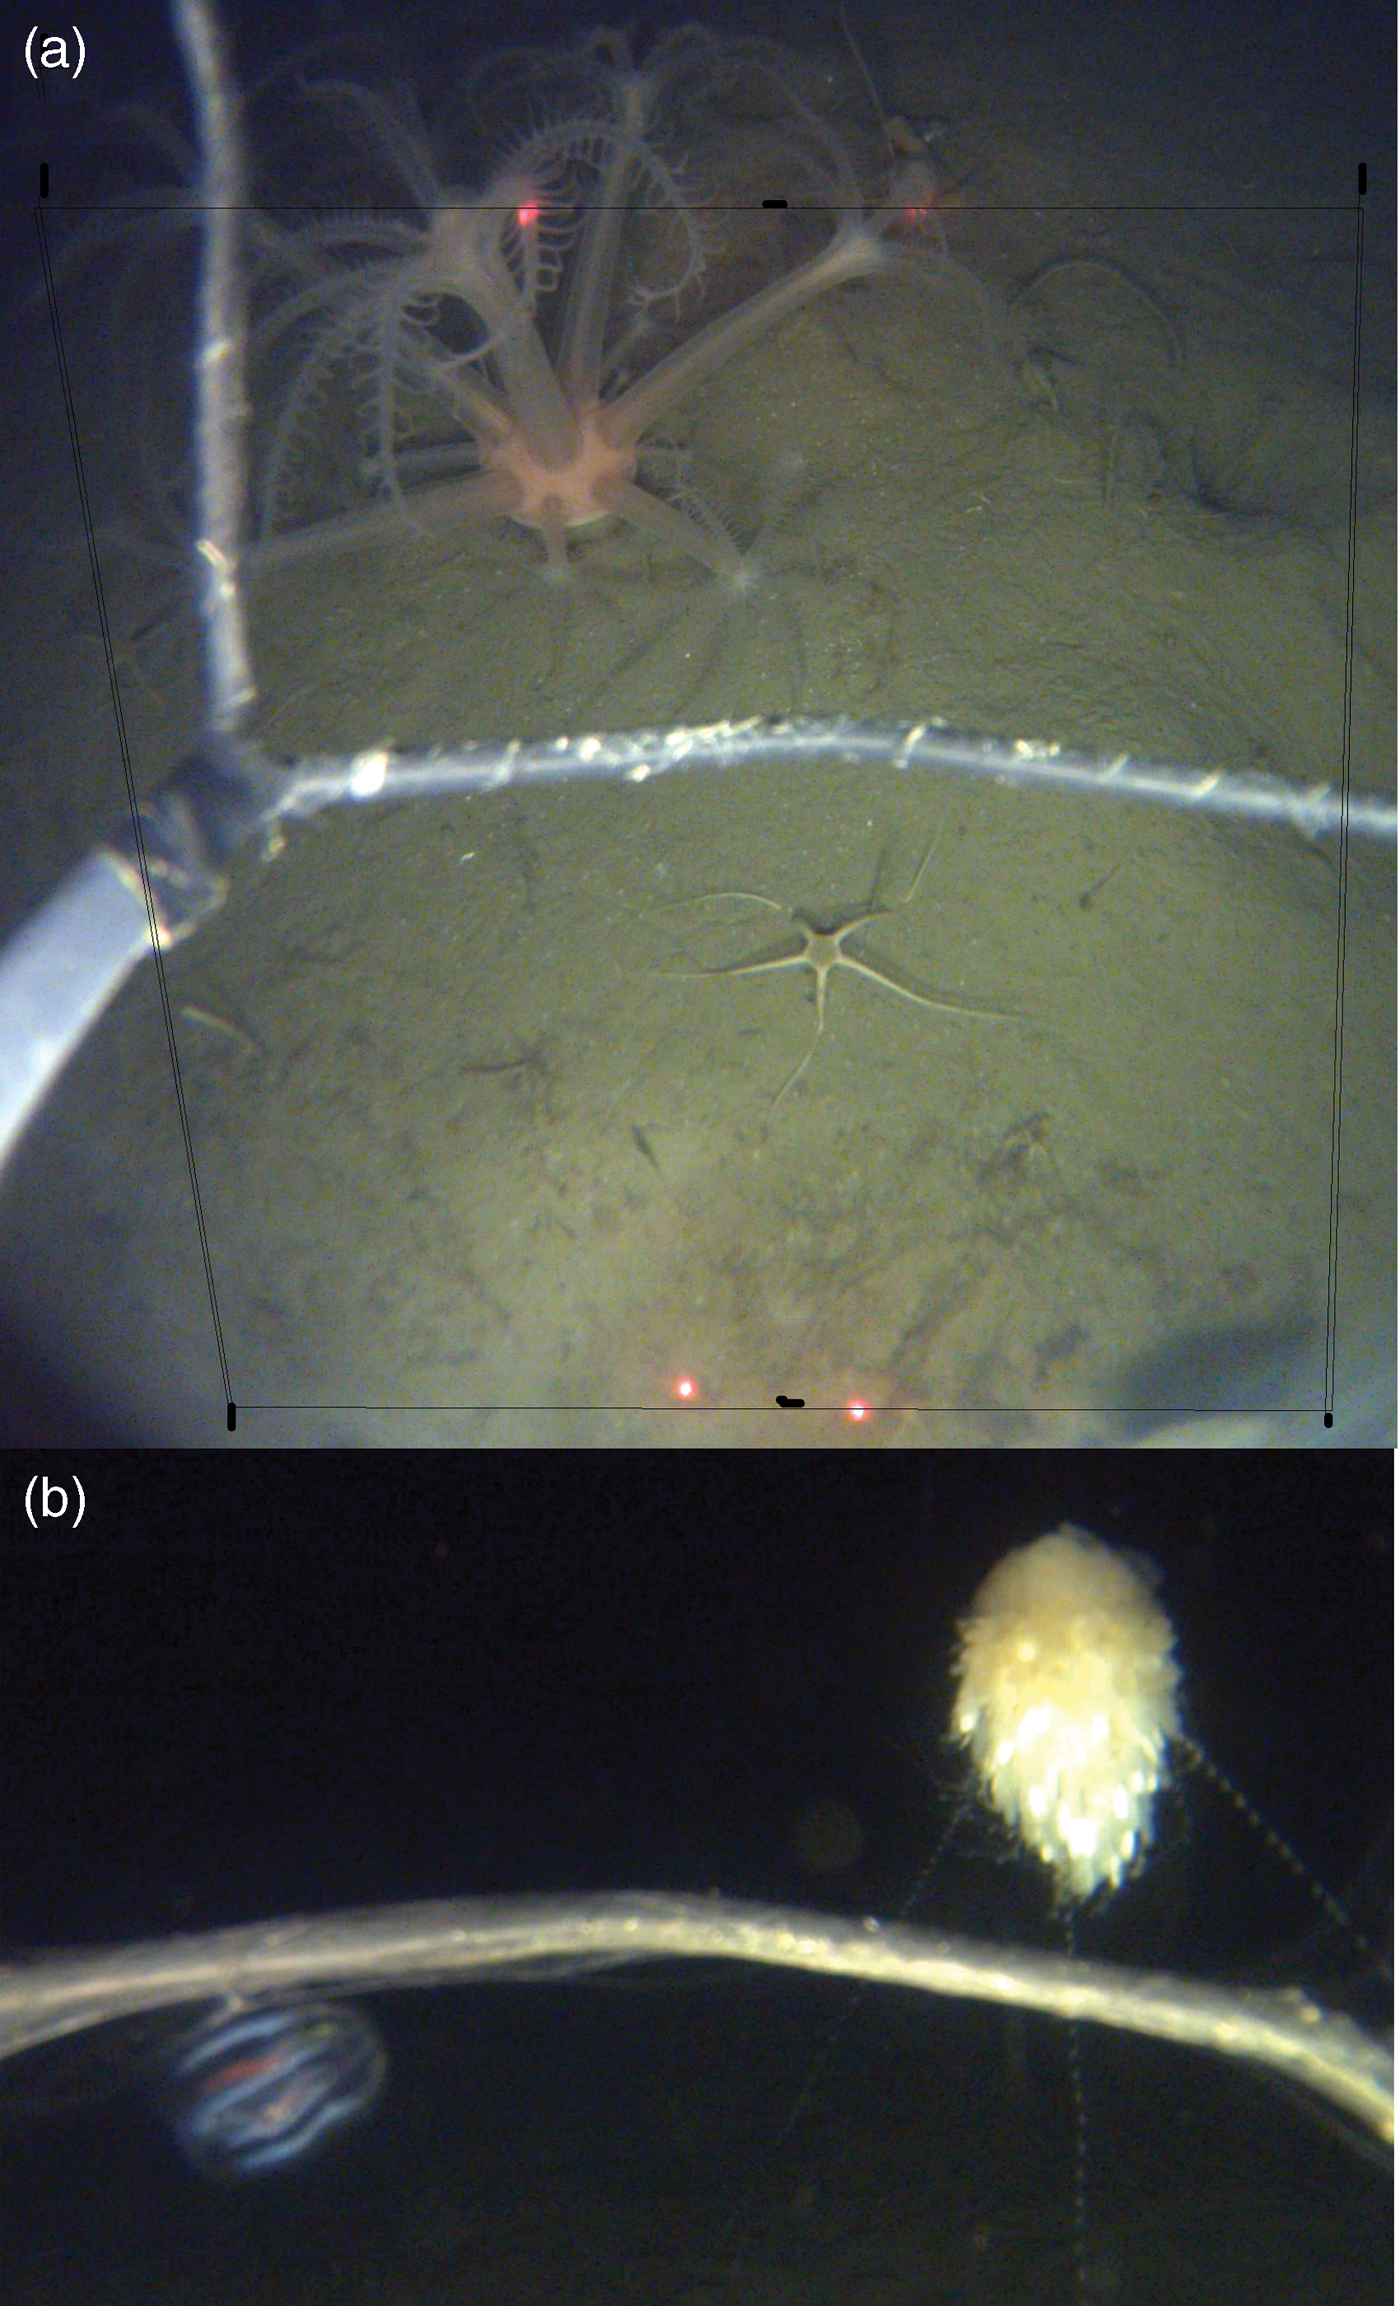
The seafloor habitat under the barranca area of the McMurdo Ice Shelf was fine sediment, with occasional dropstones. The fauna was dominated by polychaete tubes and brittle stars (Fig. 2) in both transects and quadrats as determined from SIMPER analysis, and average within-site similarities were 44–64%. Abundances were relatively high at the north site and low at the south site. In transects, alcyonacean soft corals were among the most common taxa at all sites. Cerianthid anemones were also abundant in transects at both the centre and south sites, along with hydrozoans at the centre site, and polychaetes at the north site (Tables II & S1).
Examples of the images taken by the ROV SCINI. Grey metal bars in the images are part of the “cage” that protects the camera dome housing. a. Benthic quadrat showing large octocoral (Anthomastus), ophiuroid, and polychaete tubes on fine sediment. Red dots are scaling lasers, and thin black lines indicate quadrat boundaries. b. General pelagic image (5 m above bottom) showing rhodaliid siphonophone and ctenophore.
Abundance of taxa from benthic transects in number m−2.

Dissimilarity between communities at different sites varied from 49–60%. Between the three sites, ANOSIM detected significant differences between communities defined by transects (R = 0.179, P = 0.02), with the north site distinctive from the south and centre sites. However, there were no significant differences in the communities defined by quadrats (R = 0.084, P = 0.06). The SIMPER dissimilarity/standard deviation ratios suggest that the only taxa contributing substantially to the differences between north and centre/south transects were ampharetid polychaetes and polychaete tubes.
No significant differences were found in any ANOSIM analysis at lumped taxonomic levels, indicating that the most detailed species identification possible revealed community differences that simplified taxonomy did not.
For midwater transects, ANOSIM found no differences between depths (R = −0.028, P = 0.54) but differences between sites (R = 0.498, P = 0.02). As in the seafloor transects, the water column transects at the north site were different from the south and centre sites. The small number of replicates may make detection of statistical significance difficult (Table S2), and warranted a visual inspection that suggests that near-bottom abundances were generally higher than in the water column (Fig. 3).
Total abundance of planktonic organisms m−1 of transect, observed near the seafloor, in midwater, and near the ice surface, at three sites under the McMurdo Ice Shelf. Standard error is shown when there were replicate samples.

Visually, the differences between the community under the ice shelf and nearby McMurdo Sound benthic communities under sea ice (Dayton & Oliver Reference Dayton and Oliver1977) were due to the frequent occurrence of the octocoral Anthomastus Verrill and rhodaliid siphonophores, and the high abundances of cerianthid anemones and ampharetid polychaetes under the MIS. Other taxa observed in imagery but not captured in transects or quadrats included urchins from the family Cidaridae, Ceratoserolis Cals isopods, and the fishes Gymnodraco acuticeps Boulenger and Dissostichus mawsoni Norman.
CTD
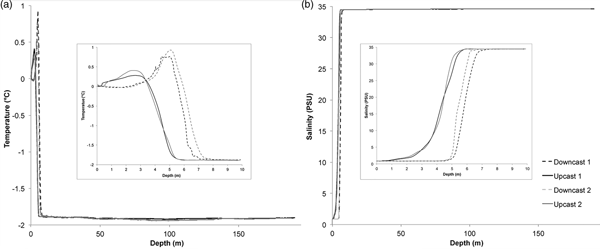
Temperature at the water/air interface was 0°C, and there was a small peak in near-surface temperature (0.25–1.00°C) at between 2.5 m and 5 m depth (Fig. 4). Water temperature decreased rapidly to between -1.75°C and -1.88°C by 7–8 m depth, and then more slowly to -1.91°C by 50 m depth. There was a slight drop in temperature (to -1.92°C and -1.94 °C in different casts) centred around 100 m depth, and a slight increase to -1.90°C near the bottom (at 188–190 m depth). The water just under the ice was relatively warm, and there was a suggestion of slightly warmer water flowing along the bottom and a cooler layer at 100 m.
Data from CTD casts done on 25 November 2008 (cast 1) and 1 December 2008 (cast 2). Insets show detail of top 10 m. a. Temperature in °C. b. Salinity in PSU.

There was a fresh water layer from the surface to 1–5 m depth, with salinity 0.86 (Fig. 4). Salinity then rapidly increased to between 34.45 and 34.47 at 6–8 m depth, and further increased gradually to 34.60 at 190 m.
Currents
During the 13-day current meter deployment, current direction gradually turned counter-clockwise from north (360°) to south-south-east (150°) (Fig. 5). Current speed varied between 1.8 cm s−1 and 3 cm s−1, with the highest current speeds in the west-south-west direction. Over the duration of the deployment, the total current displacement was 1.3 cm s−1, in a WSW direction, while the average current speed was 2.4 cm s−1.
Progressive vector diagram of current at 90 m depth between 25 November and 8 December 2008. Start at 0, 0, markers at each 24 hours.

Discussion
From the sparse number of sites under ice shelves where seafloor ecosystem observations have been made, there appears to be some distance under ice shelves where diverse benthic communities give way to a few remnant species. It is possible that this distance is set by advection of photosynthetically-sourced material. Marine snow, the packaged output of primary productivity, settles at a rate of 0.05–0.11 cm s−1 (Shanks & Trent Reference Shanks and Trent1980). The settling rate of a string of the prymnesiophyte Phaeocystis Lagerheim, a common primary producer in the Ross Sea (Arrigo et al. Reference Arrigo, Robinson, Worthen, Dunbar, Di Tullio, Van Woert and Lizotte1999) is 0.005–0.23 cm s−1 (Schoemann et al. Reference Schoemann, Becquevort, Stefels, Rousseau and Lancelot2005). For an average settling speed of 0.10 cm s−1 in still water it would take two days before surface productivity would reach the seafloor at a depth of 190 m. This oversimplified first-order model can be further developed using the observed current speeds to estimate lateral transport times. At the MIS site, 80 km from the ice edge, the average current speed was 2.4 cm s−1, moving towards Heald Island. At this speed, it would take a minimum of 39 days for water under the sea ice to reach the site under the ice shelf, or longer since the observed current direction was at least 15° off the direction to the closest sea-ice edge (244°). Current data were collected during the neap tidal cycle, but even at the higher average speed of 9 cm s−1 found by Dunbar et al. (Reference Dunbar, Leventer and Stockton1989), the resulting ten day transit time is still an order of magnitude longer than the time it would take for passive particles to settle to the seafloor. This mismatch between the settling time and the transport time suggests that herbivores are not directly consuming primary production at the MIS site. It might be predicted that herbivores disappear from the benthic community approximately 16 km from the edge of the ice shelf, the lateral distance that photosynthetic production might be advected before it settles to the seafloor. This concept is supported by the high phytoplankton concentrations observed near White Island, 22 km from the edge of the MIS, by Dayton & Oliver (Reference Dayton and Oliver1977), and the complete lack of phytoplankton found in the water near Heald Island by Littlepage & Pearse (Reference Littlepage and Pearse1962).
While it is unlikely that substantial food in the form of phytoplankton is getting to the MIS site, the benthic community there is nevertheless abundant and diverse, with many invertebrate taxa represented. Thus both food and a larval supply must be transported this distance; both zooplankton and mesoplanktonic larvae are active swimmers. Though swimming speeds in plankton are often high enough to overcome settling rates if swimming is in a directed manner, the energetics are such that sustained swimming under the lack of a consistent food source is untenable. Nevertheless, swimmers could easily reach the MIS site simply by remaining in, or periodically re-entering, the water column, where they could be transported by horizontal currents. Polychaete larvae have been observed 430 km away from the ice edge, under the ice shelf (Holm-Hansen et al. Reference Holm-Hansen, Carlucci and Azam1979).
Negative geotaxis in invertebrate larvae is a common trait (Butman Reference Butman and Nihoul1986 and references therein) that might allow invertebrate larvae sourced from habitats under sea ice to recruit at the MIS site. Invertebrate larvae fall passively in a range from 0.01–0.30 cm s−1 (polychaetes, Butman Reference Butman and Nihoul1986) and swimming speeds are of the same order of magnitude, 0.05–0.52 cm s−1 (Butman Reference Butman and Nihoul1986 and references therein). By swimming upward, larvae could remain under the influence of currents for as long as they could survive. The length of time that larvae of benthic invertebrates can survive before settlement and metamorphosis is highly variable, ranging from hours to months for different species (Pechenik Reference Pechenik1990, Hadfield & Strathmann Reference Hadfield and Strathmann1996). Even lecithotrophic, non-feeding larvae often survive for weeks, and planktotrophic, feeding larvae can persist in the water column for months. The species that were most abundant under the McMurdo Ice Shelf included polychaetes, which in general have lecithotrophic larvae. The other species most common under the McMurdo Ice Shelf, ophiuroids, are generally brooders, and once established, might maintain a local population with minimal larval resupply from distant sources. To reach 80 km from the ice edge such as at the MIS site, at a current speed of 2.4 cm s−1, larvae must be able to survive 39 days, a not unusual amount of time, reflected in the relatively diverse community found there. Characteristics of current velocities, larval survival time and larval feeding requirements probably combine in a filter that limits the diversity of communities found under ice shelves.
The persistence of the MIS community also requires adequate food sources, which, as shown, are not likely to be direct consumption of phytoplankton. Zooplankton grazers in the nearby lighted waters of McMurdo Sound are dominated by small copepods (Foster Reference Foster1987). The most common genera, Oithona Baird, exhibit a saltatory movement pattern where they sink at a rate of 0.03 cm s−1 and periodically “jump” upwards to maintain a constant position in the water column (Paffenhöfer & Mazzocchi Reference Paffenhöfer and Mazzocchi2002). Copepods can survive unfed for between 3 and < 21 days (Dagg Reference Dagg1977). Copepods could thus be contributing to food resources tens of km from the ice edge (44 km back at a current speed of 2.4 cm s−1). In constructing the midwater food web of McMurdo Sound, Hopkins (Reference Hopkins1987), found that krill, Euphausia crystallorophias Holt & Tattersall, was the most abundant macroplankton. Krill sink at a rate of 0.2–0.8 cm s−1 (Tarling & Johnson Reference Tarling and Johnson2006) and can swim 5–10 cm s−1. The diurnal migration pattern krill exhibit during summer months is clearly sufficient to maintain them in water column where they can be advected by currents. Overwintering krill can survive starvation for 211 days (Ikeda & Dixon Reference Ikeda and Dixon1982), during which time they could be transported 438 km under the MIS.
The food web to support the MIS community thus requires herbivores and at least one level of grazers/omnivores in the water column, plus transportation of the grazers to the site. Previous studies of the McMurdo Sound pelagic food webs, using nets to sample the midwater, may have missed or underestimated abundant gelatinous animals. The observations in the present study, of high abundances of gelatinous animals, especially near the seafloor, suggest that they may play key trophic roles, concentrating food near the benthos. Two trophic levels, in combination with larval survival time of weeks and current speeds of cm s−1, is adequate to support the communities found at the MIS site in this study.
At the edge of the McMurdo Ice Shelf, the winter darkness lasts approximately 180 days (of astronomical twilight or darker), and a full marine community thrives there despite there being no photosynthetic production during this time span. At this outer edge of the ice shelf some primary production may be advected in from further north where light remains year round, and contribute to the survival of organisms there. It is also possible that some Antarctic organisms might survive without food for 180 days. The ability to survive a long period of time with no-to-minimal food may contribute to the survival of some of the species in the community discovered 80 km back under the MIS. However, it is likely that at least some portion of the under ice shelf community discovered is dependent on external food resources (sensu Ingels et al. Reference Ingels, Aronson and Smith2018 and references therein).
The MIS site food web may start with photosynthetic production in the open waters of the Ross Sea. Though photosynthetically-dependent phytoplankton are an unlikely direct source of food at the MIS site, because it is isolated from sunlight vertically by 20+ m of ice, and horizontally by 80 km distance to the ice shelf edge, external (Ross Sea) energy sources may still be important. Lateral transport from the Ross Sea may carry both live metazoans and a food source for the community at the MIS site. Smaller planktonic material without fat stores, though caught in the same currents, may die and be consumed before reaching this area.
An alternative possible source of primary production is chemosynthesis. The only direct measurements of productivity under an ice shelf found that under 412 m thick ice of the Ross Ice Shelf, there were negligible contributions to productivity from heterotrophic and photosynthetic processes, but there was appreciable chemosynthetic productivity, with enough chemoautotrophic nitrifying bacteria to support the low amphipod biomass found in the area, via three trophic levels (Horrigan et al. Reference Horrigan1981). Though nitrogen-based energetic compounds are common in seawater, the biomass accumulation via these pathways is small. Recent work has shown that chemosynthetic organisms active in subglacial environments may also use S, Fe and CH4 as energy sources (Mikucki et al. Reference Mikucki, Lee, Ghosh, Purcell, Mitchell and Mankoff2016), and are capable of supporting more robust metazoan populations. This chemosynthetic microbial biomass is not directly available to the full diversity of species observed, many of which lack appropriate feeding or symbiotic mechanisms. Gelatinous animals may be the intermediate that can harvest microbial biomass and concentrate it, making it accessible to other consumers. It is thought that chemosynthetic production contributes to the high abundances of jellies, both pelagic and benthic, observed around hydrothermal vents (Burd & Thompson Reference Burd and Thomson2000, Vinogradov & Shushkina Reference Vinogradov and Shushkina2002, Lindsay et al. Reference Lindsay, Umetsu, Grossmann, Miyake, Yamamoto, Ishibashi, Okino and Sunamura2015). A similar mechanism may be in play under ice shelves, with jellies further providing a link between dark carbon fixation and abundant scavengers.
Summary
The animals found under the McMurdo Ice Shelf are intriguing indications of the connection with the open ocean despite the considerable geographic distances. The MIS site has a regular resupply of larvae and external input of planktonic food. The MIS benthic community may in part depend on gelatinous animals providing a food-concentration mechanism from the pelagic to the benthos. It is possible that microbial chemosynthesis may provide some in situ productivity and support the fauna via a gelatinous animal food web link.
Author contribution
SK collected the data, performed the analysis, and wrote the paper.
Supplemental Material
Tables S1 and S2 will be found at http://dx.doi.org/10.1017/S0954102018000561
Acknowledgements
This work was possible only with the dedicated preparation and fieldwork of the 2008 SCINI field team, especially Francois Cazenave, D.J. Osborne, and Scott Heeschen. Marty Hynes provided invaluable assistance with mathematical processing. McMurdo Station personnel supported many aspects of the field season. The authors are very grateful to the reviewers and editors who improved this paper. Financial support was provided by CC&R, VideoRay and NSF grant numbers OPP-0619622 and ANT-0944747. Any opinions, findings and conclusions or recommendations expressed in this material are those of the authors and do not necessarily reflect the views of the NSF.