Introduction
The Negev is a semi-arid desert region located in the southern portion of Israel. The primary agricultural use for this area is the growing of vegetables, grains and fruit. On average 100,000–120,000 million tons (MT) of wheat can be produced per year; however, Israel is currently in the midst of a multi-year drought, which has decreased wheat production to under 100,000MT per year (Shachar, Reference Shachar2010). Israel is not self-sustaining in wheat production, and wheat imports are needed to meet the demand for both human and animal consumption (1.7MT) (Shachar, Reference Shachar2011).
One way to increase wheat yield is through the control of wheat pests. The Hessian fly (HF), Mayetiola destructor (Say) [Diptera: Cecidomyiidae], is a common threat in most wheat-growing areas of the world (Ratcliffe & Hatchett, Reference Ratcliffe, Hatchett and Bondari1997). HF is believed to be endemic to the Fertile Crescent and to have coevolved with the wheat genus Triticum (Harlan & Zohary, Reference Harlan and Zohary1966; Lev-Yadun et al., Reference Lev-Yadun, Gopher and Abbos2000; Zohary & Hopf, Reference Zohary and Hopf2000; Stukenbrock et al., Reference Stukenbrock, Banke and McDonald2006). It is the main destructive pest of wheat in the southeastern United States and has caused significant economic loss in terms of reduced grain yield in that region (Buntin, Reference Buntin1999; Ratcliffe et al., Reference Ratcliffe, Cambron, Flanders, Bosque-Perez, Clement and Ohm2000). HF was first reported in northern Israel in the winter of 1938 to 1939 when heavy infestations were found in fields of wheat (Duvdevany, Reference Duvdevany1939). Today, it is known to occur in the agricultural areas of the northern Negev and the southern Coastal Plain (Rivnay, Reference Rivnay1962; Avidov & Harpaz, Reference Avidov and Harpaz1969). Whether the insect is endemic to the Coastal Plain and northern Negev or was introduced from some other location before it was first reported in 1939 is unknown. Though it is not officially classified as a pest in Israel, HF has been a significant pest of wheat across North Africa since the early 1900s.
Adults are short lived (3–4 days) and do not feed. Females will mate and lay their eggs on the adaxial surface of a leaf blade within hours of emergence. After 3–5 days (depending on temperature), the eggs hatch, and the neonate larvae crawl down the leaf blade and enter the whorl of the plant. A feeding site that includes formation of a nutritive cell layer to provide nutrient-rich cytoplasm for the larva to feed on (Rohfritsch, Reference Rohfritsch, Labeyrie, Fabres and Lachaise1987; Harris et al., Reference Harris, Freeman, Rohfritsch, Anderson, Payne and Moore2006) is established near the crown tissue in seedling plants or at infested nodes in jointing plants.
While HF is a gall midge, no true gall (i.e. outgrowth or swelling) is formed in the plant. The larvae feed for approximately 12 days through both the first and early second instars. Feeding stops by the middle of the second instar before molting to the third instar, which is contained within a puparium formed from the cuticle of the second instar. Third instars will either diapause to overwinter or complete their development to adulthood, depending on temperature and rainfall. In North America, there are commonly two generations per year; however, colder northern regions may see one generation while warmer southern regions may see six to eight (Buntin & Chapin, Reference Buntin and Chapin1990; Lidell & Schuster, Reference Lidell and Schuster1990). In Israel, there are usually two generations per year, although in the past couple of years, due to mild winters, three generations were observed.
All damage to wheat is due to feeding by the larvae. In seedling plants, larval feeding irreversibly stunts infested primary shoots or tillers and prevents them from heading, resulting in yield loss (Byers & Gallun, Reference Byers and Gallun1972). In older, jointing plants, the redirection of nutrients from the plant to the insect decreases seed yield and results in lodging at infested nodes that makes harvesting difficult (Buntin, Reference Buntin1999).
Currently, the best control for HF is the use of resistant wheat cultivars (Chen et al., Reference Chen, Echegaray, Whitworth, Wang, Sloderbeck, Knutson, Giles and Royer2009). A HF is considered virulent if the larvae are capable of surviving and stunting the plant, while resistance in wheat is expressed as larval antibiosis within the first instar, leaving no lasting effects on the plant (Ratcliffe & Hatchett, Reference Ratcliffe, Hatchett and Bondari1997). Resistance has been found in common and durum wheat cultivars, wild wheat relatives, rye and Baroness barley. To date, 33 resistance (R) genes (H1–H32 and Hdic) have been identified in various progenitors of wheat, as well as Triticum durum and T. aestivum cultivars (Ratcliffe & Hatchett, Reference Ratcliffe, Hatchett and Bondari1997; Martin-Sanchez et al., Reference Martin-Sanchez, Gomez-Colmenarejo, Del Moral, Sin, Montes, Gonzalez-Belinchon, Lopez-Brana and Delibes2003; Williams et al., Reference Williams, Collier, Sardesai, Ohm and Cambron2003; Liu et al., Reference Liu, Brown-Guerdira, Hatchett, Owuoche and Chen2005; Sardesai et al., Reference Sardesai, Nemacheck, Subramanyam and Williams2005). Unfortunately, the deployment of resistant cultivars places a selection pressure on HF populations. This leads to the appearance of genotypes (biotypes) that can overcome resistance. In the field, R genes have a 6–8 year window of effectiveness (Hatchett et al., Reference Hatchett, Starks, Webster and Heyne1987; Ratcliffe et al., Reference Ratcliffe, Cambron, Flanders, Bosque-Perez, Clement and Ohm2000). Since adult HFs are weak fliers (Harris et al., Reference Harris, Stuart, Mohan, Nair, Lamb and Rohfritsch2003), primary dispersal is done through human transportation of puparia in infested straw.
Previous studies on local varieties of Negev wheat cultivars indicated there is considerable genetic diversity in wheat within this area due to mixed cultivar planting, inter-regional seed exchange, and natural cross-breeding between local and introduced varieties (Poiarkova & Blum, Reference Poiarkova and Blum1983). Additionally, wild wheat (emmer, T. turgidum ssp. dicoccoides) is endemic to the Galilee and, to a lesser extent, the Jerusalem area (Nevo & Beiles, Reference Nevo and Beiles1989).
Initial population studies with both mitochondrial and nuclear markers identified a population of HF from the northern Negev as possibly ancestral to what is found in the United States (Johnson et al., Reference Johnson, Schemerhorn and Shukle2004, Reference Johnson, Morton, Schemerhorn and Shukle2011). The combination of increased genetic diversity in the host plant and the isolation of potentially ancient populations of HF in Israel could have implications for documenting the ancestry of HF in the Fertile Crescent region of the Middle East, as well as further defining the wheat/HF interactions in regards to the emergence of genotypes of the pest that can overcome genes for resistance in wheat.
The objectives of the present study were: (i) to confirm the identity of HF from Israel using morphological characters, DNA barcoding, and oviposition preference on wheat; (ii) to evaluate virulence in the Israeli HF to different R genes in wheat; (iii) to determine field infestation levels; and (iv) to assess population structure using microsatellite markers with multiple collections from different locations within Israel.
Materials and methods
Sample sites and collection of HF
HF was sampled in Israel from five sites: three in the northern Negev (Kibbutz Magen, Kibbutz Ruhama and Gilat) and two from the southern Coastal Plain (Kibbutz Yad Mordechai and Kibbutz Zikim) (fig. 1). Collections were made by randomly harvesting plants from three to five different areas within an infested field. Collected samples of infested wheat plants were shipped FedEx under APHIS permit number P526P-09-00335 to the USDA-ARS Crop Production and Pest Control Research Unit in West Lafayette, IN, USA. Infested plants were placed in plastic boxes (26 × 39cm) to allow for adult emergence. Boxes were maintained at 18 °C, and the infested plant material was misted occasionally to maintain humidity and enhance adult eclosion. As adults emerged, representative samples were preserved in 100% ethanol at −20 °C for later extraction of DNA and evaluation with the cytochrome c oxidase I (coxI) barcoding sequence and microsatellite markers.
Sample Locations. This map displays the Israeli collection sites. Stars indicate the Hessian fly sample locations of Kibbutz Yad Mordechai, Kibbutz Ruhama, Kibbutz Zikim, Gilat and Kibbutz Magen. The locations where infestation levels were sampled, Kibbutz Be'eri and Kibbutz Alumim, are also shown. Country borders are in yellow while the Palestinian territories of the West Bank and Gaza Strip are in red.

Initially, collections of HF from Magen, Ruhama and Gilat were successfully brought into culture. However, the Gilat and Ruhama collections were not sustainable, and only the Magen collection was successfully cultured under the environmental chamber and greenhouse conditions by the protocols described by Foster et al. (Reference Foster, Araya, Safanski, Cambron and Taylor1988) and Black et al. (Reference Black, Hatchett and Kirchma1990) for further laboratory testing. HF samples preserved in 100% ethanol from Lattakia, Syria, as well as a sample of Barley stem gall midge (BM) (Mayetiola hordei (Keiffer) [Diptera: Cecidomyiidae]) were kindly provided by Dr Mustapha El-Bouhssini, Senior Entomologist, International Center for Agricultural Research in the Dry Areas, Aleppo, Syria.
Morphological evaluation and ovipostion preference
Adults were initially identified as HF by comparing morphological characters described by Gagné et al. (Reference Gagné, Hatchett, Lhaloui and Bouhssini1991) to differentiate it from the BM, a congener found in the Mediterranean basin that closely resembles HF. HF puparia were examined under an Olympus SZX16 stereo microscope for distribution of spicules and attachment of the plant's cell wall to the puparia. Adult females were inspected at the 6th–8th abdominal tergites using measurements and descriptions as described in Gagné et al. (Reference Gagné, Hatchett, Lhaloui and Bouhssini1991). In HF, the 6th tergite is wider (0.458mm), the 7th tergite flares out anteriorly and the 8th tergite is wedge-shaped. In BM, the 6th tergite is narrower (0.417mm) and the 8th tergite is rectangular. Adult males were inspected for the long gonostyli and deeply separated and parallel hypoproctal lobes associated to HF.
When given a choice between oviposition on wheat or barley, HF females significantly prefer to oviposit on wheat while BM prefers barley (Gagné et al., Reference Gagné, Hatchett, Lhaloui and Bouhssini1991). To further support the identity of HF from Israel, a barley-wheat free choice oviposition test was performed using the Magen culture. The barley cultivars, ‘Baroness’, ‘Harrison’ and ‘Radiant’, and the wheat cultivars, ‘Iris’, ‘Seneca’, Monon’, ‘Magnum’ and ‘Caldwell’, were seeded in flats with two replicates separated spatially. Wheat was seeded in randomized rows at the ends and in the middle of each flat, and the barley cultivars were seeded in randomized rows between the rows of wheat in each flat. Flats were placed in environmental chambers at 18 °C with a 16h photoperiod for germination. When the seedlings had reached the 1.5 leaf stage, each flat was caged with netting and 150 gravid females from the Magen culture were allowed to oviposit in a free-choice manner on the plants in each flat. Before hatch, eggs were counted on 20 randomly selected wheat plants from each row and from 20 randomly selected barley plants from each row to evaluate oviposition preference of the females.
Though very similar in appearance to HF, the BM creates a gall at its feeding site at the base of the whorl that adheres to the cell wall of the plant and makes removal difficult. Conversely, HF does not create a visible gall at its feeding site, stunts susceptible wheat and is easily removed from the plant. Further, HF infestation of barley is either asymptomatic or results in mild stunting.
Eggs hatched in approximately 4–5 days and the netting was removed. Plants were sampled at 14 days post-hatch to evaluate for stunting and/or lack of galling at the feeding site and to confirm the presence of larvae within the leaf sheath. Galling at the base of the infested whorl of barley plants would indicate the BM, while stunting of wheat plants would indicate HF. Infested barley plants were scored for lack of a gall at the feeding site and being either asymptomatic or displaying mild stunting, as well as ease of removal of puparia from the plant. Statistical testing for significance between the mean numbers of eggs laid on wheat compared to barley was performed by a Mann-Whitney test within the program R (R Development Core Team; http://www.R-project.org) (Hornik, Reference Hornik2011).
DNA barcoding using coxI
DNA from individual flies was isolated using the DNeasy Blood and Tissue kit (Qiagen, Valencia, CA, USA). Ten individuals from each of the Magen, Ruhama, Gilat, Zikim and Yad Mordechai, Israel collections, as well as the Lattakia, Syria and Dallas County, Alabama collections were selected for barcoding analysis. Hebert's coxI barcoding primers LCO1490 and HCO2198 were used to amplify an approximately 700 base pair (bp) sequence (Hebert et al., Reference Hebert, Cywinska, Ball and deWaard2003, Reference Hebert, Penton, Burns, Janzen and Hallwachs2004; Smith et al., Reference Smith, Fisher and Hebert2005; Ratnasingham & Hebert, Reference Ratnasingham and Hebert2007). Each 25μl reaction contained 5μl of 5 × GoTaq polymerase reaction buffer (Promega, Madison, WI, USA), 3 mmoles MgCl2, 10pmoles each primer, 0.2mmoles each dNTP (Promega dNTP mix), 2.5units of GoTaq polymerase (Promega). Polymerase Chain Reactions (PCR) cycling was with a DNA Engine Dyad PTC-220 and PTC-221 (BioRad, Hercules, CA, USA) under the following conditions: denaturing at 95 °C for 2min; 35 cycles of denaturing at 95 °C for 1min, annealing at 50 °C for 30s, extension at 72 °C for 1min; final extension at 72 °C for 10min. In order to obtain the longest sequence, cox1 fragments were cloned using the pCR®4-TOPO® vector into electrocompetent TOP10 cells (Invitrogen, Grand Island, NY, USA). Three clones per individual were sequenced through the Purdue Genomics High Throughput Center. A consensus sequence was made for the coxI sequence for each individual, and all coxI sequences were aligned using ClustalW2 (Chenna et al., Reference Chenna, Sugawana, Koike, Lopez, Gibson, Higgins and Thompson2003). Arlequin 3.11 (Excoffier et al., Reference Excoffier, Laval and Scheider2005) was used to calculate F ST. PAUP* (Swofford, Reference Swofford2003) and Treeview (Page, Reference Page1996) were used to create the phylogenetic reconstruction using the distance neighbor-joining model F84 and parsimony algorithms. Two gall midge species were used as outgroups in the reconstruction, M. hordei (JN638248.1-full length coxI) and Rabdophaga rigidae (AB244544.1-partial length coxI). Rabdophaga rigidae (Osten Sacken), the willow beaked gall midge, is from the same tribe as HF, Oligotrophini. TCS was used to calculate the networking relationships of coxI barcodes (Clement et al., Reference Clement, Posada and Crandall2000).
Evaluation of virulence
The response of the Magen collection to different R genes in wheat was conducted with wheat lines carrying a different R gene seeded in flats (two replicates) in the manner described for the virulence flat test methodology developed by Chen et al. (Reference Chen, Echegaray, Whitworth, Wang, Sloderbeck, Knutson, Giles and Royer2009). Nineteen lines carrying the following single R genes or gene combination were seeded in each flat: H3, H5, H6, H7H8, H9, H10, H11, H12, H13, H14, H16, H17, H18, H21, H22, H23, H24, H25, H31 and H32. These were lines in which sufficient seed was available for virulence testing and represented 19 of the 33 named HF R genes in wheat. The susceptible wheat cultivar ‘Newton’ (carrying no R gene) was also seeded in ‘check’ rows at the ends and in the middle of each flat to check for uniformity of infestation throughout the flat. Fifteen to 20 seeds of each line were seeded in randomized half-rows in each flat. Flats were then placed in controlled environmental chambers at 18 °C with a 16h photoperiod for seed germination.
After seedling plants had reached the 1.5 leaf stage, each flat was caged separately with netting, and 150 gravid females from the Magen culture were aspirated from plastic emergence boxes and released under the netting. Females were allowed to oviposit in a free-choice manner. Egg hatch was observed 4–5 days after oviposition at which time the netting was removed. Flats were maintained in growth chambers, and plants were evaluated at 14 days post-hatch for resistance or susceptibility. Resistant plants were not stunted, exhibited normal growth habit and, when dissected, contained dead 1st-instar larvae. Plants with no dead larvae (escapes from infestation) were discarded. Susceptible plants contained living larvae and exhibited stunting and a darker green color that is associated with infestation. The total number of resistant and susceptible plants from both flat replicates was recorded.
Since there was no documentation that HF R genes have ever been deployed in Israel (P.G. Weintraub, unpublished data), it was hypothesized that the Israeli HF should be equivalent to the Great Plains (GP) Biotype in the United States (avirulent to all R genes). Therefore, a ratio of resistant to susceptible plants of 1:0 is expected. Goodness of fit for the number of observed resistant plants to the number of expected resistant plants was tested by χ2 analysis where degrees of freedom (df) = 1.
Complementation analysis
Complementation assays to document if the Magen collection shared loci for virulence to H3, H5, H6 and H7H8 with HF from the United States were performed in four-way differential pots with three to five plants of the wheat cultivars ‘Monon’ (carrying H3), ‘Magnum’ (carrying H5), ‘Caldwell’ (carrying H6) and ‘Seneca’ (carrying H7H8) seeded in separate quadrants. Biotype L HF (known to be virulent to H3, H5, H6 and H7H8) and Magen adults were allowed to emerge in separate boxes. Reciprocal crosses were made between Magen females × Biotype L males and Biotype L females × Magen males. A single virgin female and one male were introduced into caged pots where mating and oviposition occurred. The caged pots were placed in a controlled environmental chamber at 18 °C with a 16h photoperiod and scored for virulence at 12 days post-hatch by dissecting each plant to locate developing larvae.
HF infestation levels in Israeli wheat fields
In 2008–2009, wheat plants (150–200 plants per field) were sampled from random locations near the edges and in the center of the five fields in the northern Negev and the southern Coastal Plain previously identified above (see fig. 1) to assess for potential yield loss. In 2010, infestation levels in fields at Kibbutz Alumim and at Kibbutz Be'eri in the northern Negev (fig. 1) were also documented to assess potential yield loss.
Microsatellite amplification and genotyping
Twenty-five microsatellite markers (Schemerhorn et al., Reference Schemerhorn, Crane and Morton2008, Reference Schemerhorn, Crane, Morton, Aggarwal and Benatti2009) were selected from the available pool used with HF collections in the United States. These markers were selected for their location on autosomes and for the previously identified variability within United States populations at these loci (Morton et al., Reference Morton, Foley and Schemerhorn2011). PCR was performed according to the protocol in Schemerhorn et al. (Reference Schemerhorn, Crane, Morton, Aggarwal and Benatti2009), and polymorphisms were scored using a CEQ 8000 (Beckman-Coulter, Brea, CA, USA). Microsatellite analyses (F ST, AMOVA, HWE, pairwise linkage disequilibrium and molecular diversity indices) were performed using Arlequin 3.11 (Excoffier et al., Reference Excoffier, Laval and Scheider2005). Microchecker 2.2.3 (Van Oosterhout et al., Reference Van Oosterhout, Hutchinson, Wills and Shipley2004) was used to check for genotyping errors that cause deviation from HWE, such as stuttering, large allele dropout, null alleles and typographical errors. In order to detect recent changes in effective population size, BOTTLENECK 1.2.02 was also performed (Cornuet & Luikart, Reference Cornuet and Luikart1997). Structure 2.3.3 (Pritchard et al., Reference Pritchard, Stephens and Donnelly2000; Falush et al., Reference Falush, Stephens and Pritchard2003, Reference Falush, Stephens and Pritchard2007; Hubisz et al., Reference Hubisz, Falush, Stephens and Pritchard2009) was used to analyze the population structure comprised by the five Israeli collections using the microsatellite loci, and k was calculated using the method of Evanno et al. (Reference Evanno, Regnaut and Goudet2005).
Results
Morphological evaluation and ovipostion preference
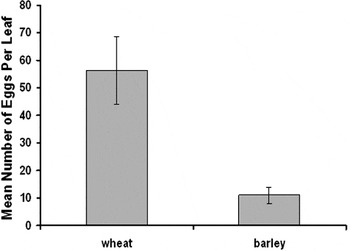
Male and female adults from Israel were examined and confirmed to be HF by use of the morphological characters (Gagné et al., Reference Gagné, Hatchett, Lhaloui and Bouhssini1991). These results documented that the putative HFs from Israel were morphologically in agreement with HF and not BM. In the barley-wheat free-choice test, female flies from the Magen culture oviposited on average 56 eggs per leaf on wheat plants, while in comparison only 11 eggs per leaf were laid on barley plants (fig. 2). The contrast between the mean number of eggs laid on wheat compared to barley was statistically significant (P ≤ 0.05).
Wheat-barley oviposition preference. Using a Mann-Whitney test, the mean number of eggs per leaf laid by Hessian fly on wheat (56) was found to be significant to the number of eggs found on barley (11). The bars on the columns indicate standard error.

DNA barcoding
Nine haplotypes of the coxI barcode (haplotypes 1–9) for HF were identified (GeneBank: JN638239.1–JN638247.1). Gilat and Yad Mordechai contained only haplotypes 1 and 2 while Zikim contained 1, 2 and 4. Ruhama was composed of haplotypes 2 and 3. Magen contained only haplotype 4. Morocco included 5 and 8, two haplotypes that did not appear elsewhere. Alabama consisted of 6 and 7. Syria was the most diverse with haplotypes 2, 3, 6, 7 and 9. The genetic distances were calculated using F84 (Felsenstein, Reference Felsenstein1984). The distance between the outgroups and the nine haplotypes ranged from 9.37–11.19% (10.1% average) for M. hordei and 13.86–15.75% (15.1% average) for R. rigidae. The distances for the nine HF haplotypes fell into two groups: group 1 contained haplotypes 1 and 2, and group 2 contained haplotypes 3 through 9. Within group 1, the distance was 0.14%, while within group two the haplotypes ranged 0.14–1.34% (0.75% average). However, the distance between group 1 and group 2 was much greater, 2.90–4.11% (3.32% average).
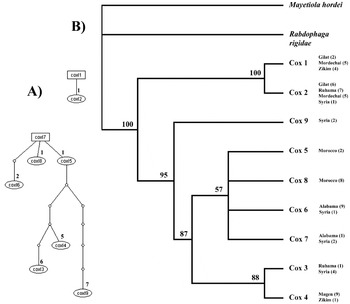
In population pairwise F ST (table 1), all sample sites separated with less than 1% distance except for Zikim, Gilat, Ruhama and Yad Mordechai, which did not separate significantly from one another. A network containing all nine haplotypes could not be built with greater than 95% confidence. Dividing the haplotypes into clades corrected this problem. The networks for clades 1 and 2 were identical to the parsimony tree. The number of mutational steps for each haplotype is located on the branches of fig. 3A. Both a 50% majority rule distance neighbor-joining tree and a parsimony tree (fig. 3B) were constructed and found to be congruent. The tree reveals isolation of the coxI-1 and coxI-2 sequences from the other seven barcodes identified. There is a lineage expansion of coxI-9 into two groups: one containing Syria, Morocco and Alabama samples and another containing Israeli and Syrian samples. These results are congruent with previous analyses (Naber et al., Reference Naber, El Bouhssini, Labhilili, Udupa, Nachit, Baum, Lhaloui, Benslimane and El Abbouyi2000; Johnson et al., Reference Johnson, Schemerhorn and Shukle2004, Reference Johnson, Morton, Schemerhorn and Shukle2011) using RFLP, mitochondrial and nuclear markers in regards to both isolation in Israel and the relationships between Syria, Morocco and the United States. AMOVA analysis revealed that there is more variance among populations (80.05%) than within populations (19.95%), which is consistent with previous data for mitochondrial loci (Johnson et al., Reference Johnson, Schemerhorn and Shukle2004, Reference Johnson, Morton, Schemerhorn and Shukle2011).
Network and Parsimony phylogenetic reconstruction of coxI haplotypes. (A) The unconnected networks for clades 1 and 2. Each line represents a mutational step, and the total number of steps as calculated from haplotype 7 is listed above each circle. (B) The parsimony tree displays bootstrap values (n reps = 10,000) at the nodes. The coxI sequence from Mayetiola hordei and Rabdophaga rigidae were used as outgroups. Sites where the haplotypes occurred are located beside the branch and the number of individuals found per location is in parenthesis.

Wright's F ST for coxI from Hessian fly. Significant values are in bold, and P ≤ 0.05.

Evaluation of virulence
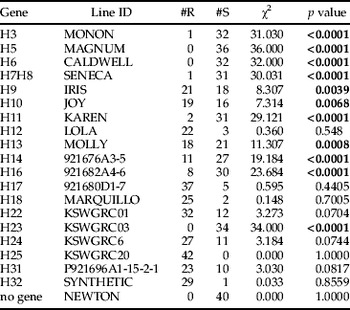
The results for the two virulence test replicates were combined and tested for significance (table 2). The Magen HF was hypothesized to be avirulent to all of the R genes tested since it was not believed to have undergone selection pressure from any of the R genes. Thus, a ratio of 1:0 was expected for avirulent to virulent phenotypes. However, the HF from the Magen culture was virulent (significantly divergent from the expected 1:0 ratio) to H3, H5, H6, H7H8, H9, H10, H11, H13, H14, H16 and H23. Though a few virulent individuals were scored on lines carrying other R genes, virulence to H12, H17, H18, H22, H24, H25, H31 and H32, the result was not significantly different from the expected 1:0 ratio of avirulence to virulence.
Virulence analysis of Hessian fly from Israel using 20 different lines of wheat. χ2 values were calculated using the program R with P ≤ 0.05.

Complementation analysis
The wheat plants infested with the F1 progeny from the complementation crosses showed the typical susceptible reaction to HF infestation. The F1 individuals from both the Magen female × L male and L female × Magen male were virulent to H3, H5, H6 and H7H8, indicating no complementation occurred that would have resulted in an avirulent genotype to the R genes tested.
HF infestation levels in Israeli wheat fields
In the field at the Gilat Research Center, infestation was approximately 3–5% of the sampled plants and was patchy within the field. At the Magen location, 20% of plants were infested at the corner of the field and 5% in the middle of the field. A 75% infestation was found at Zikim, with the entire field being evenly infested. Sampling in fields at Alumim documented that infestation ranged from 17.6–32.7%, and at Be'eri infestation ranged from 5.2–20.3%.
Microsatellite genotyping
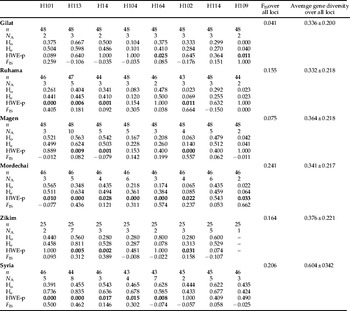
Twenty-five microsatellite markers were initially selected for use with the Israeli HF collections based on their autosomal location and variability in collections from the United States. Only eight (Hf14, Hf101, Hf102, Hf104, Hf109, Hf113, Hf114 and Hf164) were polymorphic with HF individuals from the Israeli collections (table 3). AMOVA analysis of the microsatellite markers revealed that there is more variance within populations (85.89%) than among populations (14.11%), which is consistent with previous data for nuclear loci (Johnson et al., Reference Johnson, Morton, Schemerhorn and Shukle2011). Wright's F ST (table 4) significantly reveals the separation of each of the following collections from all other collections: Syria, Gilat and Ruhama. The collections of Magen, Yad Mordechai and Zikim were not found to be significantly different.
Microsatellite statistics listed by locus for each population. Abbreviations are as follows: n = sample size, N A = number of alleles per locus, H o = observed heterozygosity, H e = expected heterozygosity, HWE-p=P-value for Hardy Weinberg equilibrium where P ≤ 0.05, and FIS = inbreeding coefficient.

Wright's F ST scores are located below the diagonal. Bolded numbers are significant differences (P ≤ 0.05). Distance (km) between locations is listed above the diagonal. It is roughly 475km from the Negev region of Israel to Lattakia, Syria.

No recent expansion or allele frequency change was detected, an indication that a bottleneck had not recently taken place. Pairwise linkage disequilibrium was not detected. Average gene diversity over all loci in all Israeli locations ranged between 0.332–0.376, while in Syria it was 0.604 (table 3). Hardy-Weinberg equilibrium (HWE) was calculated with a Bonferroni correction for multiple tests using Arlequin with a significance of P ≤ 0.05 (table 3). Seven loci indicated a departure from HWE in some but not all populations. H14 was the only locus that was in HWE in all samples.
The Structure results indicate three populations (fig. 4). Syria (green) is clearly a separate population from every collection in Israel. Each Israeli sample location contains a mixture of two populations. Gilat and Ruhama contain individuals that are primarily from population 1 (red), Magen and Yad Mordechai contain a more proportionate distribution of both populations, while Zikim primarily contains population 2 (blue). Since each collection contains both populations, mixing has occurred among them.
Structure diagram. Using microsatellite markers, three populations of Hessian fly were defined. Syria is composed of a single population (green) while the five Israeli locations are split into two mixed populations (red and blue).

Discussion
Confirmed identification of Hessian fly in Israel
Morphological evaluation of adults and puparia from field collections at the five sites in Israel supported their identity as HF. However, the intraspecific divergence within the coxI barcodes among individuals from all collections revealed two distinct lineages of HF. All nine coxI HF haplotypes clearly separated from the BM and R. rigidae coxI with a barcoding gap (intraspecific/interspecific variation) of 33% between M. destructor and M. hordei. The use of null nuclear markers distributed throughout the two HF autosomes supported the population division between Syria and Israel, while dividing Israel into two intermixed populations. There is no direct correlation between the mitochondrial barcoding lineage and nuclear microsatellite populations; and, therefore, there is no support to effectively divide the two mitochondrial lineages of HF.
There is not enough evidence presented within this study to report the identification of a cryptic species of HF in Israel. If the lineage divergence revealed by barcoding is recent, the lower mutational rate within the nuclear genome is masking the beginning of speciation (McKeon et al., Reference McKeon, Lehr, Wilkerson, Ruiz, Sallum, Lima, Povoa and Conn2010). However, the results do support the two previous studies (Johnson et al., Reference Johnson, Schemerhorn and Shukle2004, Reference Johnson, Morton, Schemerhorn and Shukle2011) that revealed mitochondrial isolation in Israel and limited nuclear gene flow between Syria and Israel.
Influence of Israel on HF
Geographic barriers surround the entirety of Israel. The Mediterranean Ocean provides the western barrier, while the Jordan River and Dead Sea run the length of the eastern barrier. Rocky mountains in the north separate Israel from Syria and Lebanon. The vast, dry Negev Desert fills the southern borders. The majority of commercial agriculture is performed in reclaimed areas of the northern Negev.
Cultivation of food crops is directly influenced by war, migration of tribes and colonization (Aaronsohn, Reference Aaronsohn1910). Since HF is primarily dispersed through human transportation of puparia, these political barriers can greatly influence gene flow. Israel lies within a much-disputed area of the Fertile Crescent. Many ancient civilizations have lived in this region, bringing with them different cultivars of wheat and cultivation practices. As political and religious hostilities arose in the region, agricultural trade was frequently interrupted, which prompted the creation of locally adapted cultivars or landraces (Aaronsohn, Reference Aaronsohn1910). Some of these landraces were so geographically specific that a difference of 10km was substantial enough to prohibit widespread distribution (Aaronsohn, Reference Aaronsohn1910). Until the last century, these landraces were the primary sources of wheat in Israel, as widespread commercial farming was not practiced. Given both geographic and political barriers to gene flow, the location and history of Israel may have contributed to the isolation of the Israeli-only coxI barcodes.
Using microsatellites, three populations are revealed among the six sampled locations. The Syrian population is completely separated from the Israeli populations and contains higher average gene diversity over all loci. Though some alleles are shared, there is a gene flow barrier between the two countries, as indicated by the high F ST values. Further support from the barcoding analysis reveals that while some gene flow may have occurred (recently or in the distant past) with the sharing of mitochondrial haplotypes, the four coxI lineages outside of Israel are derived from a Syrian haplotype. As Syria was basal to the six alleles in clade two, this indicates that Syria is an important location in the initial distribution of HF from the Fertile Crescent, as supported by Naber et al. (Reference Naber, El Bouhssini, Labhilili, Udupa, Nachit, Baum, Lhaloui, Benslimane and El Abbouyi2000).
Very few microsatellite loci are in HWE that could indicate that one or more of the five assumptions (nonrandom mating, mutation, gene flow, selection and genetic drift) are being violated. Migration may be the most direct reason for the differences in allele frequencies. HF adults are weak fliers, and dispersal over greater distances is generally due to human movement of wheat straw infested with HF puparia (Harris et al., Reference Harris, Stuart, Mohan, Nair, Lamb and Rohfritsch2003). In addition, there are geopolitical barriers in agricultural regions of Israel that restrict human movement and, therefore, the dispersal of HF resulting in isolation or preferred migration between particular locations.
The moderate levels of inbreeding and lower levels of average gene diversity over loci seen within each Israeli collection indicate isolation from Syria. While R genes in wheat are not used to control HF in Israel, seed treatments are sporadically used. The varied distribution of fields with HF control would create empty pockets of land where HF no longer exists, introducing isolation between locations within a single generation. Isolation in combination with low gene flow due to HF's lack of migration will contribute to inbreeding rates.
Influence of wheat cultivation on virulence of HF in Israel
The domestication of wheat occurred in the area north of the Fertile Crescent known today as Turkey and Transcaucasia (Gepts, Reference Gepts2002). In general, domestication influenced the genetic diversity inherent within populations through differing dispersal and cultivation practices. In modern times, commercial breeding practices focus on crossing two elite lines for desirable traits at the direct cost of genetic diversity. In situ conservation by subsistence farmers at or near the origin of domestication naturally retains the genetic diversity of wheat through the growing of local landraces and wild and heirloom cultivars (Gepts, Reference Gepts2002). These serve as reservoirs of diversity, which can be introgressed into elite lines to combat the loss by commercial breeding. For hundreds of years, local farmers in Israel have favoured regularly sowing different wheat species and regional Middle Eastern landraces in the same fields (Blum et al., Reference Blum, Golan, Mayer, Sinmena, Shpiler and Burra1989; Simms & Russell, Reference Simms and Russell1997). An assessment of wheat fields indicated that 22T. durum (durum) cultivars from five different local landrace groups, six T. aestivum (common wheat) cultivars, and two T. compactum cultivars were present across Israel (Poiarkova & Blum, Reference Poiarkova and Blum1983).
Over the years, the diversity of wheat cultivars in Israel has rapidly decreased as commercial farming replaced local, subsistence farming. Modernization began in the 1880s and focused on locally adapted varieties of durum; but, in the 1950s, common wheat cultivars from North Africa replaced them until the near disappearance of durum by the 1970s (Atzmon & Scwarzbach, Reference Atzmon and Schwarzbach2004; Poiarkova & Blum, Reference Poiarkova and Blum1983).
The ancestor of modern durum, T. dicoccoides (wild southern emmer), is the result of a natural hybridization of T. uratu (wild einkorn wheat) and an extinct relative of Aegilops speltoides (a wild goat grass species), while common wheat, known to have arisen independently in many locations, is a hybrid of T. dicoccon (domesticated northern emmer) and Ae. tauschii (Taush's goat grass) (Salamini et al., Reference Salamini, Ozkan, Brandolini, Schäfer-Pregl and Martin2002; Dubcovsky & Dvorak, Reference Dubcovsky and Dvorak2007). Before the disappearance of locally adapted durum landraces, it was estimated that the diversity of cultivars within the Negev region exceeded not only the diversity found in the entirety of the Middle East but also the world, suggesting that Israel served as the center of origin for wild southern emmer (Ozbeck et al., Reference Ozbeck, Millet, Anikster, Arslan and Feldman2007). The Israeli durum landraces are very different from those in other areas of the Fertile Crescent due to the high diversity found in the Jordan Valley and their ability to hybridize with wild emmer (Peng et al., Reference Peng, Korol, Fahima, Roder, Ronin, Li. and Nevo2000; Ozkan et al., Reference Ozkan, Willcox, Graner, Salamini and Killian2011). These novel hybrids within Israel contain phenotypes with important ecological benefits as well as a high degree of plasticity to adapt successfully in their environment (Ahern et al., Reference Ahern, Hawthorne and Raupp2009; Agrawal, Reference Agrawal2001).
Despite the absence of commercially deployed resistant wheat cultivars in Israel, virulence in the Magen HF closely resembled that documented by Cambron et al. (Reference Cambron, Buntin, Weisz, Holland, Flanders, Schemerhorn and Shukle2010) for HF from the southeastern United States, which consistently deploys R genes. Of the R genes that Israel is virulent to, three are from common wheat (H3, H5, H7H8), two from Taush's goat grass (H13 and H23) and six from durum (H9, H10, H11, H14 and H16) (Liu et al., Reference Liu, Brown-Guerdira, Hatchett, Owuoche and Chen2005). The Magen HF was avirulent to H12 from common wheat, to H22, H24 and H32 from Taush's goat grass, to H17, H18 and H31 from durum, and to H25 from rye (Secale cereale) (Liu et al., Reference Liu, Brown-Guerdira, Hatchett, Owuoche and Chen2005; Sardesai et al., Reference Sardesai, Nemacheck, Subramanyam and Williams2005). The combination of high genetic diversity in both wild emmer and durum landraces, as well as the proximity to the center of wheat domestication, may have exposed HF in Israel to these R genes long before HF's introduction into North America and direct selection pressure through deployment of R genes.
This comparison between virulence in HF from the southeastern United States and the Magen HF suggests two important hypotheses: (i) that HF genes controlling virulence to R genes in wheat have long resided in the genome within populations near the center of origin and (ii) that virulence to R genes in wheat is maintained within HF populations without direct selection pressure.
HF collections from locations in the Fertile Crescent (i.e. Israel and Syria) both display virulence to a wide array of R genes. Surprisingly, HF from Syria has been identified as the most virulent population with only H25 and H26 showing efficacy in protecting wheat (El Bouhssinni et al., Reference El Bouhssinni, Chen, Lhaloui, Zharmukhamedova and Rihawai2009). Understanding the mechanism of selection for virulent HF genotypes in the collections from Israel and Syria will require additional study and could have significant implications for understanding how virulence emerges in HF populations.
Influence of rainfall and wheat availability on HF in Israel
In Israel, wheat is primarily planted in two climatic regions: the Coastal Plain (Zikim and Mordechai) and northern Negev (Gilat, Ruhama and Magen). The microsatellite analysis weakly supports a population division between these two climatic regions; however, human dispersal and/or migration has mixed the two populations. The Coastal Plains receive more rainfall on average; however, the northern Negev receives a higher frequency of high intense rains in autumn (September to November). Commercial wheat is sown in November while local farmers plant in December when the rains have diminished (Sharon & Kutiel, Reference Sharon and Kutiel1986). The Negev remains dry for most of winter until the ‘greening up’ process begins in February when the rains return (Svoray & Karnieli, Reference Svoray and Karnieli2010).
In the southeast United States, Hessian fly cannot be controlled through the use of fly-free date planting techniques. Warm temperatures coupled with significant rainfall signals the end of HF aestivation, and this leads to multiple fall broods if wheat is planted too early or volunteer wheat is readily available. Coastal areas in Georgia usually have four broods per year: two fall, one winter, and one spring (Buntin & Chapin, Reference Buntin and Chapin1990). As the northern Negev and southern Georgia share latitudinal coordinates, it is highly likely that multiple broods occur in both winter and spring every growing year.
In order to increase the chances of multiple broods per season, there must be readily available sources of wheat for HF. The different planting times between commercial and local farming is equivalent to one life cycle of HF. A warm, wet December could trigger aestivation from HF in commercial fields and lead to a second winter brood in subsistence fields. Prolonged droughts have increased the number of abandoned and untilled silage fields, which in the United States serve as safe havens for diapausing HF (Atzmon & Schwarzbach, Reference Atzmon and Schwarzbach2004). In addition, volunteer wheat is often found as weedy roadside borders since transportation through the ages has readily scatters seeds (Cook, Reference Cook1913). Wild emmer found in rocky, uncultivated areas can also serve as a host for HF.
A mixture of two populations was also detected in the southeastern United States (Morton et al., Reference Morton, Foley and Schemerhorn2011). No bottleneck was detected, but the availability of the host plant in silage fields before the fly free dates played an important role in increasing the number of broods per year. Evolutionary differences from mutations can accumulate faster within isolated areas where more broods per year occur, leading to increased genetic drift (Masel, Reference Masel2011). Local and spatial factors provided limited influence over the large area of the southeastern United States; however, genetic drift within the small geographic region under study could provide a potential explanation for the separation of the Israeli populations from Syria where there are fewer broods per year.
Influence of HF on Israel
Yield loss from HF infestations of wheat is considered to become significant when fall infestations exceed 5–8% of the plants in a field and when spring infestations exceed 13–20% (Buntin, Reference Buntin1999). These estimates were initially made for the southeastern United States, but they should also be applicable to Israel. Infestation levels for fall infestations in six of the seven fields surveyed substantially exceeded the infestation levels for significant yield losses, and the 3–5% spotty infestation levels in the field at the Gilat location was equal to a significant yield loss at some locations within the field. Estimation of virulence and yield loss within fields in Israel suggests that the use of resistant cultivars would greatly reduce losses due to HF infestations. Historically, there has been no program to introgress HF R genes into wheat lines adapted to Israel. The seed treatment insecticides Cruiser (Syngenta) and Gaucho (Bayer) are used with wheat for control of HF and other insect pests in Israel; however, application of these seed treatments introduces a significant additional cost into wheat production. Additionally, these seed treatment will not protect the crop from spring infestations. Thus, introgression of HF R genes into wheat lines adapted to agronomic conditions in Israel is a control strategy worthy of consideration. The current study has documented the R genes H12, H17, H18, H25 and H32 provided effective resistance toward the Magen HF and should be effective in protection of wheat in Israel.
Conclusions
Hessian fly has been positively identified as a wheat pest in Israel. It occurs at a level of infestation that significantly impacts yield loss. The use of wheat cultivars that contain at least one of the R genes for H12, H17, H18, H22, H24, H25, H31 and H32 are suggested for immediate use to control HF and increase crop yield. While levels of differentiation in the coxI barcoding region are well within species tolerances, isolation of HF in Israel has occurred. Additional research is required to positively identify if the mitochondrial and nuclear evidence reported here can support Israeli HF as a cryptic species.
Acknowledgements
We thank John Shukle for the statistical analyses pertaining to this study. Special thanks to Dr Mustapha El Bouhssini for sending samples of both Mayetiola destructor and Mayetiola hordei. This is a joint contribution of the USDA-ARS and Purdue University. This study was supported through USDA CRIS no. 3602-22000-016-00D.