

Introduction
Horse trials (eventing) originally evolved from the training of cavalry horses. The sport is rather like the pentathlon in that it combines different disciplines in one competition, and is run on a cumulative penalty basis. The sport of eventing is a great all-round test of horse and rider and a tremendous examination of horsemanship, and is renowned for being one of the most challenging equestrian sports for both horse and riderReference Phillips1. The one-day event (ODE) is a three-phase competition. Phase 1 is the dressage (DR) test that comprises a set sequence of compulsory movements at a relatively low speed in an area that is 20 m wide and 40 m long (60 m at higher levels of competition). Phase 2 is the showjumping (SJ) test, where the horse and rider combination is required to complete one round of jumping over approximately 9/10 coloured fences within a set time. Phase 3 is the cross-country (XC) test, in which the horse and rider negotiate a series of solid natural obstacles while galloping across the countryReference Paix2.
Horse riding is considered to be a particularly dangerous sportReference Whitlock, Whitlock and Johnston3–Reference Ball, Ball, Kirkpatrick and Mulloy5. The sport of eventing in particular was brought under the scrutiny of the public eye in 1999 for negative reasons. Five riders were killed at separate events during the season, and the sport has been put under pressure to investigate accidents and improve safety for both horse and rider. These tragedies have forced the immediate revision of all possible factors that might have had a part in the tragic events, in order to prevent similar accidents from occurring in the future. Among the reasons suggested as potential contributing factors for the recent tragedies are the fitness and competence of the equestrian rider. In 2007, following another spate of deaths in eventing with seven riders dying in a period of ten months, the governing body of world equestrian sport, the Federation Équestre Internationale, launched a review of safety6.
In the interest of the horse, the fitness and competence of the rider are regarded as essential7. ‘A tired horse will be hindered by a tired rider’Reference Chiacchia8. Equestrian athletes spend many hours each week ensuring proper nutrition, exercise and training, and excellent medical care is provided for their horse. However, many riders overlook these important areas for themselves.
A large amount of literature exists on the technique of riding, and on the anatomy and physiology of the mammalian body and the effects of exercise and consequently training of the physiological systems of the general athlete. Physical fitness is required by the equestrian athlete for maintenance of balance and effectiveness, but scientific research into the physiological demands of horse riding is very limited, especially considering the diversity of disciplines now popular within the sport.
Gutiérrez Rincón et al. Reference Gutiérrez Rincón, Vives Turcó, Muro Martinez and Casas Vaqué9 monitored the heart rate (HR) and lactate profiles in three elite equestrian athletes and their horses during the SJ phase of the Olympic three-day event to ascertain the metabolic cost of that discipline. HR measurements indicated that jumping in the competition involved a work rate of above 90% maximal HR. An increase in lactate production was observed above that of lactate threshold (4–8 mmol l− 1), suggesting that there is a local metabolic build-up during the short period of exercise. Both HR and lactate levels were higher in the riders than in their horses, suggesting that the metabolic cost to the riders was higher than that for the horses.
Perhaps one of the most useful guides to the physical demands of riding is the work of WesterlingReference Westerling10, who studied 13 experienced and three elite equestrian athletes during submaximal and maximal bicycle ergometer exercise and during a ridden test. The HR/O2 uptake relationships were similar at the same workload in the ridden and cycle ergometer tests, although HR tended to be higher in sitting trot. During canter, the experienced riders were found to be working at over 60% maximal aerobic power, an intensity at which some training effects would be expected. Interestingly, static muscle strength did not differ significantly between rider and control groups.
Trowbridge et al. Reference Trowbridge, Cotterill and Crofts11 reported on the physical demands of riding in National Hunt Racing in the UK, an event that has some similarities with the XC phase of the three-day event. Seven male jockeys were used in the study over 30 races. Average HR ranged between 137 and 178 beats min− 1, and peak HRs were 162–198 beats min− 1. Post-race blood lactate concentrations ranged from 3.5 to 15.0 mmol l− 1. These findings suggest that National Hunt Racing requires the jockeys to be both aerobically and anaerobically fit, as indicated by the high HR and peak lactate results.
The physical and haematological responses to exercise of 24 collegiate female equestrian athletes were reported by Meyers and SterlingReference Meyers and Sterling12. Body mass index (BMI) and lean body mass (LBM) fell within the reported athletic norms for females, although % body fat (BF) was above average in the riders. Mean VO2max, VEmax and hand grip strength were lower in the riders when compared with the predicted values for female athletes competing in other sports. It was concluded that a lack of adequate physical conditioning of the equestrian athlete could be a contributing factor in the growing trend in injuries. In general, riders when compared with athletes in other sports possessed below-average aerobic power, anaerobic capacity and muscular strength, with an above-average %BF.
Devienne and GuezennecReference Devienne and Guezennec13 measured the energy expenditure of horse riding in five experienced riders. There was no statistical difference between the riders riding known and unknown horses. It was concluded that energy expenditure increases significantly during riding and that ‘a good aerobic capacity appears to be a factor determining riding performance in a competition’. Regular riding and increased physical rider training were recommended to enhance physical fitness of competitive equestrian athletes.
The aim of the present study was to describe the physiological responses and metabolic cost of the different phases of eventing in a simulated competition. Our hypothesis was that there would be a variation in metabolic demand between different riders and within the same rider over the different phases.
Materials and methods
Subjects
Sixteen female volunteer subjects (n = 16) who engage in regular equestrian events were used in the study. The riders were of mixed ability and experience (10.6 ± 3.7 years, riding); however, all were capable of completing a Pre-Novice level ODE. Only six subjects had previously competed at this standard under British Eventing affiliation. Prior to the test, all the subjects were informed of the aims and the essential characteristics of the investigation. Informed consent was obtained in accordance with the guidelines established by the University of Essex, Biological Sciences Department. Anthropometric data were collected from each subject including height, weight, skinfolds, girths, bone lengths and breadths, as indicated in the ISAK (International Society for the Advancement of Kinanthropometry) level II anthropometry procedure. Individual measurements were repeated three times, and the mean for each measurement was calculated. The data were entered into LifeSize software (University of South Australia) for further analysis.
Protocol
Each subject was required to complete a simulated ODE held at Writtle College Equine Training and Development Centre. The ODE was designed to mimic a British Horse Trials Association (BHTA) Pre-Novice competition, comprising DR, SJ and XC phases. The DR test used was Horse Trials 112, and was performed in an indoor riding arena measuring 20 × 40 m. The SJ course was performed in an outdoor manège, which measured 25 × 65 m and consisted of nine jumping efforts and measured 370 m. The showjumps ranged between 0.95 and 1.0 m in height. The XC course consisted of 19 jumping efforts and measured 1553 m in length. The maximum height of the XC fences was 1.00 m. All three phases were designed using the BHTA guidelines and rule book. Each rider rode a horse that she was familiar with and that was considered capable of competing in all three phases. The subjects were asked to warm up the horse for each phase as they would at a competition, before commencing each phase. All subjects were required to wear appropriate back protection throughout the SJ and XC phases. The time taken to complete each individual phase was recorded using a handheld stopwatch.
Gas analysis
Measurement of oxygen uptake, carbon dioxide output and RER (respiratory exchange ratio) was done using the Metamax 3B (MMX3B 1.0, Leipzig, Germany) analyser continuously throughout all three phases of the ODE. The subjects wore a small face mask, which enabled them to breathe through a volume transducer fixed to the face mask. The battery was connected to the Metamax 3B to allow self-contained measurements to be taken during the exercise protocol. The Metamax 3B was secured to the subjects using the Maxbelt (velcro scarf to hold the Metamax in place) to prevent excessive movement while riding exercise took place. After fitting of the Metamax 3B system was complete, data collection commenced prior to the rider mounting the horse. A marker was used to identify precisely the start and end point of each phase. The equipment was calibrated before and after recordings on each rider according to the manufacturer's instructions, using air (20.95% O2 and 0% CO2) and a certified gas mixture (approximately 18% O2 and 3% CO2).
The gas parameters and RER estimates were collected and calculated as mean values for each 10 s. All the data that were recorded were stored in the internal data logger for subsequent downloading into the personal computer. Mean VO2 for each subject throughout each phase was calculated, together with the overall mean for all the subjects for each phase of the event. The average O2 uptake (l min− 1) was calculated for every 10 s for all subjects during each phase of the ODE. Mean energy expenditure (kcal min− 1) for each phase was calculated using the following formula: kcal = VO2 (l min− 1) × RER calorific equivalent (kcal l− 1). %VO2max was calculated as described previouslyReference Meyers and Sterling12.
Heart rate
HR was recorded throughout the three phases of the ODE using a Polar Vantage NV HR monitor (Kempele, Finland) in a 5-s averaging mode. A saline solution was used to improve the conductivity between the skin and the electrodes. Markers were entered into the watch corresponding to the start and end of each phase. Maximal HR was estimated from the equation (220 – age) in order to calculate relative workloads (%HRmax).
Lactate
Blood lactate concentrations ([LA]b) were determined using an Analox P-GM7 lactate analyzer (Analox Instruments, London, UK) calibrated according to the manufacturer's instructions using an 8 mmol l− 1 calibration solution and a quality control solution in the range 2.3–2.7 mmol l− 1. The CV (coefficient of variation) for this equipment on capillary blood has been reported to be 7%Reference Godfrey, Whyte, Buckley and Quinlivan14. Capillary blood lactate measurements were taken at rest and at 1 min after all three disciplines. The puncture site (finger tip) was disinfected using an alcohol-impregnated swab. A sterile automatic lancet was used to puncture the finger tip, and the needle was disposed off hygienically after each use. The first drop of blood was discarded, and the second drop was collected using a Heparinised Capillary/Lysing Microtubule Blood Collection System (GMRD-070; Analox Instruments). Each individual microtube was immediately stored at below 0°C in preparation for analysis.
Urine testing
The Osmomat 030 (Gonotec, Germany) was used to determine the total osmolality of the subject's urine immediately before and after the event. Each subject was asked to collect the urine midstream, and samples were sealed and refrigerated until analysis was undertaken. Prior to testing urine, the Osmomat 030 was calibrated using 50 μl distilled water followed by a second calibration using 50 μl calibration solution. In order to check measurement reproducibility, two measuring vessels were filled (50 μl) with the same sample solution and measured sequentially. The reported intra- and inter-assay CVs for urine from female subjects for this equipment when used according to the manufacturer's instructions have been reported to be 1.5%Reference MacLeod and Sunderland15).
Strength testing
A handheld dynamometer was used to obtain hand grip strength immediately before the DR phase and 1 min after the XC phase. While seated, subjects were asked to hold the dynamometer in the right hand with a straight arm above their head and grip the handle as hard as possible while lowering their arm down their side.
Weight measurement
The weight (kg) of each equestrian rider was obtained before and after the event using a digital portable weighing machine. Subjects were asked to remove their clothes and towel dry before the weight measurement was taken.
Data analyses
All VO2, HR, blood lactate, urine osmolality and strength values are expressed as mean and standard deviation ( ± SD). Statistical analysis was performed using Statistical Package for Social Science (SPSS) for Windows version 10.0. A one-factor within-subjects ANOVA was used to determine significant difference between mean and peak VO2 and HR and mean post-exercise blood lactate concentrations between the three phases of the event. Post hoc differences were tested by paired samples t-test. The Bonferroni procedure was used to calculate the acceptable level of significance. A paired t-test was also used to investigate differences between pre- and post-urine osmolality and hand grip strength.
Results
General
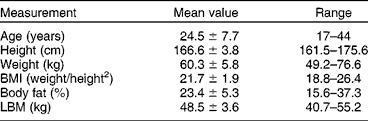
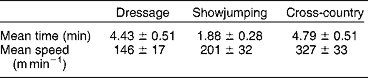
The physical and other characteristics of the riders are presented in Table 1. All 16 female riders who took part in the study successfully completed all three phases of the event. The mean times and speeds to complete each phase are presented in Table 2.
Mean (±SD) and range for anthropometric values and body composition of 16 female equestrian athletes (n=16)

BMI, body mass index; LBM, lean body mass.
Mean time (±SD) and speed of the three phases of the one-day event (n=16)

Oxygen uptake
Mean and peak oxygen consumption is presented in Table 3, and increased progressively with each phase from DR to SJ to XC. The XC phase produced the highest mean estimated %VO2max of 93 ± 19 in comparison with the SJ phase (83 ± 12%VO2max) and DR phase (60 ± 12%VO2max).
Mean (±SD) and peak O2 consumption for each phase of the one-day event (n=16)

i Mean oxygen uptake was significantly different among phases (P < 0.001).
ii Peak oxygen uptake was significantly different among phases (P < 0.001).
Heart rate
A trend for HR that was similar to that for oxygen uptake was observed. The XC phase produced the highest mean (184 ± 11 bpm) and peak (190 ± 11 bpm) HR, followed by the SJ phase (mean 180 ± 11 bpm; peak 188 ± 11), with the DR phase producing the lowest mean (157 ± 15 bpm) and peak (172 ± 15 bpm) HR. Mean and peak HR were significantly different for each phase (ANOVA P < 0.001).
Energy expenditure
During the event the DR phase required the lowest estimated energy expenditure, which was significantly lower during the DR phase (5.9 ± 1.0 kcal min− 1; P < 0.01) than during the SJ and XC phases (8.2 ± 1.1 and 8.5 ± 1.1 kcal min− 1, respectively). Mean total energy expenditure required for each phase was estimated to be 31.1, 15.4 and 41.0 for the DR, SJ and XC phases, respectively.
Lactate concentration
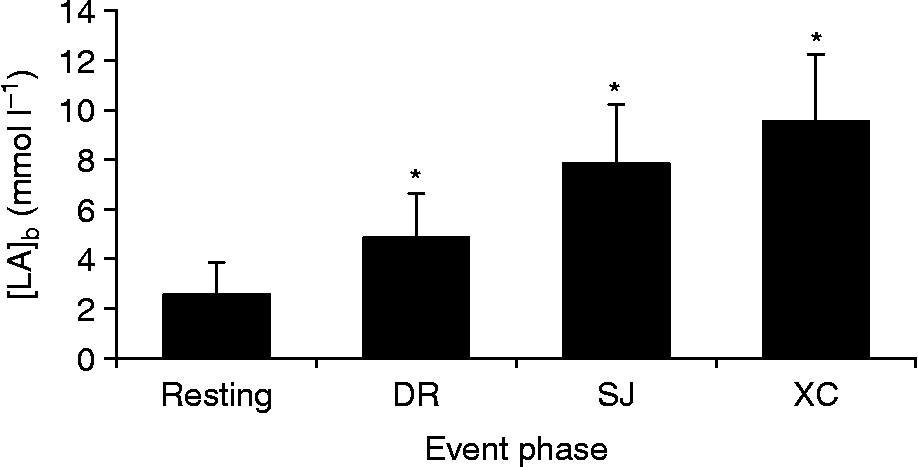
Blood lactate concentration increased progressively over each phase of the competition (Fig. 1), reaching a mean of 9.5 ± 2.7 mmol l− 1.
Mean ( ± SD) blood lactate concentration for each phase of competition (n = 16). DR, dressage; SJ, showjumping; XC, cross-country. * Significantly different from resting (P < 0.001).

Urine analysis
A significant increase (29%) was observed in mean urine osmolality following the XC phase (0.684 ± 0.23 mOsmol) compared with pre-competition (0.488 ± 0.27 mOsmol; P < 0.001).
Hand strength
Mean hand grip strength decreased significantly post-competition (29.8 ± 5.5 kg) compared with pre-competition (32.3 ± 6.3 kg; P < 0.001).
Body mass
Mean body mass change during the competition was 1.0 ± 0.8 kg (P < 0.01), and ranged from 0.0 to 3.5 kg. This represented a percentage body mass change of 1.6 ± 1.1%.
Discussion
The purpose of this study was to quantify the physiological responses of female equestrian athletes in order to provide a greater insight into the demands of eventing and to compare the results with similar studies and other sporting athletes. This study also highlighted variability in the riders' metabolic cost according to the phase being performed.
The anthropometric data suggest that the mean % body fat of the subjects in the current study fell within the average category, as described by Morrow et al. Reference Morrow, Jackson, Disch and Mood16. However, in comparison with the results reported by Meyers and SterlingReference Meyers and Sterling12, the subjects in the present study had a lower %body fat than other equestrian athletes. The mean %body fat in this study was higher than the reported values for female athletes competing in other sports events such as swimming (10–18%BF), tennis (10–20%BF), sprinting (19.3%BF), cross-country skiing (10–18%BF) and distance running (15.2–19.2%BF). However, values were within the range for female volleyball players (21.3–25.3%BF), but lower than the values reported for female shot-put players (28.0%BF)Reference Powers and Howley17. A high %BF in athletes has been shown to have a negative effect on the health of the individual, and to decrease the performance in many sports that require endurance, flexibility and agilityReference Wilmore and Costill18, qualities that have been highlighted as essential attributes for equestrian athletes7. Subject 7 was observed to have the highest %BF (37.3) and, interestingly, was recorded to have the highest HR values in all three phases. The reported relatively high %BF values in the current study observed among the equestrian athletes highlight concerns regarding the lack of physical conditioning of the subjects who took part in the trial when compared with the established norms in other sports.
Mean BMI of the subjects in the present study was within the desirable range of 20.0–24.919, and was observed to be similar to the BMI of other female equestrian athletes (24.8 ± 1.7) reported by Meyers and SterlingReference Meyers and Sterling12. The mean LBM of the subjects was similar to that reported in collegiate equestrian athletes (49.0 ± 4.5 kgReference Meyers and Sterling12).
Devienne and GuezennecReference Devienne and Guezennec13 reported that as pace progressed from walk through trot and to canter, so too did the energy demand and therefore oxygen consumption.
The high HR and high estimated %VO2max (>90%) indicate that the ODE required a high cardiovascular effort. A potential limitation of this study is that while both HR and oxygen consumption were measured, VO2max was only estimated. While on a population basis this is appropriate, it could lead to considerable error when looking at the response of individual riders. It has been reported that continuous physical exercise at 60–70% VO2max for several 30-min sessions per week enhances aerobic capacity.
The energy expended by the equestrian athletes during the DR phase was observed to be similar to that expended by female athletes cycling at 16.1 km h− 1 and was comparable to that expended during sports such as walking (3.9 kcal min− 1) and tennis (5.5 kcal min− 1)Reference Wilmore and Costill18. The rates of energy expenditure during the SJ and XC phases were comparable to those observed during female sporting activities such as basketball (6.8 kcal min− 1), weightlifting (6.4 kcal min− 1) and wrestling (10.3 kcal min− 1)Reference Wilmore and Costill18. However, the riders canter and jump for only a small part of a normal training session, with the majority probably consisting of walking and trotting. Although limited time is generally spent in the jumping phase during training, which subsequently minimises the training response, riding at this intensity is reported to be at a metabolic cost capable of producing a general fitness level similar to that produced by aerobics or gymnasticsReference Devienne and Guezennec13.
During the event, the [LA]b increased progressively during the three phases. The results are in agreement with the work of Gutiérrez Rincón et al. Reference Gutiérrez Rincón, Vives Turcó, Muro Martinez and Casas Vaqué9, who reported blood lactates of 5.0–6.3 mmol l− 1 during SJ competition, and are also comparable with the findings of Trowbridge et al. Reference Trowbridge, Cotterill and Crofts11, who found a mean [LA]b of 7.1 mmol l− 1 in jockeys following National Hunt Racing.
The higher physiologic demands of the SJ and XC phases may be due to the forward position adopted over and between the fences, which requires strength and good muscle control in the legs, back and arms. Also body movement, to absorb movement of the horse, particularly over fences when the position is modified to remain in balance with the horse, and the actions of the legs and arms in giving aids to the horse are similar in many ways to National Hunt Race ridingReference Trowbridge, Cotterill and Crofts11. Riding position during the DR phase differs from that during the SJ and XC phases as the riders tend to sit more upright, with their weight supported by the horse's back rather than by the rider's legs. This may contribute to the lower physiological demand than in the two jumping phases.
The blood lactate values at the end of the SJ phase are similar to those in the 110 m hurdles (7.0 mmol l− 1; Beaulieu et al., 1995) and in rugby players (5.8–9.8 mmol l− 1)Reference McLean20, whereas concentrations following the XC phase are similar to those following a 100 m sprint (12.1 mmol l− 1; Beaulieu et al., 1995) and speed-skating (9.8 mmol l− 1)Reference Rundell21.
Mean urine osmolality increased significantly after the completion of the event. Although still within acceptable limits, the osmolality values reported indicate that the riders became dehydrated during the ODE. Dehydration may invoke physiological responses such as the redistribution of body fluids, with changes in hydrostatic and osmotic pressure. The gradual onset of dehydration may have implications for the rider who has multiple horses to be ridden or competing on the same day. In addition to the actual time spent in the saddle, the rider will be required to prepare the horse, and walk the SJ and XC course (sometimes twice), which all add to the metabolic cost of the event. Mean fluid loss corresponding to 1.6 ± 1.1% BW was observed in the current study. Armstrong et al. Reference Armstrong, Herrera Soto, Hacker, Casa, Kavouas and Maresh22 reported that a reduction in body mass by 1.5–2.0% results in a decrease in performance by up to 6.3%. Two subjects lost 2.5 and 4.6% body mass, respectively, throughout the competition. Nielsen et al. Reference Nielsen, Kubica, Bonnesen, Rasmussen, Stoklosa and Wilk23 found that weight loss of this extent resulted in a 45% decrease in the capacity to perform high-intensity exercise lasting about 7 min. This may cause a lack of ability of the rider to concentrate and help a tired horse towards the end of the XC phase, and could be a potential contributing factor in the occurrence of accidents.
A mean decrease in strength was observed after the three phases of the ODE, suggesting a degree of fatigue post competition. A lack of strength may have implications for the rider who has several horses to ride at one event, and may cause a reduction in his/her effectiveness on subsequent horses if time to recover in between phases or rides is insufficient. Therefore, it may also be appropriate for riders to introduce strength training into their aerobic conditioning programme to reduce the onset of fatigue during training or competition riding.
In conclusion, the study emphasises the variability in metabolic cost between riders performing in the same simulated competition but riding different horses. There is also a difference in metabolic demand between the different phases. The data support a requirement for equestrian athletes to undertake supplemental training, in addition to riding to increase strength and aerobic fitness.