Introduction
Global energy inequality, climate change, altered carbon cycle, and fossil fuel depletion are the major driving forces for researchers and scientists to direct their attention toward replacing carbon-intensive fuels with renewable energy sources. Solar energy is clean and abundantly available renewable energy, to earth receiving nearly 2 kW/h.[ Reference Song 1 ] However, fabrication of solar cells or solar-storage devices is often associated with the high costs and low conversion efficiencies, which are the main limitations for scaling up this technology. Hence, in the present scenario, efficient and cost-effective conversion of solar energy into an electricity and fuel is the real challenge.[ Reference Alharbi and Kais 2 ]
Among all the photoactive materials, titanium dioxide (TiO2) is the most widely used photocatalyst due to its optoelectronic properties, stability, low cost, and non-toxicity.[ Reference Resasco, Zhang, Kornienko, Becknell, Lee, Guo, Briseno and Yang 3 – Reference Yang, Yin, Shen, Yang, Li, Han, Jiang and Zhao 5 ] However, its large band gap (3.2 eV) and high rate of electron–hole recombination limit its efficiency only up to the ultraviolet (UV) light region.[ Reference Mendizabal, Mera-Adasme, Xu and Sundholm 6 ] Recently, composites of carbon materials [carbon nanotubes, graphene, and graphene quantum dots (GQDs)] with TiO2 are attracting significant attention in this area, because these systems harvest a broad spectrum of solar light and exhibit fast charge separation as compared with pristine TiO2.[ Reference Jiang, Zhang, Ji, Wang, Zhao, Fu and Yin 7 – Reference Tian, Shen, Hu, Qiao and Zheng 10 ] Compared with two-dimensional graphene–nonosheets and one-dimensional nanoribbons, zero-dimensional GQDs have discrete electronic levels, allowing for hot electron injection and efficient charge separation. In addition to that, GQD extended π-electron systems can be put in direct contact with a TiO2 surface, facilitating the donor–acceptor contact.[ Reference Pan, Jiao, Li, Guo, Feng, Liu, Wang and Wu 11 – Reference Fernando, Sahu, Liu, Lewis, Guliants, Jafariyan, Wang, Bunker and Sun 14 ] Therefore, in the present study, coupling GQDs with TiO2 has been attempted to improve the charge-separation and visible light absorption of the TiO2.
The present paper reports the synthesis of GQDs using a very inexpensive and easily available bird charcoal as starting material. It is already reported that it will be easier to get size-controlled synthesis of GQDs if the starting material already has small domain structure of sp 2 carbons.Reference Peng, Gao, Gupta, Liu, Romero-Aburto, Ge, Song, Alemany, Zhan, Gao, Vithayathil, Kaipparettu, Marti, Hayashi, Zhu and Ajayan 15 Accordingly bird charcoal has much smaller crystalline domains with disordered configuration which confers the advantages such as easy dispersion, exfoliation, functionalization, and chemical cutting over the other precursors such as graphene.Reference Ye, Xiang, Lin, Peng, Huang, Yan, Cook, Samuel, Hwang, Ruan, Ceriotti, Rajji, Marti and Tour 16 The synthesis has been carried out at different temperatures, e.g. 85, 100, and 115 °C resulting into the formation of different sized GQDs. This allows a greater degree of control of synthesis method over the particle size and related properties of GQDs. The obtained GQDs have high luminescence and enhanced visible light absorption. Different wt% of synthesized GQDs (0–5%) are further coupled with the TiO2 to form TiO2–GQDs composites samples. These composites showed remarkable photocatalytic activity by degradation of Methylene blue compared with pure TiO2 implying their considerable potential in energy conversion. The plausible mechanism for the improvement in the photocatalytic performance has also been proposed and discussed based on different experimental results such as atomic force microscope (AFM), transmission electron microscopy (TEM), UV–Vis spectroscopy, and photoluminescence (PL). An optimum concentration of GQDs responsible for highest degradation rates has also been investigated.
Materials and methods
Bird charcoal, the starting material for GQD synthesis, was obtained from Eight-in-One Pet Products Co. Ltd. (Islandia, NY). Concentrated sulfuric acid (98% H2SO4), concentrated nitric acid (70% HNO3) was purchased from Thermo Fisher Scientific (San Jose, CA). White pellets of Sodium hydroxide were acquired from Fisher Scientific (Pittsburg, PA). TiO2 nanoparticles (anatase, 99+%, 10–25 nm) for making composite with GQD were procured from US Research Nanomaterials, Inc (Houston, TX). Methylene blue was purchased from Sigma-Aldrich (St. Louis, MO).
Synthesis of GQDs and GQD–TiO2 composites
GQDs were synthesized by using a bird charcoal as a precursor.[ Reference Peng, Gao, Gupta, Liu, Romero-Aburto, Ge, Song, Alemany, Zhan, Gao, Vithayathil, Kaipparettu, Marti, Hayashi, Zhu and Ajayan 15 , Reference Ye, Xiang, Lin, Peng, Huang, Yan, Cook, Samuel, Hwang, Ruan, Ceriotti, Rajji, Marti and Tour 16 ] Initially, 300 mg of bird charcoal was sonicated for 2 h in a mixture of 60 ml of 98% concentrated sulfuric acid and 20 ml of 70% concentrated nitric acid. This addition of acids enabled breakdown of bonds in the charcoal. The mixture thus formed, was left for heat treatment in hot paraffin oil for 24 h. The temperature of hot oil was varied from 85, 100 °C, to 115 °C. Obtained mixture was cooled to room temperature for 30 min. Once at room temperature, the mixture was poured into a beaker containing 100 ml ice, to which 3 M NaOH was added for bringing pH of the mixture to 7. The addition of NaOH was carried out in ice bath to avoid heat generation during exothermic reaction. The obtained neutral mixture was filtered through a 0.45 mm PTFE syringe filter membrane. The filtrate collected was dialyzed for consecutive 5 days using 1000 Da dialysis bag. The purified sample obtained was concentrated using rotary evaporator. The concentrated GQDs dispersed in DI water were stored in refrigerator at a temperature of about 4 °C or below in order to fully preserve the optical properties of GQDs. The GQDs synthesized at 85, 100 and 115 °C are abbreviated as GQD-85, GQD-100, and GQD-115 in further text.
GQD–TiO2 composite was formed by adding different concentrations of synthesized GQDs (0.5, 1, 2.5, and 5.0 wt%) to a fixed amount of TiO2 as described by Lee et al.[ Reference Lee, Kim, Park, Cha, Yoon, Jeon, Min, Swihart, Jin, Deyab and Yoon 17 ] The mixture thus formed is then subjected to sonication for 1 h. These suspensions are then used for photocatalytic degradation reactions.
Characterization
The TEM imaging of the GQDs was performed at the NASA AMES facility using Hitachi H-9500 System (operating voltage of the system was 300 kV). GQD sample was drop casted on to Lacey Carbon films having a woven-mesh-like pattern. The sample was then allowed to dry for 30 min at room temperature and then viewed under the microscope.
AFM topography imaging of GQD was performed using model 5500 Keysight Scanning Probe Microscope (SPM) in SJSU (San Jose). A few droplets of the GQD solution were placed onto a mica substrate of 1 cm diameter so as to form three to four layered films and allowed to air dry. Composite solutions of different concentration were spin coated onto the mica substrates. The height profile of the GQDs was obtained from the AFM topography images with a magnification of about 2 µm or more. The absorption spectra of synthesized GQDs and Composite samples were obtained using Agilent 8453 UV–visible Spectrophotometer (BME lab SJSU, San Jose). PL spectra of the solid samples were recorded at room temperature by using Maestro in vivo optical imaging system (CRI Inc., Woburn, MA). The spectra were recorded at different ranges of excitation wavelengths, e.g. blue range (445–490 nm), green range (503–555 nm), yellow range (575–605 nm), and red range (605–665 nm).
The photocatalytic activities of all the composite samples were tested by studying the degradation reaction of Methylene Blue by UV light (340 nm, 50 mJ). About 50 ml of aqueous solution of dye (0.0002 M) with 50 mg of catalysts were used for photolysis experiments. Prior to photoreaction, the suspensions were magnetically stirred in a dark condition for 1 h to establish adsorption/desorption equilibrium. About 2 ml of aliquots were sampled at regular time intervals, centrifuged to remove particles, and analyzed by recording the absorption spectra of Methylene Blue.
Results and discussion
Morphological analysis
TEM analysis
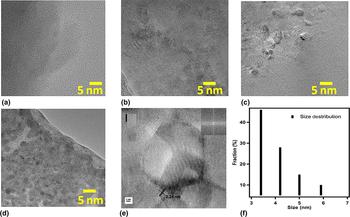
The morphologies of GQDs were investigated by TEM and AFM. The typical TEM images of GQDs are shown in Fig. 1. Figure 1(a) illustrates the simplified nanostructure of bird charcoal before any heat treatment. Figure 1(b)–(d) represent the GQDs sample synthesized at 85, 100 and 115° C, respectively. These images revealed that the density of GQDs formed in the solution increased with an increase in the temperature of the synthesis. GQD-115 [Fig. 1(d)] indicates uniformly dispersed GQDs of an average size of 3–4 nm [Fig. 1(f)]. Figure 1(e) is the high-resolution transmission electron microscopic (HRTEM) image of GQD-115 with an in-plane (0–110) lattice spacing of about 0.24 nm, emphasize high crystallinity.[ Reference Gobi, Vijaykumar, Keles and Erogbogbo 18 , Reference Yuan, Sun, Yan, Xie, Chen and Zhou 19 ]
TEM images (a) simplified illustrative nanostructure of bird charcoal, (b) GQD-85, (c) GQD-100, (d) GQD-115, (e) the HRTEM images of GQD-115 with measured lattice spacing and edge structures at 1 nm, and (f) lateral size distribution of the GQDs-115.

AFM analysis
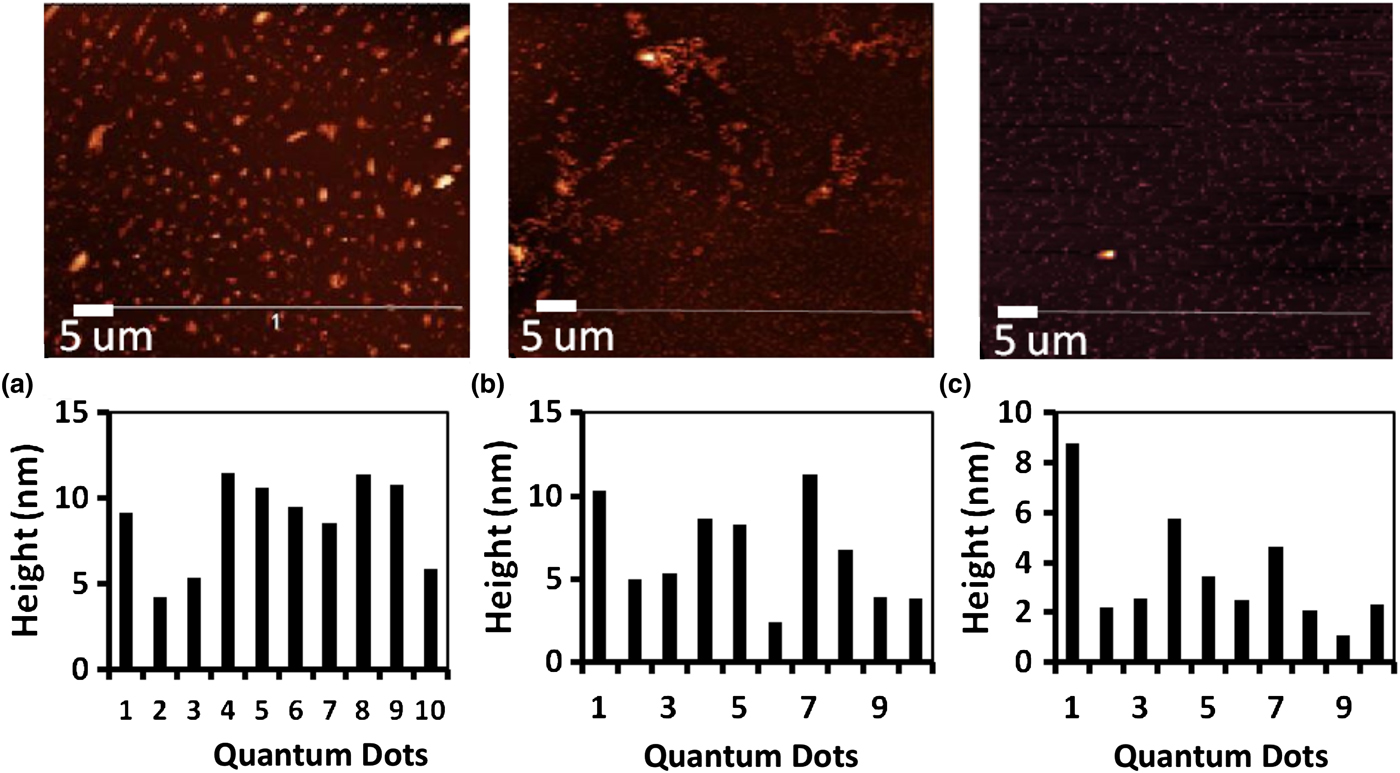
Further to study the microstructural insights of the GQDs samples, AFM analysis has been carried out. Figure 2(a)–(c) present the AFM images of GQD-85, GQD-100, and GQD-115 samples and their particle size distributions.
AFM images of GQDs and their size-distribution histograms of (a) GQD-85, (b) GQD-100, and (c) GQD-115.
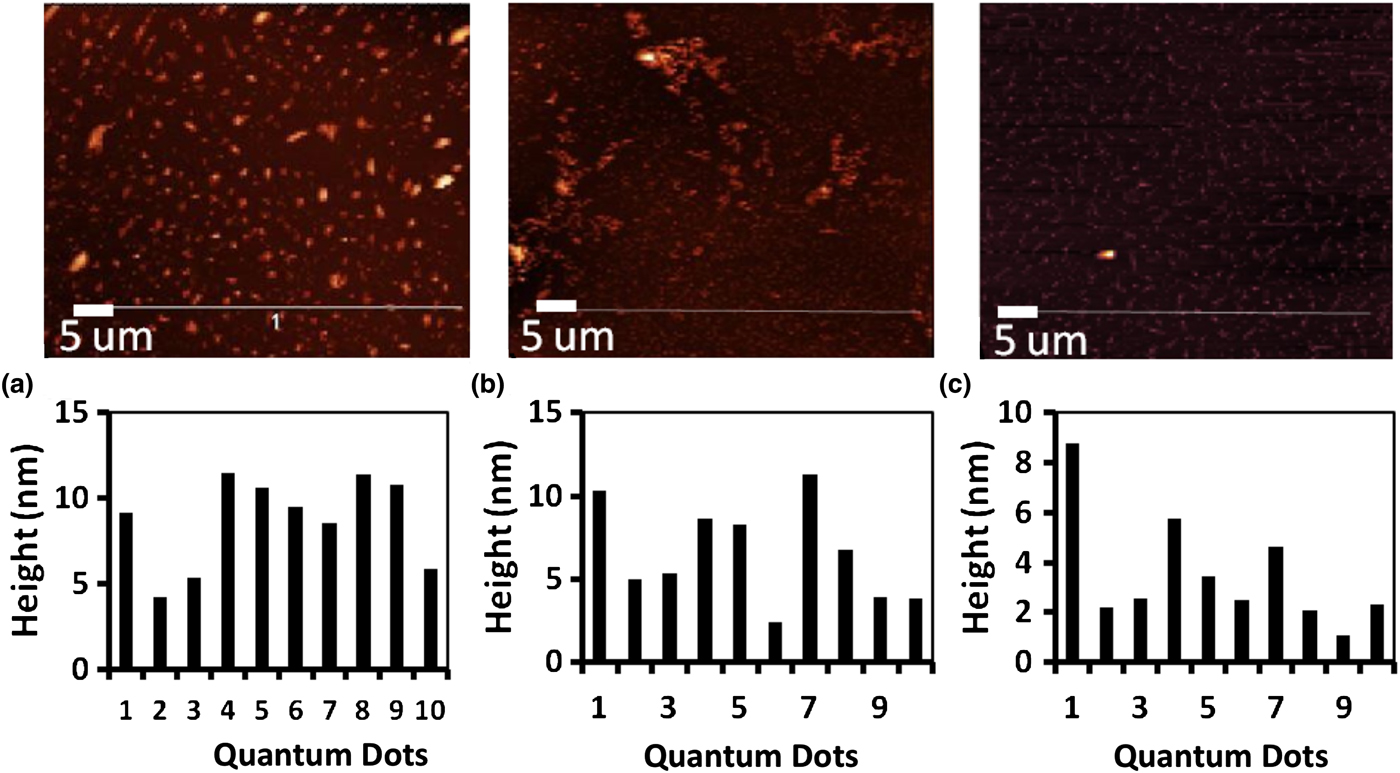
The bright spots in the AFM images indicate the presence of nanosized GQDs. The line profile measurements for this sample were obtained using Gwyddion software tool. This analysis shows that GQD-85 [Fig. 2(a)] sample has an average height of 8.7 nm corresponding to four or five layers. The result is based on the height measurements taken at multiple locations covering the entire topography image range. A similar size characterization steps were performed on GQD-85 and GQD-100 samples and their average heights are observed to be 6.5 and 3.6 nm [Fig. 2(b) and (c)]. This clearly shows a pattern of a decrease in average height with an increase in temperature of synthesis thus confirming the effect of heating temperature on controlling the size of GQDs.
In this work, during the synthesis of the GQDs, the bird charcoal is treated with concentrated sulfuric and nitric acid. This acid treatment cut the graphite sheets into fragments. When these fragments are further heated in paraffin oil at 85, 100, and 115°C, the fragments disintegrate to form GQDs. The reverse correlation between the particle size and temperature basically indicates that disintegration of graphite is higher at increased temperature.[ Reference Xie, Lai and Huq 20 ]
SEM analysis
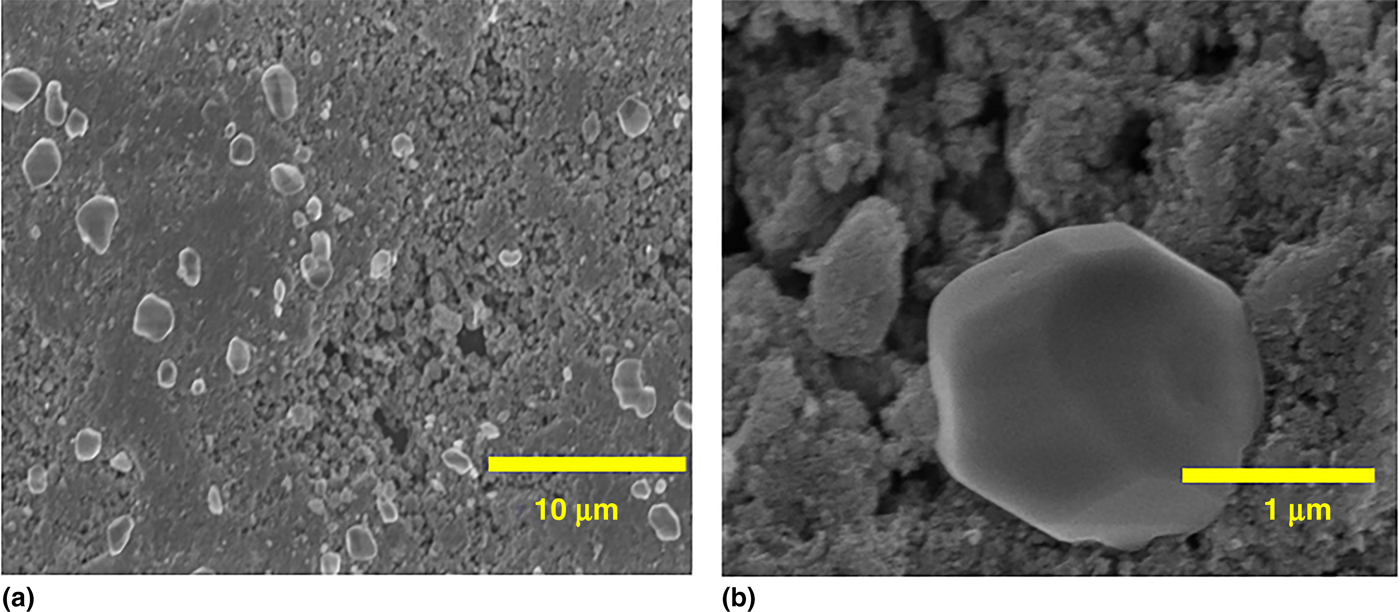
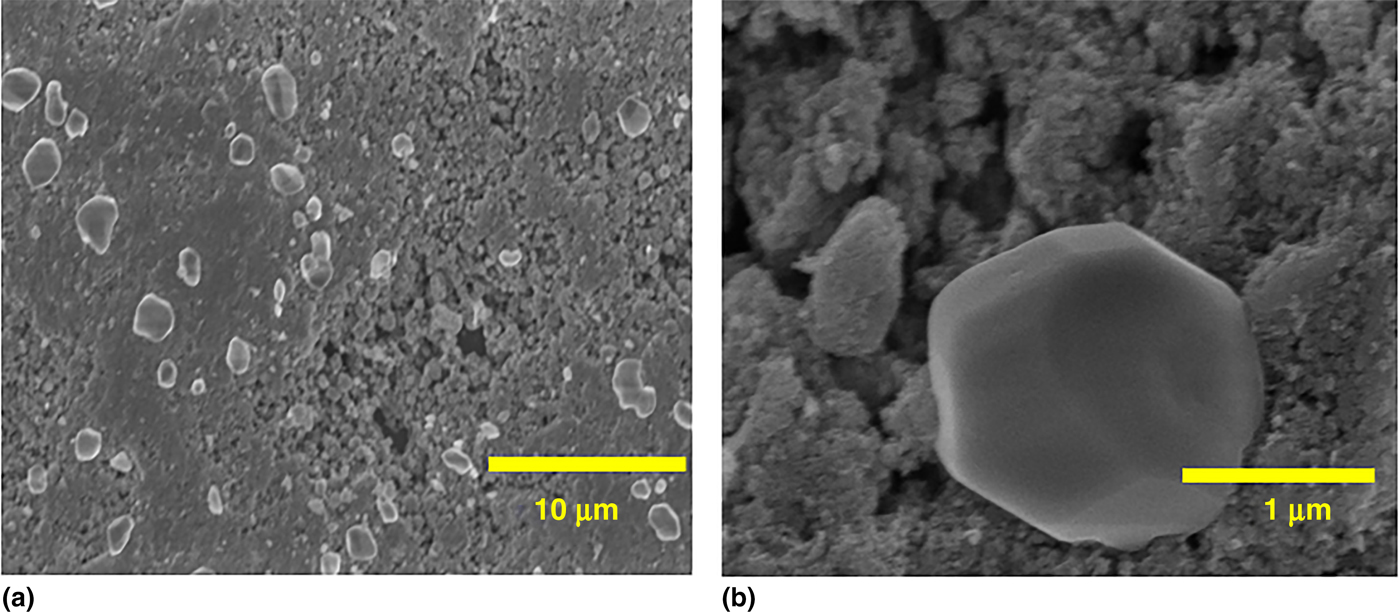
From the synthesized GQDs, GQD-100 have been chosen to couple with TiO2. Accordingly, different wt% of GQD-100 (0%, 0.5%, 1%, 2.5%, and 5%) was mixed with the TiO2 to form GQD–TiO2 composites. The SEM images GQD–TiO2 composites are shown in Fig. 3. At lowest magnification [Fig. 3(a)], uniform dispersion of TiO2 particles in GQDs nanoparticles can be observed. At the magnification of 1 um [Fig. 3(b)], It can be noted that the TiO2 nanoparticles fused together to form comparatively larger agglomerates.[ Reference Pan, Jiao, Li, Guo, Feng, Liu, Wang and Wu 11 ]. Figure 3(b) clearly indicates the larger sized TiO2 agglomerate having close contact with GQDs generating TiO2–GQD heterojunctions.
SEM images of GQD–TiO2 composites samples at (a) 100 μm and (b) 1 µm magnification.
Optical analysis
UV–Vis spectroscopy
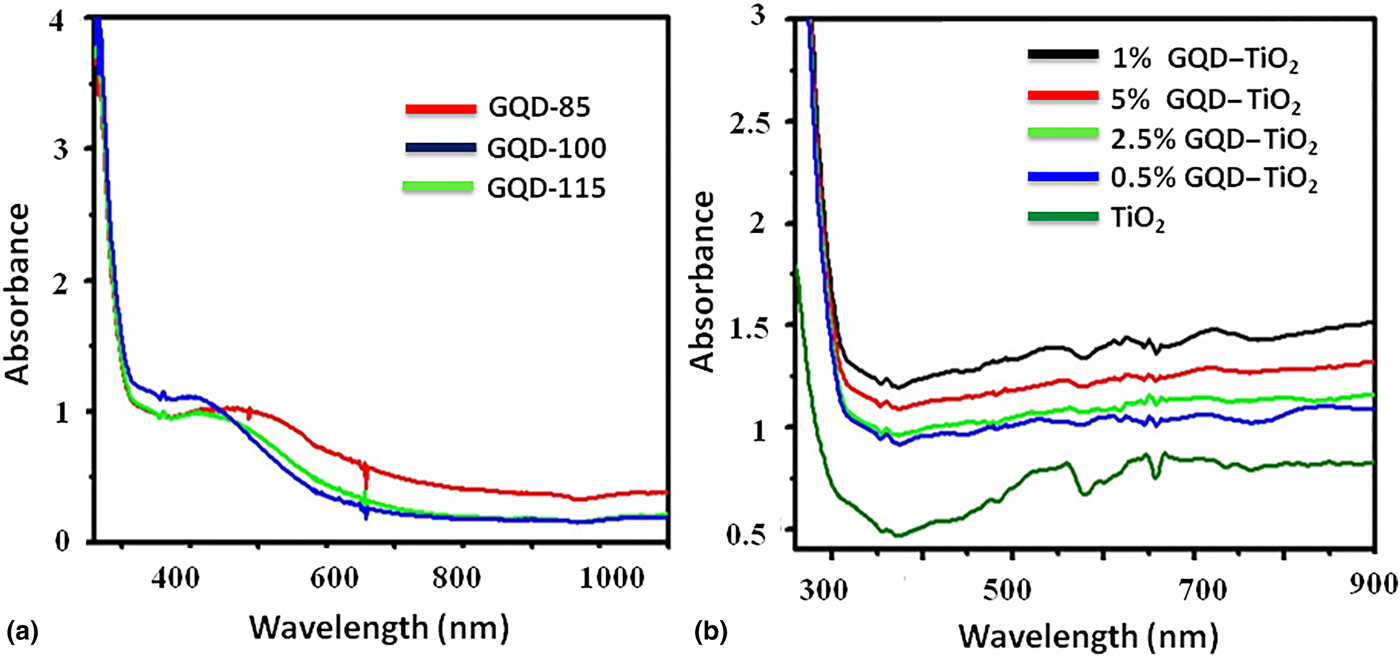
The UV–Vis spectra of all GQDs and GQD–TiO2 composite samples are shown in Fig. 4(a) and (b), respectively. Figure 4(a) shows the UV–Vis absorption spectra of GQD-85, GQD-100, and GQD-115 samples. The spectra of all the samples display a strong absorption in the UV region with the tail of the absorption band extending to the visible range of the electromagnetic spectrum.
UV–visible spectra of (a) GQDs samples and (b) GQD–TiO2 composite samples.
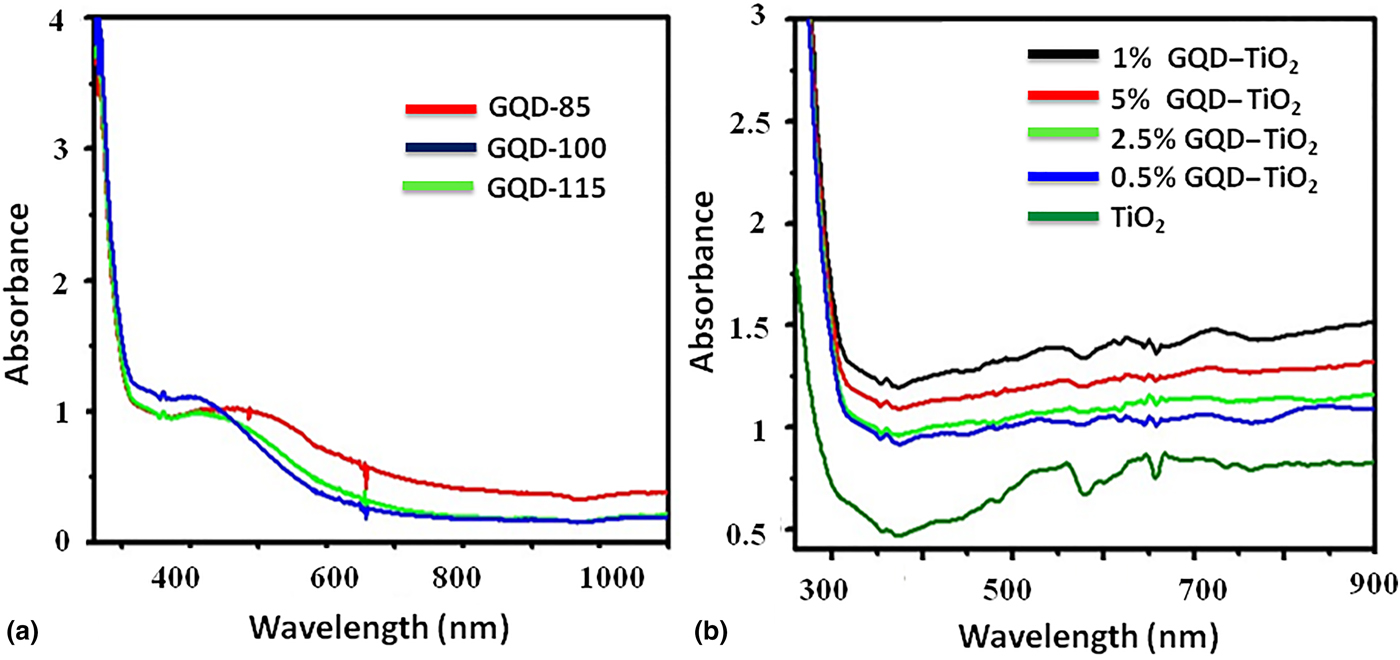
Generally, GQDs sample shows two peaks in the UV region (at 280 and 320 nm) out of which 280 nm peak is assigned to the π–π* transition of aromatic sp 2 domains.[ Reference Gobi, Vijaykumar, Keles and Erogbogbo 18 , Reference Fan, Zeng, Tang, Yuan, Tong, Cai, Liu, Huang, Min and Epstein 21 ] The apparent peak at 335 nm indicates the major uniform size of the sp 2 clusters in the GQDs even though these sp 2 clusters are doped in the sp 3 matrix.[ Reference Lin, Ron, Lu, Song, Zhong, Yan, Wang and Chen 22 ] In our case, all GQD samples show an identical peak at 280 nm. However, the peak at 320 nm appears to be red-shifted especially in the GQD-85 sample. This red shift is attributed to the size differences of the GQD samples. According to the Zhang et al. UV–Vis Spectra exhibits red shift as increasing the particle size.[ Reference Zhang, Liu, Wang, Xin, Liu, Guo and Zhang 23 ] Accordingly, a red shift has been observed in GQD-85 and GQD-100 samples having larger GQD size than the GQD-115 sample.
The UV–Vis spectra of all GQD–TiO2 composite samples are shown in Fig. 4(b). The pure TiO2 spectrum shows characteristic cut-off wavelength at ~384 nm. As compared with TiO2, composites samples show a significant red shift from 384 to ~450 nm in its absorption edge with increasing the wt% of GQDs. In addition to that, the intensity of all composite spectra appears to be higher than the TiO2 sample. This indicates that the incorporation of GQDs not only reduce the band gap of TiO2 but also increase the visible light absorption of TiO2.[ Reference Shen, Xue, Wang, Hu, Tian and Zheng 24 ] One percent GQD–TiO2 sample shows the maximum red shift and highest intensity, which may be due to the highest visible light absorption amongst the composite samples.
PL spectroscopy
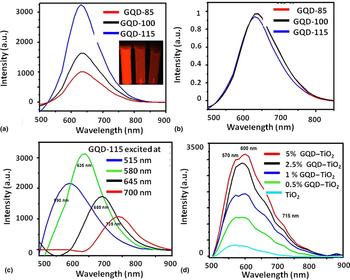
The optical properties of GQDs were further investigated by their PL spectra displayed in Fig. 5. As can be noted from Fig. 5(a), all GQDs exhibit strong emission spectra at ~635 nm for an excitation range of 580 nm. The full-width at half-maximum (FWHM) appears to be about 100 nm, which is a common value of carbon-based quantum dots.[ Reference Kim, Seo, Park, Song, Meng and Heller 25 ] Overall, under the same excitation wavelength, different sized GQDs shows emission peak at the same wavelength. Figure 5(b) is obtained after normalizing the spectra in Fig. 5(a). It can be noted from Fig. 5(b) that there is no significant shift in the emission wavelength of these GQDs samples. Moreover, the inset of Fig. 5(a) also depicts only red PL for a different sized GQDs solution under UV light. This indicates the size-independent PL behavior of the GQDs. This can be attributed to the conjugated aromatic domains (isolated sp 2 clusters) exist on the GQDs. According to the literature, small conjugated domains with various sizes (about 1–5 nm) coexisted as single particles which are physically connected to the GQDs. Although the sizes of the GQDs are different, the sizes of the sp 2 clusters might remain similar. Therefore, the light of a certain wavelength only excited sp 2 clusters with specific sizes, regardless of other components, leading to the size-independent PL.[ Reference Dong, Shao, Chen, Li, Wang, Chi, Lin and Chen 26 ]
PL spectra of (a) GQD samples excited at 580 nm, (b) normalized spectra of GQDs sample excited at 580 nm, (c) GQD-115 sample at the various excitation wavelength, and (d) GQD–TiO2 composites.

The size-independence of the individual GQDs might imply that the PL of GQDs is mainly influenced by continuous defect states. These defects states are often associated with the oxygen-related groups (–COOH, –OH, and C–O–C) and sp 2/sp 3 hybridized carbon atoms in the GQDs. Hence, larger GQD size may correspond to the larger no. of defect states or trapped states, which mainly facilitates non-radiative recombination of the electron–hole pairs. Accordingly, in this case, GQD-85 shows the lowest PL intensity which is attributed to the non-radiative decay occurring in the trapped states.[ Reference Gan, Xu and Hao 27 ]
Fig. 5(c) shows the PL spectra of GQD-115 acquired at different excitation wavelengths. As the excitation wavelength increases from 515 to 700 nm, the PL peaks red shifted from 590 to 735 nm elucidating the excitation-dependent PL behavior of GQDs.[ Reference Teng, Nguyen, Yeh, Lee, Chen and Teng 28 , Reference Kumar, Thupakula, Kanti Sarkar and Acharya 29 ] Such emissive behaviors are often observed due to the various size distributions and presence of impurity states in GQDs. This UV–Vis and PL results confirm that these carbon dots are quantum dots having completely localized electronic states and the unique optical properties.
Figure 5(d) shows the PL spectra of TiO2 and GQD–TiO2 composite samples. It can be seen from the figure that the PL spectra of all the samples except TiO2 exhibits peaks at 570, 600, 655, and 715 nm demonstrating that GQDs as a dopant give rise to some new PL phenomena. Also, the intensity of the spectra increases significantly as we increase the amount of GQDs in composite samples. This indicates that the incorporation GQDs in TiO2 may induce some new defects states in TiO2. However, these defect states can be served as trapped states preventing the recombination of electron–hole pair and thereby increasing the photoactivity of the composite.[ Reference Ola and Maroto-Valer 30 ] The photoactivity results are explained in detail in the next section.
Photocatalytic properties
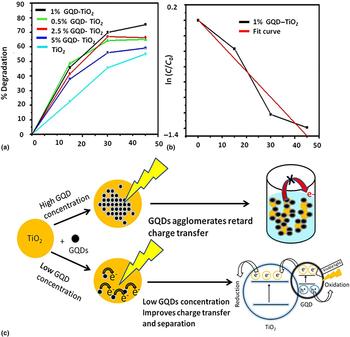
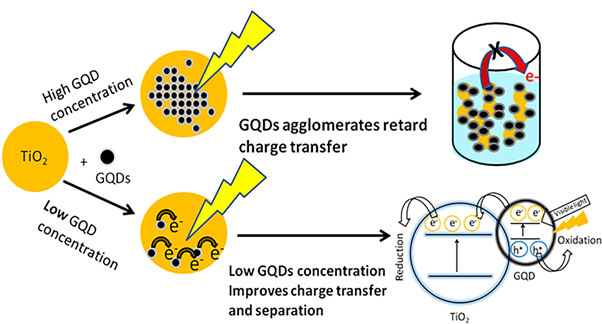
The photodegradation of Methylene Blue was employed to evaluate the photocatalytic activities of the GQDs and GQD–TiO2 composite samples. The photocatalytic activity observed with respect to wt% GQDs incorporated in the TiO2 is shown in Fig. 6. Highest activity is observed for 1% GQD–TiO2 sample with the extent of activity varying as 1.0% > 2.5% > 0.5% > 5.0% > TiO2. This result clearly indicates that the incorporation of GQDs increases the photoactivity of the TiO2 sample. This may be attributed to the efficient charge-separation occurring in GQD–TiO2 interface. The schematic of GQD–TiO2 heterojunctions is shown in Fig. 6(c). In this case, the LUMO of the GQDs locates above the conduction band (CB) bottom (−4.2 eV) of anatase TiO2, giving a large energy difference of 1.11 eV to drive the electron transfer from the CB of the GQDs to the CB of TiO2.[ Reference Pan, Jiao, Li, Guo, Feng, Liu, Wang and Wu 11 ] whereas the generated holes accumulates in the valence band of the GQDs to form a hole center. Consequently, the excited electron/hole pair would separate effectively resulting in the enhanced photocatalytic activity from 0 < 0.5 < 1.0% GQD–TiO2 composites. In addition to this, 1% GQD–TiO2 also showed maximum red shift and highest visible light absorption [Fig. 4(b)], which may contribute toward the highest photoactivity of this sample.
(a) Photocatalytic degradation of Methylene blue using GQD–TiO2 composite samples, (b) fitting curve of the first-order kinetic model for 1% GQD–TiO2 composite, and (c) schematic representation of GQD–TiO2 heterojunctions.

However, reduced photocatalytic activity at a higher GQD concentration (2.5% and 5.0%) can be attributed to the masking of the TiO2 surface by surplus GQDs nanoparticles thereby retarding the charge transfer from the TiO2 catalyst to Methylene Blue dye molecules, which is detrimental for the photocatalytic activity as illustrated in Fig. 6(c).[ Reference Pan, Jiao, Li, Guo, Feng, Liu, Wang and Wu 11 ] In addition to that, a higher concentration of GQDs in the composite results in aggregation of GQDs and reduces the interaction between the surface of TiO2 and GQDs. This, in turn, fails to inhibit the recombination of photogenerated charge carriers in TiO2 with large electron–hole pair binding energy. Therefore, 1% GQD–TiO2 appears to be optimum showing highest photocatalytic activity.
Figure 6(b), shows the fitting results of first-order kinetic models based on the experimental degradation data of MB by 1% GQD–TiO2 composite. The same fitting analysis has been carried out for all the composite samples. From this fitting analysis, it can be concluded that the first-order kinetic model [ln(Co/C) = kt] very well correlate with the experimental data.
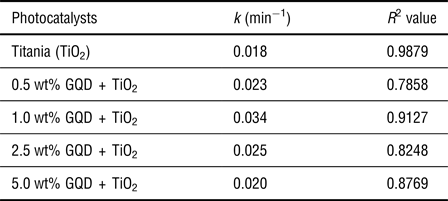
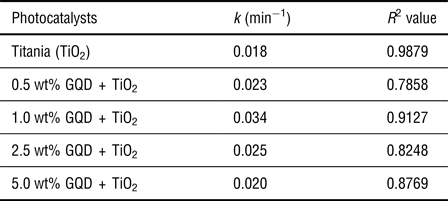
The rate constants and R 2 values obtained from these fitting analyses are given in Table 1. 1% GQD–TiO2 composite shows the highest rate constant indicating highest photoactivity amongst the composite samples.
Rate constant (k) and R 2 values of TiO2 and GQD–TiO2 composites.
Conclusion
GQDs have been successfully synthesized by a wet chemical method using inexpensive and easily available bird-charcoal as a precursor. Use of bird-charcoal as a precursor confers many advantages such as easy dispersion, exfoliation, and functionalization during the synthesis. Employing different temperatures for the synthesis lead to the formation of different sized GQDS. These GQDs are further coupled with TiO2 to form stable TiO2–GQDs nanocomposites. Coupling the TiO2 with GQDs, enhanced the visible light absorption and restricted the recombination reaction of charge carriers. The photocatalytic activity of these composites is significantly higher than the pure TiO2. The rate constants have been calculated for all the photodegradation reactions. The 1% GQD–TiO2 composite is found to show the highest rate constant as compared with the other GQD–TiO2 composites.
Acknowledgments
This project is the result of the combined efforts and leadership of many valued individuals. We would like to thank Professor Ewelina Lucow's for her guidance through the progression of this project. We also acknowledge support from San Jose State University's Research, Service and Creative Activity Grant Awards.