Implications
In breed improvement programmes, repeatable live animal scores and measurements can be used in the identification of animals with superior genetic merit for carcass composition and value. This study also showed the potential of EU carcass conformation and fat scores to predict carcass meat proportion and thus, facilitate the operation of a payment system based on meat yield, which would reward farmers more equitably.
Introduction
Fisher (Reference Fisher2007) has pointed out that beef carcass classification plays an important role in Europe, as a marketing aid within and between countries and as a means of increasing the precision of price reporting for administrative purposes. The purpose of carcass classification is to categorise carcasses according to their conformation and fatness. In the European Union (EU), beef carcasses are classified according to the official beef carcass classification scheme (Commission of the European Communities, 1982). For conformation, the classes EUROP are used with E denoting carcasses with the best conformation with an option of an S class for carcasses with extremely good muscular development, whereas fat cover is assessed on a five-point scale (1 to 5), with 1 being the leanest (Allen, Reference Allen2007). By attaching a pricing schedule to the various classes, producers are incentivised to supply the type of carcass required by the market (Allen, Reference Allen2007). However, the usefulness of carcass classification information for conformation and fatness is dependent on their relationship to economically important traits such as meat yield, meat distribution in the carcass and, ultimately, carcass value (Drennan, Reference Drennan2006). Delfa et al. (Reference Delfa, Ripoll, Panea, Joy and Alberti2007), using 69 bull carcasses, found that hot carcass weight and EU carcass classification for conformation and fatness explained 97%, 60% and 85% of muscle, fat and bone weight, respectively. Perry et al. (Reference Perry, McKiernan and Yeates1993a) reported that carcass weight and carcass muscle score accounted for 38% of the total variation in meat yield, with carcass muscle score accounting for nearly all of the variation. In contrast, other studies have shown poor relationships between carcass shape score or conformation score and meat yield (Kempster and Harrington, Reference Kempster and Harrington1980; Taylor et al., Reference Taylor, Meehan, Johnson and Ferguson1990). Few studies have, however, examined the relationship between carcass conformation and fat scores as measured under the EU beef carcass classification scheme with carcass traits and value.
Information from carcass classification, which is based on visual examination of carcasses and has been replaced by mechanical classification in Ireland, could play an important role in breed improvement programmes. Additionally, live animal scores/measurements could be used to further assist the breeding and production of animals that meet market requirements through identification or screening earlier in life provided that there is a good relationship between these live animal records and the carcass traits of interest. Previous studies (Perry et al., Reference Perry, McKiernan and Yeates1993a; MacAodháin, Reference MacAodháin2004; Drennan et al., Reference Drennan, McGee and Keane2008) have shown that live animal muscular scores were useful in predicting meat yield. Furthermore, Greiner et al. (Reference Greiner, Rouse, Wilson, Cundiff and Wheeler2003) found that live animal ultrasound measurements of the longissimus dorsi were useful predictors of retail product. Live animal ultrasound measurements were shown to have a good relationship with carcass meat proportion (Faulkner et al., Reference Faulkner, Parrett, McKeith and Berger1990; Tait et al., Reference Tait, Wilson and Rouse2005).
The objectives of this study were to determine the relationship of (i) live animal muscular and skeletal scores, and ultrasonically scanned muscle and fat depth measurements of the longissimus dorsi and (ii) carcass conformation and fat scores with carcass composition and value.
Material and methods
Animals and management
A total of 336 steers slaughtered over a 2-year period in eight different batches were used. The animals consisted of Holstein-Friesian, Aberdeen Angus × Holstein-Friesian and 0.5 to 1.0 late-maturing continental breed crosses. The finishing diet varied from grass silage only, grass or maize silage plus supplementary concentrates to concentrates offered ad libitum plus 1 kg of roughage dry matter per head daily. All animals were slaughtered at the end of a winter housing period when approximately 2 years old.
Muscular and skeletal scores/measurements
At 8 to 12 months of age and pre-slaughter, animals were linear-scored by two assessors (A and B) from the Irish Cattle Breeding Federation (ICBF). This involved assigning muscular scores on a scale of 1 (poor) to 15 (excellent), at six locations (width at withers, width behind withers, loin development, development of hind-quarter, width of hind-quarter and development of the inner thigh) and skeletal scores (scale of 1 to 10) at three locations (length of back, pelvic length and height at withers) (ICBF, 2002). The six muscular scores were then averaged to give one score per animal for each assessor. Skeletal scores were also averaged in a similar manner. Allowances were made for subcutaneous fat by the assessors when assigning muscular scores. Simultaneously, scores were also assigned using the Signet scoring system (Allen, Reference Allen1990) by two staff members (assessors C and D) from the research centre. The Signet muscular score was also based on a scale of 1 to 15 extending to 18 for double-muscled animals. The three scoring locations were roundness of hind-quarter, width of hind-quarter and depth and width of loin, which were also averaged to give a mean score per animal for each assessor. All scoring was carried out by visual assessment except for height at withers, which was recorded using a measuring pole. Of the 336 animals that were boned out under commercial abattoir conditions, the assessors A, B, C and D recorded pre-slaughter live animal scores on 336, 246, 336 and 280 steers, respectively. Corresponding numbers scored at 8 to 12 months of age were 85, 67, 67 and 67.
Ultrasound measurements
Scanned ultrasound measurements were recorded on the right side of a proportion of the animals at 8 to 12 months of age (n = 85) and pre-slaughter (n = 146). A dynamic imaging real-time scanner (model – Concept MLV, with 3.5 MHz head) was used and eye muscle depth was measured at the third lumbar vertebra, and fat depth at both the third lumbar vertebra and 13th thoracic rib. Hair was clipped from each area pre-scanning and vegetable oil was applied to obtain adequate acoustic contact. Cattle were restrained at the head and physical palpation was used to accurately ascertain the scanning sites. The probe was placed perpendicular to the rib eye length (longissimus dorsi muscle) at the third lumbar vertebra and 13th thoracic rib until bones appeared on the monitor, and when a satisfactory image was achieved it was frozen on the monitor. Eye muscle depth and fat depth were then measured using an internal calliper built into the software to give instant results. Fat depth was measured at three points at the third lumbar vertebra across the width (0.4, 0.6 and 0.8) of the muscle and at four points (0.2, 0.4, 0.6 and 0.8) at the 13th thoracic vertebra. Fat depth was calculated by taking the mean of the average values for the third lumbar and 13th thoracic rib. Muscle depth was obtained at the deepest point (0.25) of the muscle (from the bottom of the backfat to the top of the bone) at the third lumbar vertebra.
Carcass measurements
Carcass conformation and fat scores were obtained using the mechanical grading system (Allen, Reference Allen2007) on a 15-point scale rather than a five-point scale (Commission of the European Communities, 1982). Hot carcass weight was recorded and cold carcass weight was taken as 0.98 of hot carcass weight. Weight of perinephric and retroperitoneal fat was also recorded at slaughter. Following a period of 24 h at 4°C, the right side of each carcass was quartered at the fifth rib into an eight-rib pistola and the remaining fore-quarter. After recording the weight, the pistola was dissected into 13 cuts (leg, heel, silverside, topside, knuckle, rump, tail of rump, cap of rump, fillet, strip loin, cube roll, cap of rib and eye of round) from which all visible fat and bone (where applicable) was removed. The weight of each meat cut and total fat from the pistola were recorded as was bone weight following removal of all adhering tissues. Lean trim was weighed separately and added to the meat cuts to give total pistola meat yield. A similar procedure was carried out with the fore-quarter, which was dissected into 11 cuts (front shin, neck, brisket, chuck, flat ribs (1 to 5), plate, leg of mutton cut, bladesteak, braising muscle, chuck tender and clod). Pistola and fore-quarter meat, fat and bone weights were combined to give the weight of each component in the half carcass. High-value cuts in the carcass were defined as the meat in the cube roll, striploin and fillet. Carcass value was estimated as the sum of the commercial value of each meat cut with a small deduction for bone expressed as a proportion of half carcass weight.
Statistical analysis
Data were analysed using Proc REG and CORR of the Statistical Analysis Systems Institute (SAS, 2007). Simple correlation coefficients of live animal scores/measurements and carcass conformation and fat scores with the various carcass traits were carried out using Pearson’s correlations. The relationships between muscular scores, ultrasound muscle and fat depths, and conformation and fat scores and the dependant variables (meat, fat and bone proportions, proportion of high-value cuts in the carcass and meat, and carcass value) were determined using multiple regression. The contribution made to the estimation of each dependent variable by each independent variable was determined by comparison of the coefficient of determination (R 2) and the residual standard deviation (r.s.d.).
Results
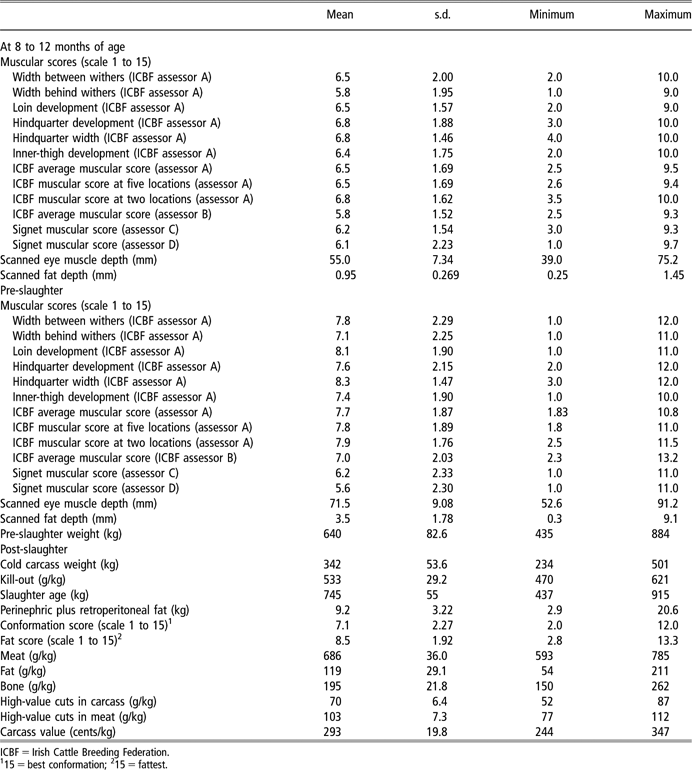
The mean, range and standard deviations for live and carcass traits are summarised in Table 1. At slaughter, animals had a mean age of 745 days, live weight of 640 kg and cold carcass weight of 342 kg. Carcass conformation and fat scores ranged from 2.0 to 12.0 and from 2.8 to 13.3, respectively. Carcass meat, fat and bone proportions were 686, 119 and 195 g/kg, respectively. High-value cuts in the carcass and in meat were 70 and 103 g/kg, respectively.
Mean, standard deviation and range for live animal and carcass scores and measurements of steers
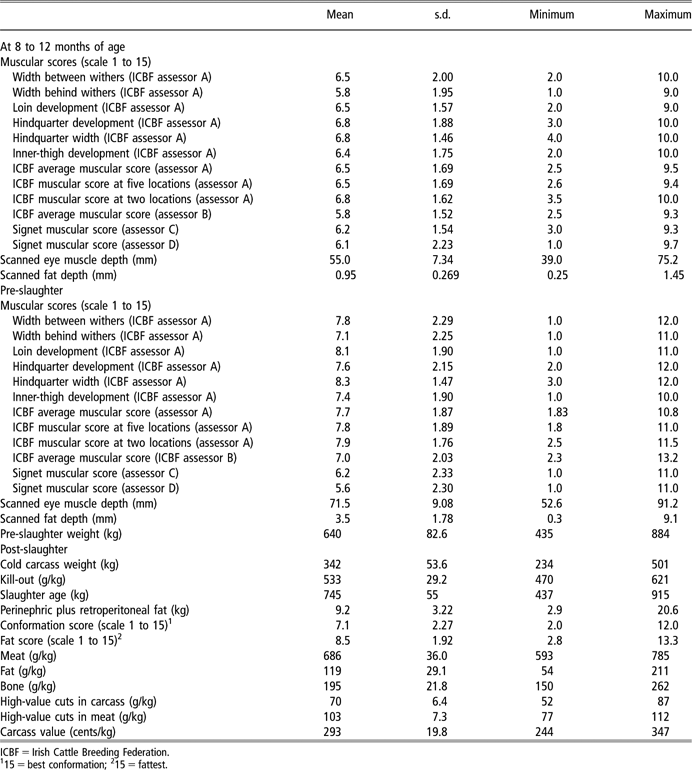
ICBF = Irish Cattle Breeding Federation.
115 = best conformation; 215 = fattest.
Assessors
Correlations obtained between the four assessors (two using the ICBF system and two using the Signet system) for muscular scores at 8 to 12 months of age ranged from 0.74 to 0.87 and pre-slaughter ranged from 0.71 to 0.86 (P < 0.001). Repeatability values using simple correlations, obtained from scanning 84 animals, on two consecutive days pre-slaughter were 0.92 for muscle depth and 0.84 for fat depth.
Correlations using live animal muscular scores
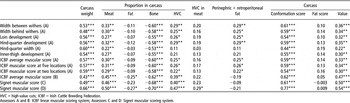
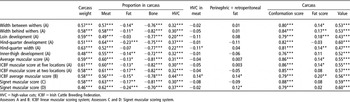
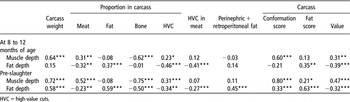
Correlations using live animal scores with the various carcass traits are shown in Tables 2 and 3. Based on the figures obtained by the ICBF assessor A, positive correlations were obtained (Table 3) using the average muscular score pre-slaughter with carcass meat proportion (r = 0.60), value (r = 0.55), carcass conformation score (r = 0.86) and the proportion of high-value cuts in the carcass (r = 0.31). The corresponding correlations were negative with carcass bone (r = −0.81) and fat proportion (r = −0.13), whereas those with the proportion of high-value cuts in the meat, perinephric and retroperitoneal fat and carcass fat score were low, and generally non-significant, ranging from −0.04 to 0.14. Corresponding correlations between live animal muscular scores at 8 to 12 months of age (Table 2) with the various carcass traits generally showed lower values and similar trends when compared to those using pre-slaughter figures. Correlations using muscular scores by assessors B, C and D were similar to those obtained by assessor A. Correlations between ICBF hind-quarter development alone and the various carcass traits resulted in similar correlations to the ICBF average of all six individual locations.
Correlations of live animal muscular scores at 8 to 12 months of age with carcass weight, carcass meat, fat and bone proportions, proportion of high-value cuts in the carcass and meat, perinephric and retroperitoneal fat, carcass conformation and fat scores and carcass value

HVC = high-value cuts; ICBF = Irish Cattle Breeding Federation.
Assessors A and B: ICBF linear muscular scoring system; Assessors C and D: Signet muscular scoring system.
Correlations of live animal muscular scores pre-slaughter with carcass weight, killing-out rate, carcass meat, fat and bone proportions, proportion of high-value cuts in the carcass and meat, perinephric and retroperitoneal fat, carcass conformation and fat scores and carcass value

HVC = high-value cuts; ICBF = Irish Cattle Breeding Federation.
Assessors A and B: ICBF linear muscular scoring system; Assessors C and D: Signet muscular scoring system.
Correlations using skeletal scores
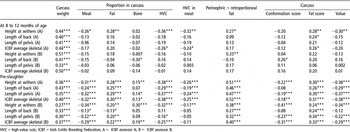
Correlation coefficients (Table 4), using skeletal scores (three locations combined) recorded pre-slaughter by Assessor A, showed positive correlations with carcass weight (r = 0.40), carcass fat proportion (r = 0.30), carcass bone proportion (r = 0.13), perinephric and retroperitoneal fat (r = 0.52) and carcass fat score (r = 0.31), whereas negative correlations (P < 0.01), ranging between −0.18 and −0.38, were obtained with carcass meat proportion, proportion of high-value cuts in the carcass and in meat, carcass value and carcass conformation score. Correlations between individual skeletal scores pre-slaughter generally had similar values to the average of the combined ICBF skeletal scores. Skeletal scores by assessor B had lower correlations with the various carcass traits than those obtained by assessor A. Correlations between skeletal scores taken at 8 to 12 months of age with the various carcass traits for both assessors A and B were poor, and generally not significant.
Correlation of live animal skeletal scores with carcass weight, carcass meat, fat and bone proportions, proportion of high-value cuts in the carcass and meat, perinephric and retroperitoneal fat, carcass conformation and fat scores and carcass value

HVC = high-value cuts; ICBF = Irish Cattle Breeding Federation; A = ICBF assessor A; B = ICBF assessor B.
Correlations using ultrasonically scanned measurements
Positive correlations (P < 0.001) were obtained (Table 5) between scanned muscle depth pre-slaughter and carcass weight (r = 0.72), carcass meat proportion (r = 0.52), proportion of high-value cuts in the carcass (r = 0.31), carcass conformation score (r = 0.80) and carcass value (r = 0.47), whereas a high negative correlation (P < 0.001) was obtained with carcass bone proportion (r = −0.75). Low correlations, ranging from −0.08 to 0.21, were obtained between scanned muscle depth taken pre-slaughter and carcass fat proportion, proportion of high-value cuts in the meat, perinephric and retroperitoneal fat and carcass fat score. Corresponding correlations for scanned muscle depth at 8 to 12 months of age showed similar trends but were generally lower. Significant positive correlations were obtained between scanned fat depth taken pre-slaughter and carcass weight (r = 0.58), carcass fat proportion (r = 0.59), perinephric and retroperitoneal fat (r = 0.45), carcass conformation (r = 0.33) and fat score (r = 0.63), whereas significant negative correlations were obtained with carcass meat (r = −0.23) and bone (r = −0.50) proportions, proportion of high-value cuts in the carcass (r = −0.34) and in meat (r = −0.27) and carcass value (r = −0.32). Correlation coefficients between scanned fat depths at 8 to 12 months of age were in the same direction of those obtained pre-slaughter with carcass meat and fat proportions, proportion of high-value cuts in carcass and in meat and carcass value. Corresponding correlations with carcass weight, perinephric and retroperitoneal fat, carcass bone proportion and carcass conformation score were not significant.
Correlation of ultrasonically scanned measurements with carcass weight, carcass meat, fat and bone proportions, proportion of high-value cuts in the carcass and in meat, perinephric and retroperitoneal fat, carcass conformation and fat scores and carcass value

HVC = high-value cuts.
Correlations using carcass conformation and fat scores
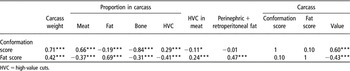
Positive correlations (P < 0.001), ranging between 0.60 and 0.71, were obtained (Table 6) for carcass conformation score with carcass weight, carcass meat proportion and carcass value, and a lower value obtained for the proportion of high-value cuts in the carcass (r = 0.29), whereas significant negative correlations were obtained with carcass bone (r = −0.84) and fat (r = −0.19) proportions and the proportion of high-value cuts in the meat (r = −0.11). Correlations of conformation score with perinephric and retroperitoneal fat and fat score were not significant. Positive correlations (P < 0.001) were obtained for carcass fat score with carcass weight (r = 0.42), carcass fat proportion (r = 0.69), proportion of high-value cuts in the meat (r = 0.24) and perinephric and retroperitoneal fat (r = 0.47), whereas negative correlations (P < 0.001), ranging between −0.31 and −0.43, were obtained with carcass meat and bone proportions, proportion of high-value cuts in the carcass and carcass value.
Correlation of carcass conformation and fat scores with carcass weight, carcass meat, fat and bone proportions, proportion of high-value cuts in the carcass and meat, carcass conformation and fat scores, perinephric and retroperitoneal fat and carcass value

HVC = high-value cuts.
Regressions using live animal scores and measurements
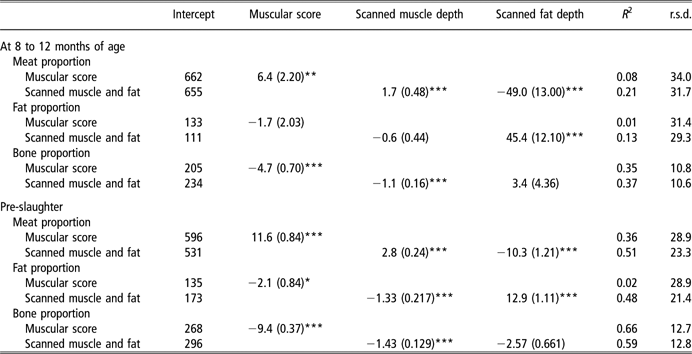
Regression equations using live animal muscular scores (based on the figures recorded by ICBF assessor A) and ultrasound muscle and fat depth measurements alone to predict carcass meat, fat and bone proportions are shown in Table 7. Both muscular score (average of the six locations) and scanned muscle and fat depth alone taken pre-slaughter explained 0.36 and 0.51, respectively, of the total variation in carcass meat proportion. Muscular score alone was a poor predictor of carcass fat proportion (R 2 = 0.02), whereas scanned muscle and fat depth alone explained 0.48 of the total variation in fat proportion. Muscular score alone and scanned muscle and fat depth measurements explained 0.66 and 0.59, respectively, of total variation in carcass bone proportion. The corresponding R 2 values involving muscular score alone and scanned measurements at 8 to 12 months of age were lower but generally followed a similar trend to values obtained using those taken pre-slaughter.
Regression equations using live animal muscular and ultrasound scanned measurements at 8 to 12 months of age and pre-slaughter for predicting carcass meat, fat and bone proportions
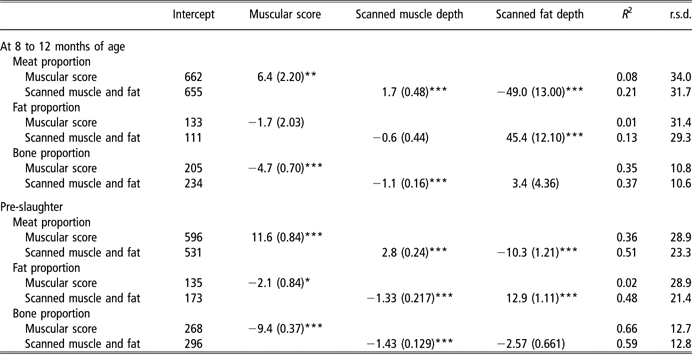
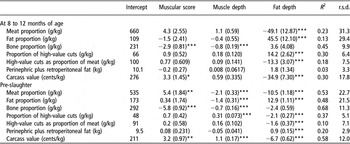
Multiple regression equations using the combined live animal muscular scores and ultrasound muscle and fat depth measurements to predict the various carcass traits and carcass value are shown in Table 8. Using pre-slaughter measurements, the combined muscular and scanned measurements explained between 0.53 and 0.68 of the total variation in carcass meat and bone proportions and carcass value, with a lower proportion of total variation explained for carcass fat proportion (R 2 = 0.48), the proportion of high-value cuts in the carcass (R 2 = 0.37) and in meat (R 2 = 0.10) and perinephric and retroperitoneal fat (R 2 = 0.20). Again, corresponding R 2 using muscular score and scanned measurements taken at 8 to 12 months of age were considerably lower than those obtained using pre-slaughter figures.
Regression equations using live animal muscle scores and ultrasound muscle and fat measurements at 8 to 12 months of age and pre-slaughter for predicting the proportions of meat, fat, bone and high-value meat cuts in the carcass and carcass value

Regressions using carcass conformation and fat scores
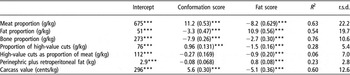
Regression analysis (Table 9) showed that carcass conformation and fat scores explained between 0.60 and 0.76 of the total variation in carcass meat and bone proportions and carcass value, whereas the variation explained with carcass fat proportion (R 2 = 0.54), proportion of high-value cuts in the carcass (R 2 = 0.28) and perinephric and retroperitoneal fat (R 2 = 0.23) was lower. Little variation was explained (R 2 = 0.06) in using carcass conformation and fat scores to predict the proportion of high-value cuts in meat.
Regression on carcass conformation and fat scores of carcass meat, fat and bone proportions, proportion of high-value cuts in the carcass and in meat and carcass value

Discussion
Assessors
Perry et al. (Reference Perry, McKiernan and Yeates1993a) using two assessors for live animal muscle scoring found correlations ranging from 0.90 to 0.92 between the assessors, which was greater than the values of 0.71 to 0.87 obtained in the present study. One reason for the lower correlations in the present study was the fact that eight separate batches of animals were used over a 2-year period, which is likely to result in lower correlations than when all records are taken at the same time. Perkins et al. (Reference Perkins, Green, Hamlin, Shepard and Miller1992) reported repeatabilities of ultrasonic estimates of carcass fat thickness and longissimus muscle area of 0.91 and 0.81, respectively, when repeated over 2 days. The corresponding values in the present study were 0.84 and 0.92 indicating that measurement of muscle size was better in the present study, whereas the lower repeatability for fat thickness may have been due to low subcutaneous fat depths making accurate measurement more difficult.
Correlations using live animal muscular scores
The positive correlations (r ∼ 0.60) obtained between live animal muscular scores taken pre-slaughter with carcass meat proportion and carcass value are in general agreement with the results of Perry et al. (Reference Perry, McKiernan and Yeates1993a) and Drennan et al. (Reference Drennan, McGee and Keane2008). This shows the potential of live animal muscular scores in predicting the economic value of the carcass. The low negative relationship (r ∼ −0.15) of live animal muscular scores with carcass fat proportion, fat score and the general lack of a relationship with perinephric and retroperitoneal fat agrees with Perry et al. (Reference Perry, Yeates and McKiernan1993b) who found that most of the effect was attributed to the amount of subcutaneous fat and not intermuscular fat. Negative correlations between live animal muscular scores taken pre-slaughter and carcass bone proportion were obtained by MacAodháin (Reference MacAodháin2004) (−0.58 to −0.65) and Drennan et al. (Reference Drennan, McGee and Keane2008) (r ∼ −0.60) both of which were poorer than those (r ∼ −0.80) found in the present study. Similarly, Colomer-Rocher et al. (Reference Colomer-Rocher, Bass and Johnson1980) found that animals in convex hind-quarter (heavy muscled) classes had more muscle and a higher muscle-to-bone ratio than those in concave classes. The positive relationship between pre-slaughter muscular scores and the proportion of high-value cuts in the carcass (r = 0.31) was higher than that obtained by Herring et al. (Reference Herring, Williams, Bertrand, Benyshek and Miller1994) using eight cuts from the carcass compared with three cuts in the present study. The lack of a relationship between live animal muscular scores and the proportion of high-value cuts in meat indicates that, when bone and fat are excluded, there is no effect of muscular score on the distribution of meat in the carcass. The significant positive relationship (r = 0.79 to 0.88) between muscular scores recorded pre-slaughter and carcass conformation score can be expected, as both are indicators of muscularity. This concurs with the findings of Perry et al. (Reference Perry, McKiernan and Yeates1993a and Reference Perry, Yeates and McKiernan1993b). Drennan et al. (Reference Drennan, McGee and Keane2008), using bulls and heifers with a smaller range in carcass conformation score, found a mean correlation of 0.70 between muscular score and conformation again, demonstrating a good relationship between these traits. Correlations with live animal muscular scores taken at 8 to 12 months of age were generally lower than those with records taken pre-slaughter, which is similar to the findings of Drennan et al. (Reference Drennan, McGee and Keane2008). Correlations using one location of the ICBF scoring system namely, roundness of hind-quarter, were similar to the average of the entire six locations in the present study. The Signet scoring system (using three scoring locations) also showed similar correlations to the average ICBF muscular score suggesting that a more simplified muscular scoring system with emphasis on hind-quarter development could be used.
Correlations using skeletal scores
There was generally a non-significant relationship between the live animal skeletal scores at 8 to 12 months of age and the various carcass traits, which agrees with Hassen et al. (Reference Hassen, Wilson and Rouse1999). Skeletal scores taken pre-slaughter showed a positive relationship (r = 0.22 to 0.52) with the three indicators of fat (carcass fat proportion, carcass fat score and perinephric and retroperitoneal fat) and a negative relationship (r = −0.18 to −0.38) with carcass meat proportion, proportion of high-value cuts in the carcass, carcass conformation score and carcass value. Other studies (Bailey et al., Reference Bailey, Jensen and Bech Andersen1986; Herring et al., Reference Herring, Williams, Bertrand, Benyshek and Miller1994) have also shown low negative correlations between various skeletal measurements and percentage carcass lean or retail product.
Correlations using scanned muscle and fat depth
Depth of the longissimus dorsi muscle at the third lumbar vertebra as measured in this study, was shown by Doorley (Reference Doorley2001) and Bergen et al. (Reference Bergen, Crews, Miller and McKinnon2003) to be as valuable at predicting carcass composition as muscle area measurements. The positive correlation (r = 0.52) between pre-slaughter scanned muscle depth and carcass meat proportion is within the range (0.30 to 0.84) found in some studies (Doorley, Reference Doorley2001; Tait et al., Reference Tait, Wilson and Rouse2005), but higher than other (r = 0.07 to 0.17) results (Hamlin et al., Reference Hamlin, Green, Cundiff, Wheeler and Dikeman1995; May et al., Reference May, Mies, Edwards, Harris, Morgan, Garrett, Williams, Wise, Cross and Savell2000; Greiner et al., Reference Greiner, Rouse, Wilson, Cundiff and Wheeler2003). The generally non-significant relationship between scanned muscle depth and the three indicators of carcass fat was as expected, and the high negative relationship with carcass bone proportion (r = −0.75) was in agreement with Bailey et al. (Reference Bailey, Jensen and Bech Andersen1986). The positive relationship (r = 0.31) obtained between scanned muscle depths recorded pre-slaughter and the proportion of high-value cuts in the carcass was similar to the findings of Tait et al. (Reference Tait, Wilson and Rouse2005). The positive correlation (r = 0.80) between scanned muscle depth pre-slaughter and carcass conformation score followed the same trend but was somewhat greater than that (r ∼ 0.50) found in previous studies (Bailey et al., Reference Bailey, Jensen and Bech Andersen1986; Doorley, Reference Doorley2001; MacAodháin, Reference MacAodháin2004). Correlations of pre-slaughter scanned fat depth were negative with carcass meat (r = −0.23) and bone (r = −0.34) proportions and positive with fat proportion (r = 0.59) and fat score (r = 0.63), which is in general agreement with previous findings (Doorley, Reference Doorley2001; MacAodháin, Reference MacAodháin2004). Correlations between carcass traits and scanned muscle depth obtained pre-slaughter were greater than those obtained at 8 to 12 months of age. Similarly, Hamlin et al. (Reference Hamlin, Green, Cundiff, Wheeler and Dikeman1995) found that with animals scanned at intervals between weaning and slaughter, the accuracy with which carcass traits were predicted from muscle area and fat depth increased, the closer the measurements were obtained to slaughter. Wolcott et al. (Reference Wolcott, Thompson and Perry2001) also found that the power of live animal measurements to predict retail beef yield percentage decreased as the time between scanning and slaughter increased. Tait et al. (Reference Tait, Wilson and Rouse2005) reported that ultrasound measures in the live animal were potentially more accurate predictors of retail product than measures collected on the carcass, while Herring et al. (Reference Herring, Williams, Bertrand, Benyshek and Miller1994) found that live animal and carcass equations were equally effective in ranking animals for retail product yield.
Correlations using carcass conformation and fat scores
The strong relationship between carcass conformation score and carcass meat proportion (r = 0.66) is as expected, because conformation score measures the thickness of muscle and fat in relation to the size of the skeleton (De Boer et al., Reference De Boer, Dumont, Pomeroy and Weniger1974). Bjelka et al. (Reference Bjelka, Šubrt, Polách, Krestýnová and Uttendorfský2002) also reported a higher proportion of meat in class U than class R bull carcasses. Similar to the present study, Perry et al. (Reference Perry, McKiernan and Yeates1993a) found a correlation of 0.60 between carcass muscle score and saleable meat proportion, whereas in contrast, the correlation found by Bohuslávek (Reference Bohuslávek2002) was much lower (r = 0.05). However, the latter author found significant correlations between conformation and the proportion of saleable meat when animals of similar fatness were analysed. In the present study, the relationship between carcass conformation score and carcass value followed a similar trend to that of carcass meat proportion. This is because carcass value was mainly based on the value of individual meat cuts and not overall carcass weight, which includes carcass fat and bone, and can influence price. The significant correlation (r = 0.29) between conformation score and the proportion of high-value cuts in the carcass is consistent with the findings of Colomer-Rocher et al. (Reference Colomer-Rocher, Bass and Johnson1980). However, in contrast, Bjelka et al. (Reference Bjelka, Šubrt, Polách, Krestýnová and Uttendorfský2002) found no relationship between these traits. The high negative relationship between carcass conformation score and carcass bone proportion is in agreement with Colomer-Rocher et al. (Reference Colomer-Rocher, Bass and Johnson1980) who reported that in steers at the same carcass weight and fatness, the muscle content of the hind-quarter increased linearly by 0.56 kg and bone decreased linearly by 0.13 kg per unit increase in conformation class. The low, generally negative, relationship of carcass conformation score with carcass fat proportion and fat score are similar to the correlations obtained by Bohuslávek (Reference Bohuslávek2002). Similarly, Bjelka et al. (Reference Bjelka, Šubrt, Polách, Krestýnová and Uttendorfský2002) reported that the lowest content of separable fat in bulls was in conformation class E and it gradually increased through to the poorer classes. The significant negative correlation of carcass fat score with carcass meat proportion is similar to previous findings (May et al., Reference May, Mies, Edwards, Harris, Morgan, Garrett, Williams, Wise, Cross and Savell2000; Greiner et al., Reference Greiner, Rouse, Wilson, Cundiff and Wheeler2003). In accordance with Drennan et al. (Reference Drennan, McGee and Keane2008), significant positive correlations were obtained between carcass fat score with carcass fat proportion and perinephric and retroperitoneal fat.
Regression of live animal scores and measurements to predict carcass composition and value
Pre-slaughter scanned muscle and fat depth measurements explained more variation in carcass meat proportion than pre-slaughter muscle score alone (R 2 = 0.51 v. 0.36). Ultrasound measurements explained a similar amount of total variation in carcass meat proportion as obtained in previous studies (Johnson et al., Reference Johnson, Taylor, Priyanto and Meehan1992; Wolcott et al., Reference Wolcott, Thompson and Perry2001). The R 2 for pre-slaughter muscular score alone was similar to the value of 0.37 for muscle score found by Perry et al. (Reference Perry, Yeates and McKiernan1993b). When combined, scanned muscle and fat depth measurement and live animal muscular score explained 0.53 of the total variation in carcass meat proportion, which was only marginally greater than that obtained by scanned measurements alone. This implies that both muscular score and muscle depth were equally good indicators of muscularity as evidenced by their high correlations (∼>0.8) with carcass conformation score. Perry et al. (Reference Perry, McKiernan and Yeates1993a) explained a higher proportion of variation (R 2 = 0.62) in carcass meat proportion than the present study, using live weight, scanned P8 fat and live muscle score combined. The 0.48 of the total variation in carcass fat proportion explained by scanned measurements was less than the 0.85 found by Faulkner et al. (Reference Faulkner, Parrett, McKeith and Berger1990) using live-weight and ultrasound fat measurements in cows. In the present study, the combined pre-slaughter ultrasound measurements and muscular score explained 0.68 of the total variation in carcass bone proportion, which was only marginally greater than that explained by the individual records. This value is lower than the value of 0.79 found by Faulkner et al. (Reference Faulkner, Parrett, McKeith and Berger1990) using live weight and ultrasound fat measurements. When recorded pre-slaughter, both muscular score and scanned muscle and fat depth measurements combined accounted for 0.58 of the total variation in carcass value, which is lower than the value of 0.85 obtained by Perry et al. (Reference Perry, McKiernan and Yeates1993a) using live weight, P8 fat and live muscle score. Live animal scores and measurements combined explained a moderate amount of total variation in the proportion of high-value cuts in the carcass (R 2 = 0.37) and a low amount in the proportion of high-value cuts in meat indicating that higher bone proportion of animals of low muscularity is the main reason for the positive relationship between these traits in the carcass. When recorded at weaning, the muscular score and scanned measurements combined explained only 0.23 and 0.30 of total variation in meat proportion and in carcass value, respectively, again showing that the relationship is better the closer to slaughter that the estimates are recorded.
Regression of carcass composition and value on carcass conformation and fat scores
When combined in a regression model, carcass conformation and fat scores accounted for 0.63 of the total variation in carcass meat proportion, which is greater than the values of 0.45 found by Jones et al. (Reference Jones, Tong and Robertson1989) using fat and muscle thickness score, and 0.52 reported by Perry et al. (Reference Perry, McKiernan and Yeates1993a) and 0.47 by Perry et al. (Reference Perry, Yeates and McKiernan1993b), using carcass muscle score, fat depth and carcass weight. Using a commercial dissection procedure, Drennan et al. (Reference Drennan, McGee and Keane2008) found that a one-unit (scale 1 to 15) increase in carcass conformation score increased carcass meat proportion by 8.9 and 8.1 g/kg in bulls and heifers, respectively, which is in close agreement with the figures of 11.2 g/kg obtained in the present study. Similarly, in agreement with the current value of 8.2 g/kg, Drennan et al. (Reference Drennan, McGee and Keane2008) found that a one-unit increase in carcass fat score decreased carcass meat proportion of bulls and heifers by 11.9 and 9.7 g/kg, respectively. In the present study, carcass classification scores explained 0.54 of the total variation in carcass fat proportion, which was lower than the 0.77 found by Taylor et al. (Reference Taylor, Meehan, Johnson and Ferguson1990) using a fat thickness measurement. The R 2 of 0.76 obtained with carcass bone proportion is considerably greater than the values of 0.34 and 0.30 for bulls and heifers, respectively, in the study by Drennan et al. (Reference Drennan, McGee and Keane2008), which did not have a wide range of breed types. In the current study, carcass conformation and fat scores explained low amounts of the total variation (R 2 ranged from 0.06 to 0.28) in high-value cuts in the carcass and in meat and perinephric and retroperitoneal fat.
Conclusion
It can be concluded that pre-slaughter live animal scores and measurements were good predictors of carcass meat proportion and carcass value (R 2 = 0.53 to 0.58), and are therefore potentially useful in breed improvement programmes, particularly with breeding animals, where carcass data would not be available. However, the poorer relationships using data obtained at 8 to 12 months of age rather than pre-slaughter indicates the need to have animals at an advanced stage of finish when assessment is carried out. Muscular scoring systems can be simplified to three locations with emphasis on the hind-quarter and loin area. The EU beef carcass classification for conformation and fatness carried out mechanically was shown to be a good predictor of carcass meat proportion and value and thus, in addition to placing commercial value on carcasses, would be useful in progeny testing programmes.
Acknowledgements
Thanks are due to Dr D. Berry for statistical analysis and helpful comments, J. Marron for valuable technical assistance and M. Weldon for secretarial work. Thanks are also due to the Farm staff at Grange and those participating in the carcass work for their assistance.