
Introduction
In recent years, a lot of work has been conducted throughout the world on the synthesis of varieties of nanomaterials and nanotechnology-derived devices owing to ease of portability, better stability, selectivity, and sensitivity in various advanced applications and measurement techniques.[Reference Drexler1–Reference Prasad5] The nanotechnology based devices are extensively explored in the field of electronics, sensors, drug delivery, environmental monitoring, food quality, catalysis[Reference Nafiseh and Nezhad6–Reference Suriyapha, Khwankhao, Natvara and Siriwan8] etc. In order to achieve this, one requires the synthesis of controlled uniform sized nanoparticles with a desired surface morphology which provides the base for the development of advanced futuristic sensing systems and portable instrumentation by the incorporation of nanotechnology. In addition to the area of engineering, materials, communications, and bio-medical, the potential of nanotechnology based innovation is very high in the field of agriculture with respect to addressing global challenges of various levels of pollutions caused by drastic increase in population and industrialization, environmental decontamination, climate change, water purification, plant protection, pesticide detection etc.[Reference Stefania, Giovanna, Fabio, Pier and Gian9–Reference Ben-Moshe14] Nanocrystalline gold in the form of quantum dots, nanocapsules, thin films, and nanoparticles is already in use for the detection of pesticides, the enhancement of nutrient absorption by plants, the delivery of active ingredients to specific sites, and water treatment processes.[Reference Nair, Renjis and Pradeep15–Reference Bootharaju and Pradeep19] In addition to this, the use of target-specific nanoparticles also helps in reducing the damage to non-target tissues in plants/animal cells and the chemicals released into the environment.
In the field of colorimetric and electrochemical-based pesticide detection systems, work is already ongoing on the fabrication of low cost, user friendly, high performance, and bio-compatible gold nanoparticle (GNP) based sensors.[Reference Nafiseh and Nezhad6, Reference Krishnendu, Sarit, Chaekyu, Xiaoning and Vincent7, Reference Weng, Wang, Vongsvivut, Li, Glushenkov, He, Chen, Barrow and Yang20–Reference Cai, Gao, Hong and Sun24] GNPs are chosen due to their simple synthesis process, highly stable, and uniform particle size which provide high surface-to-volume ratio and unique physical as well as chemical properties. In addition to this, GNPs are suitable candidates for multi-functionalization with different types of organic or biologic ligands for the selective binding and detection of small molecules and biological targets. Another important property of GNPs is their excellent optoelectronic characteristics which can be easily tuned by varying size and shape by controling the surrounding chemical environment. In the context of pesticide detection, the interaction between the binding functional group of a capping surfactant molecule and pesticide brings about changes in the physicochemical properties of GNPs, e.g., in surface plasmon resonance (SPR) absorption, conductivity, redox behavior, etc. which generates a measureable response signal. GNPs, as a colorimetric sensing material, have been already in use for the detection of heavy metal ions, small molecules, proteins, nucleic acids, malignant cells, etc. in a rapid and efficient manner.[Reference Robert, James, Robert, Robert and Chad25] The colorimetric sensing process involves aggregation-induced interparticle surface plasmon coupling of GNPs which results in a visible color change from deep wine red to blue. The current study deals with the sensing and removal of organochlorine endosulfan pesticide (ESP) using spherical shaped GNPs. The adsorption of ESP on spherical shaped GNPs forms micrometric sized aggregates of individual particles with long-cylindrical chains and patterned/non-patterned cluster structures as evidenced from transmission electron microscope (TEM) images. In the presence of GNPs, it catalyzes ESP solution to undergo hydrolysis reaction and form unstable ethylcarboxylates and carbenium ions intermediate reaction products which are easily decomposed into stable simple hydrocarbons, carbon dioxide, and amorphous carbon. Infrared (IR) transmission and UV–Vis spectroscopy techniques have been used to investigate the final products obtained on adding GNPs to ESP solution in terms of morphological and structural variations resulted after the degradation of ESP and GNPs reorganization and to establish correlation with colorimetric sensing.
Materials and methods
For the synthesis of GNPs, analytical grade tetrachloroauric acid (HAuCl4·3H2O, TCAA, 2% w/v, CDH) and sodium citrate solution (C6H5Na3O7·2H2O, 3% w/v, CDH) chemicals were used as received without any further purification/processing. In order to prepare different concentrations of ESP solutions in the 1–100 ppm range, technical grade endosulfan flakes were dissolved in 2-propanol (HPLC and spectroscopy grade, CDH).
The synthesis of GNPs was carried out as per the Turkevich chemical reaction[Reference Nair and Pradeep17] in which TCAA was reduced using sodium citrate. 0.5 mM TCAA and 38.8 mM sodium citrate solutions were prepared with double distilled water in separate volumetric flasks. TCAA solution with a magnetic stirrer was heated on a hot plate at ~180 °C. When the solution started bubbling boil, diluted sodium citrate solution was swiftly added to reduce TCAA. Afterward, the solution turns bluish within few minutes. Then, a colloidal GNP solution with a nice wine deep red color was obtained. TEM image has been used to characterize and determine the particle size and their distribution by using a JEOL-JEM (1011) microscope. In order to observe the colorimetric change, fixed quantity of 1–100 ppm concentrations of ESP solutions was reacted with 0.5 mL GNP solution and the photographs were obtained with variation in color with the ESP concentration. Once the reaction is complete, the UV–Vis spectra of all these solutions were also recorded at ambient temperature. IR transmission spectra of the as-prepared GNPs, ESP, and samples after the degradation of endosulfan with GNPs were recorded in the range of 4000–500 cm−1 with an ALPHA T (model), Bruker, Fourier transform IR spectrophotometer at 4 cm−1 resolution. Each spectrum was an average of 50 number of scans.
Results & discussion
The structural and morphological properties of GNPs prepared by the citrate route and their interaction with aqueous ESP solution were characterized by IR transmission, UV–Vis, and TEM techniques.
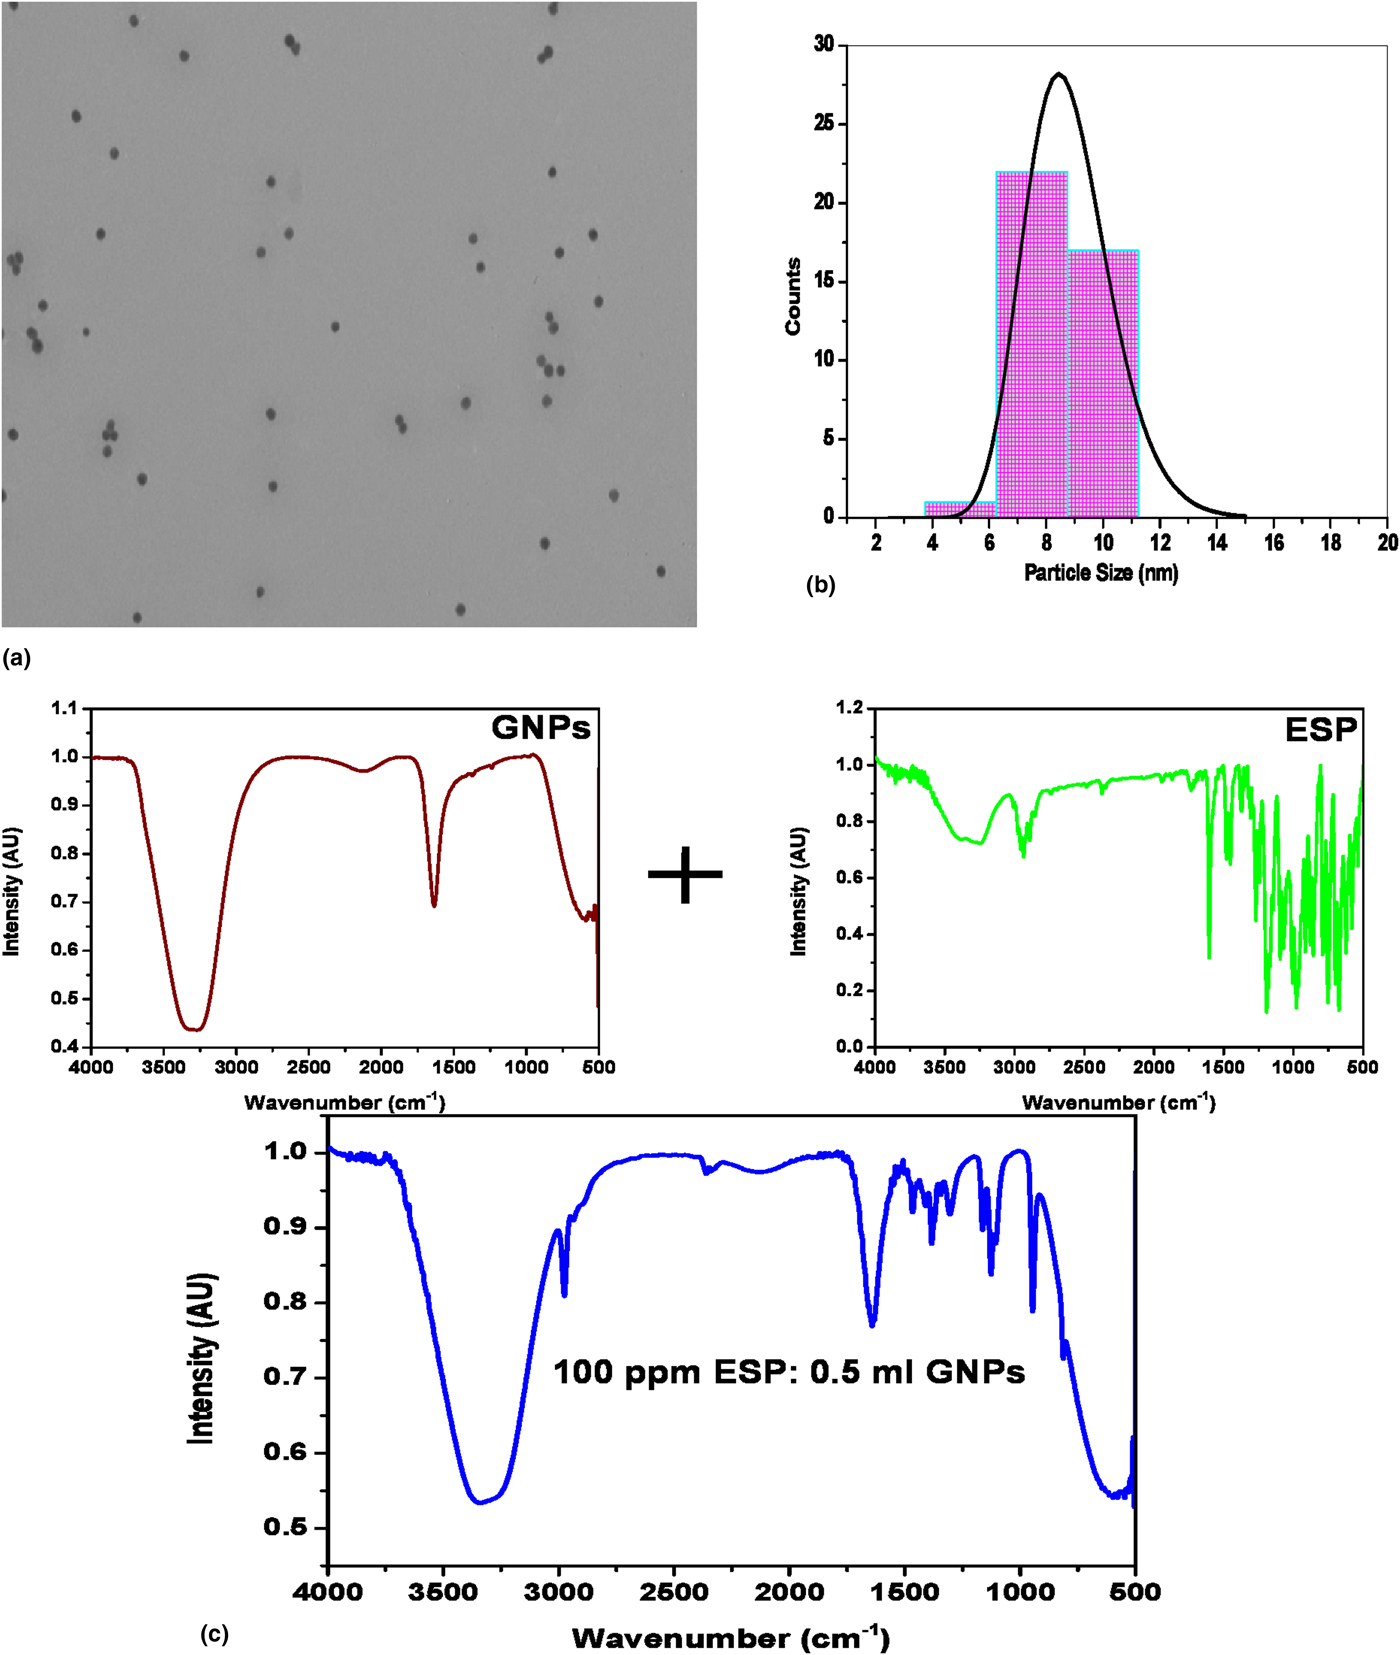
Average particle sizes and morphology of the synthesized GNPs can be estimated from the TEM image as shown in Fig. 1(a). As can be seen from Fig. 1(a), the particles are well separated and exhibit uniform spherical shape with an average particle size of ~8 nm. Figure 1(b) depicts the size distribution profile of GNPs which is plotted using the average sizes of large number of nanoparticles captured in different TEM images. This histogram can be well fitted by the log normal distribution function[Reference Goel, Arora and Biradar26] represented by the following equation:
 $$y = y_0 + \displaystyle{A \over {w \times x\sqrt {2\pi}}} \exp \left( { - \displaystyle{{{\left( {\ln (x/x_{\rm c})} \right)}^2} \over {2 \times w^2}}} \right)$$
where “w” represents the standard deviation and “x c” is the mean particle size with a fitted value of 0.17 and 8.7 nm respectively.
(a) TEM image of GNPs at a 100k magnification. (b) Particle size distribution histogram and (c) IR transmission spectra of GNPs, ESP, and 100 ppm ESP in 0.5 mL GNP solutions in the 4000–4500 cm−1 region.

The IR transmission spectra of GNPs, ESP, and 100 ppm ESP in 0.5 mL GNP solutions are recorded in the 4000–4500 cm−1 region are shown in Fig. 1(c). The stretching and bending vibrations of different bonding groups present in GNPs, ESP, and the final blue colored solution obtained after their reaction are observed as strong, medium, and weak intensity bands. The IR transmittance spectrum of GNPs shows the strong broad antisymmetric stretching and bending vibrations of water with the maxima at ~3300 and 1640 cm−1, respectively. The atmospheric CO2 stretching broad hump is located at 2130 cm−1. The very weak intensity peaks of carboxylate anion stretching and Au–O stretching modes are observed at 1373, 1239, 1092, 983, 580, and 541 cm−1, respectively. The IR transmission spectrum of ESP shows peaks at 3400−3200, 2935, 1605, (1481, 1452, 1296, 1245), 1193, 1095, (979, 916), 879, 858, (792, 753), 699, 674, 623, (580 and 538) cm−1 pertaining to water stretching, methylene stretching, conjugated –COOH stretching mode of capped citrate, water bending, skeletal ring C=C, CH2 scissoring, C–OH, carboxylate ion stretching, S–O, and C–O–S stretching modes of the sulphite group, C–O rocking, C–Cl stretching, O–S=O, C–Cl, R–SO3 and SO3 bending modes are observed and tentatively assigned,[Reference Anguita, Silva, Burden, Sealy, Haq, Hebbron, Sturland and Pritchard27–Reference Oxtoby and Nachtrieb32] whereas the 100.00 ppm ESP : 0.5 mL GNP solution reveals the demineralization of ESP and disappearance of the characteristic C–Cl and –SO3 peaks of ESP bonding groups.
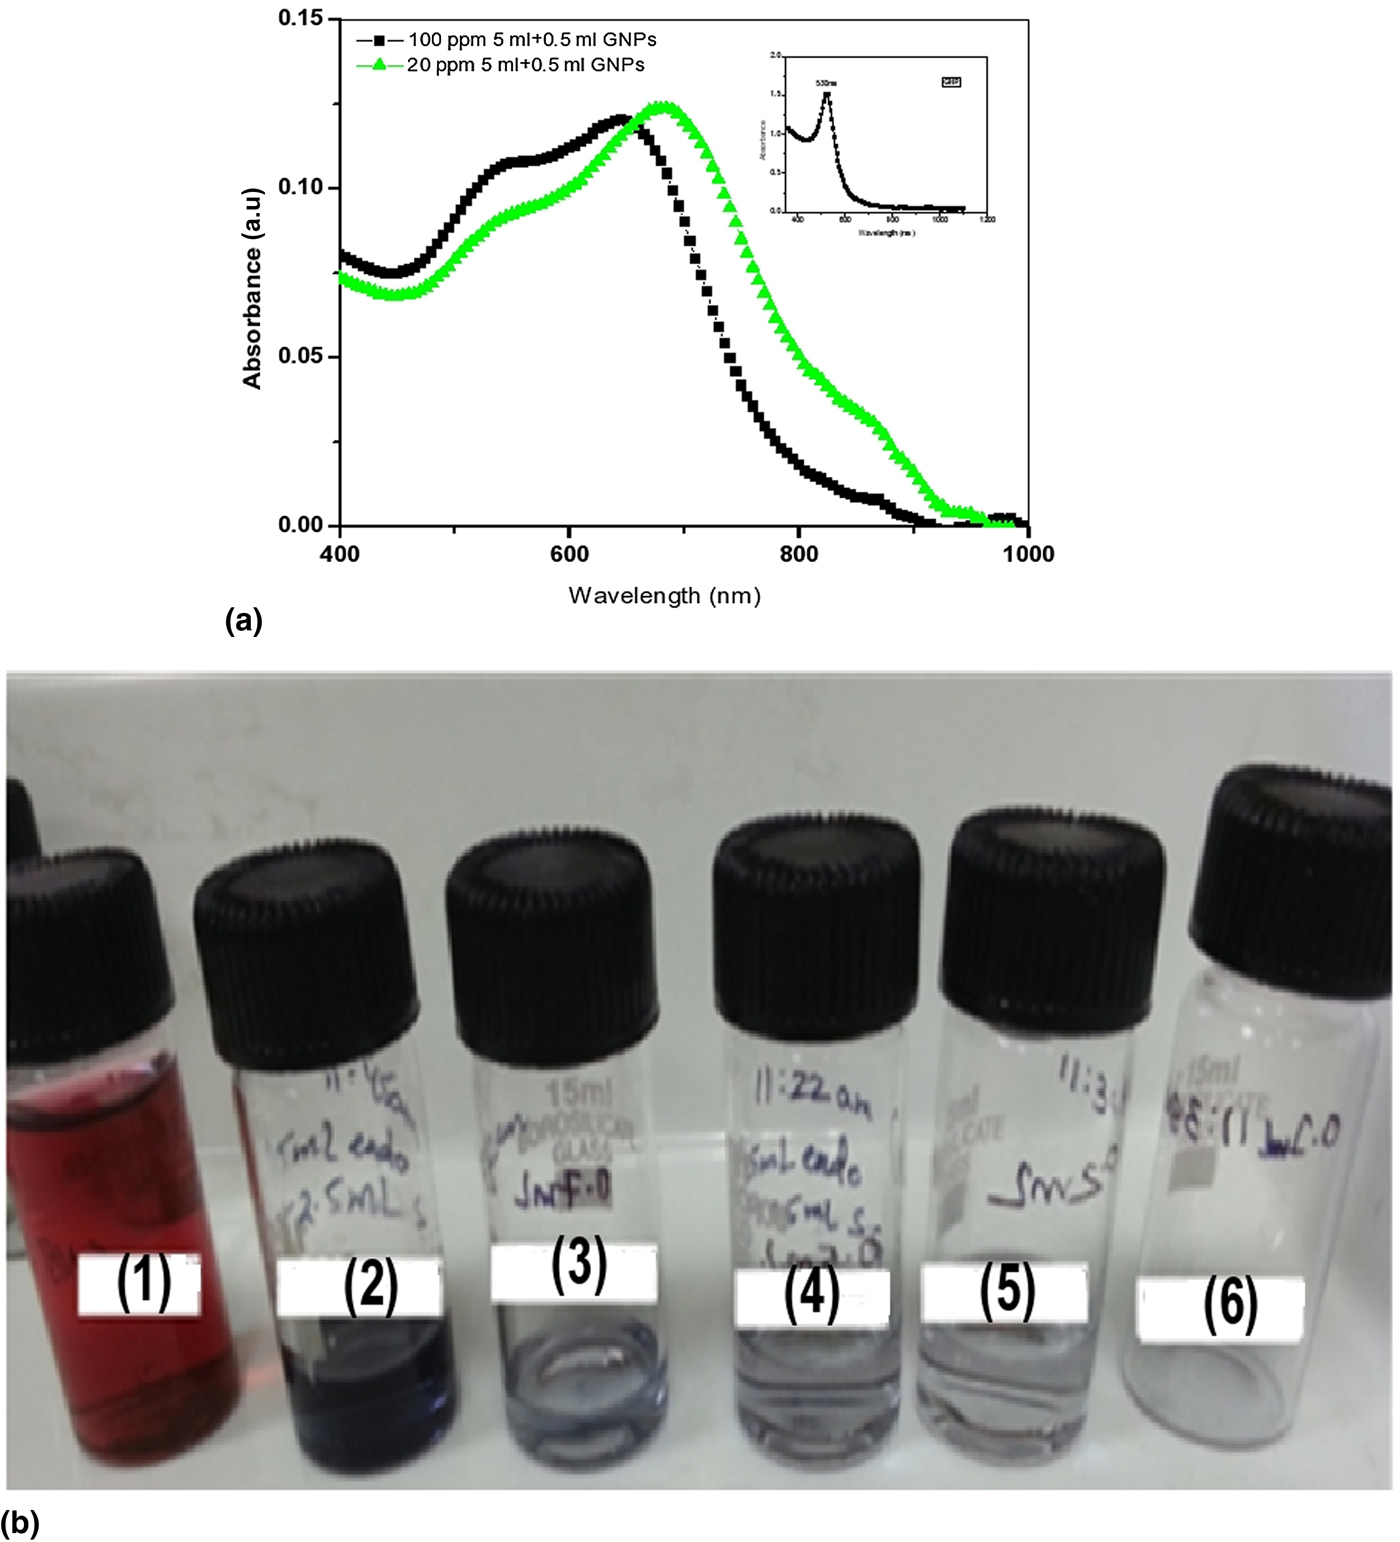
SPR absorption from uniformly dispersed nobel metal nanoparticles was observed by UV–Vis spectroscopy. The colloidal solution of GNPs capped by citrate (particle size ~8 nm in the present case) of deep wine red color originating from the coherent electron motion, and exhibits SPR absorption at 530 nm in the UV–Vis spectrum [Fig. 2(a), inset]. After addition of different concentrations of ESP solution to 0.5 mL GNPs solution, the intensity of SPR absorption enhances with the increase in the ESP concentration from 1.00 ppm solution to 100 ppm with a shift to a higher wavelength from 530 to 535 nm [Fig. 2(a) shows 5 mL of 20 ppm ESP : 0.5 mL GNP and 5 mL of 100 ppm ESP : 0.5 mL GNP samples].
(a) UV–Vis spectra of GNPs (inset), 20 ppm ESP : 0.5 mL GNPs and 100 ppm ESP : 0.5 mL GNP solutions. (b) Colorimetric changes in different amounts of GNP solution on exposure to a fixed amount of 100 ppm ESP solution: (1) pure GNPs, (2) 5 mL 100 ppm ESP : 1 mL GNPs, (3) 5 mL 100 ppm ESP : 0.7 mL GNPs, (4) 5 mL 100 ppm ESP : 0.5 mL GNPs, (5) 5 mL 100 ppm ESP : 0.2 mL GNPs, and (6) 5 mL 100 ppm ESP : 0.1 mL GNPs.

The change in the solution color is also observed i.e., wine deep red to blue colored precipitates with the discoloration of the GNP colloidal solution which can be seen in Fig. 2(b). At the same time, a second band arising from the formation of aggregates of GNPs is observed in the 675–695 nm region which shifts to lower wavelength with increasing ESP concentration. It can be seen that for higher concentrations of endosulfan, the absorption of the aggregates suffers from a shift to lower energies and also a decrease in the intensity of the optical absorption. These variations are attributed to the formation of clusters and their reorganization in a non-patterned or patterned manner, structures of agglomerated larger sized GNP assemblies as compared with their individual sized nanoparticles.
Hence, these studies revealed that citrate ion capped GNPs can interact with ESP in two ways viz. (i) ESP adsorbs on the surface of GNPs and linked via weak hydrogen bonding via sulphite O with the GNP capped citrate –COOH group and (ii) catalytic activity of GNPs which initiates the process of demineralization of ESP.
Proposed mechanism for GNP-based pesticide chemical sensors
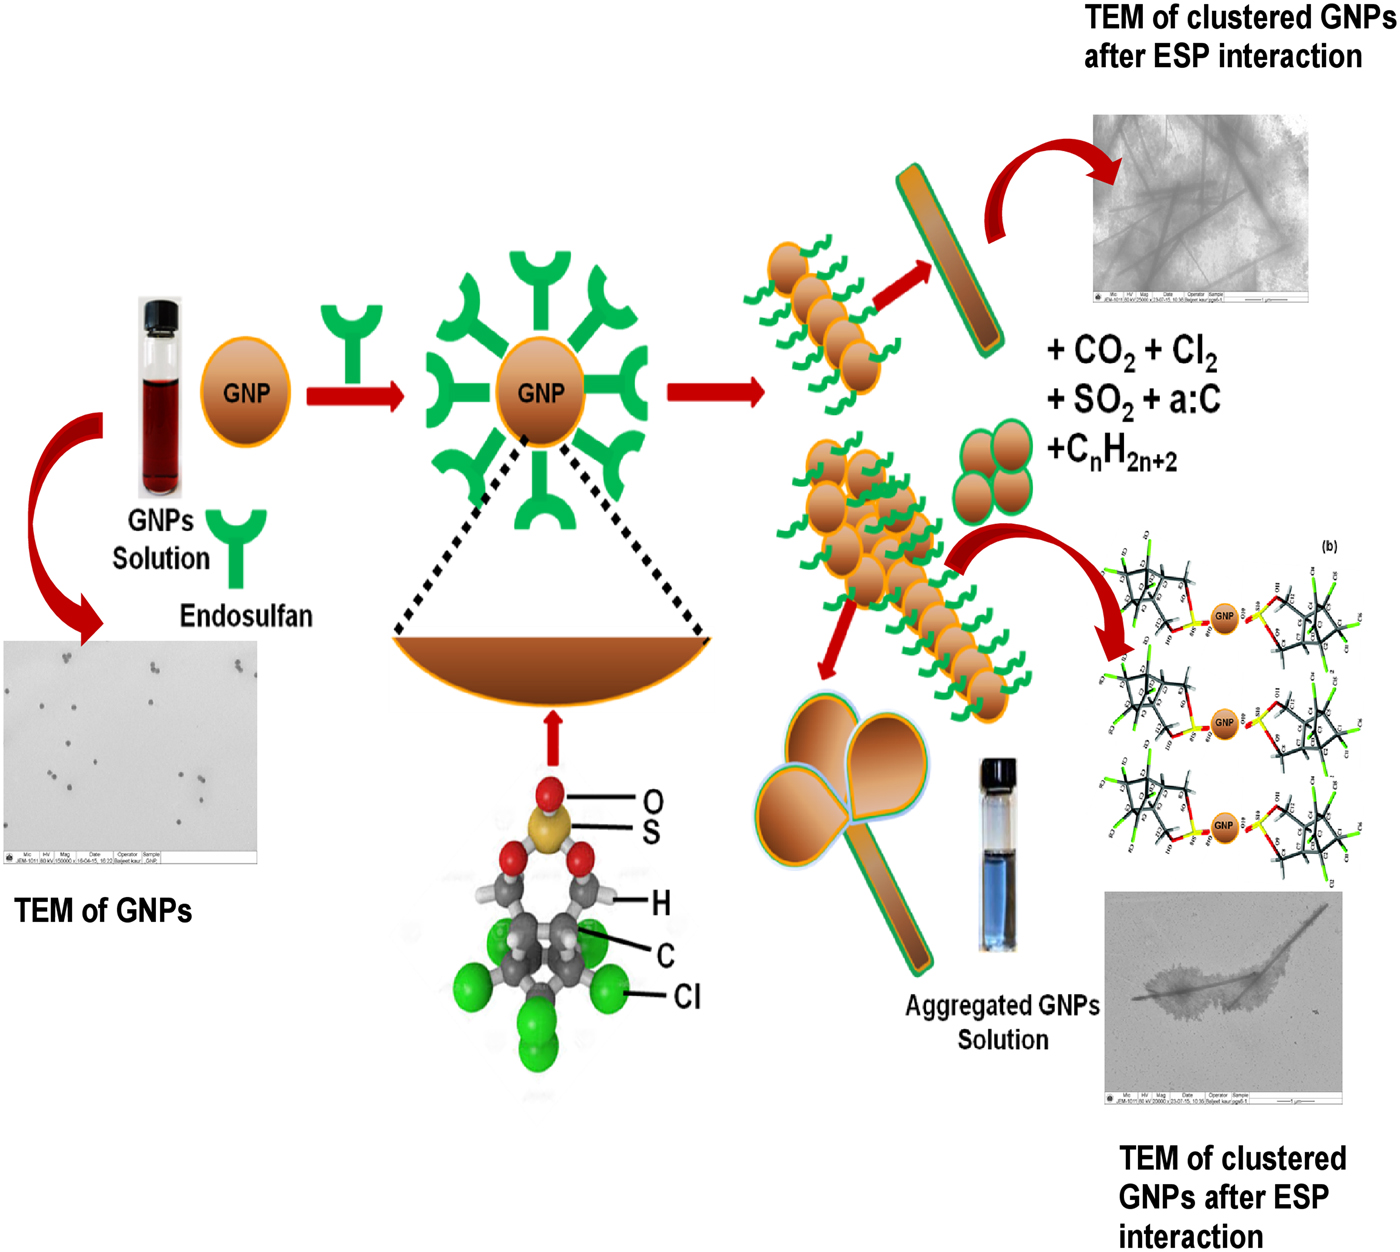
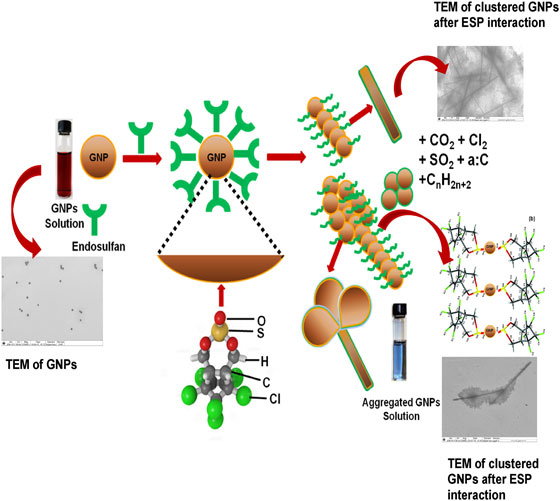
The excellent electrical conductivity, large surface area, and catalytic properties of GNPs encourage their usage as sensing electrodes in resistive, electrochemical, and electrocatalytic sensors. In the present case, the design of GNP-based pesticide sensors has been proposed with preliminary results. This sensor works on the principle of change in electrical resistance on exposure to different concentrations of pesticide or GNPs at ambient temperature. The concentration, density, and size distribution of GNPs play a crucial role in the sensitivity of pesticide detection. The catalytic nature of GNPs initiates the interaction of ESP through the SO3 functional group oxygen which causes the rearrangement of GNPs in the form of patterned and non-patterned clusters along with simultaneous mineralization of ESP into non-toxic alkanes, amorphous carbon in residual solution, and evolution of carbon dioxide, sulfur dioxide, and chlorine gases into the atmosphere as shown in Fig. 3.
Proposed mechanism of ESP degradation after interaction with GNPs.

Design of the sensor
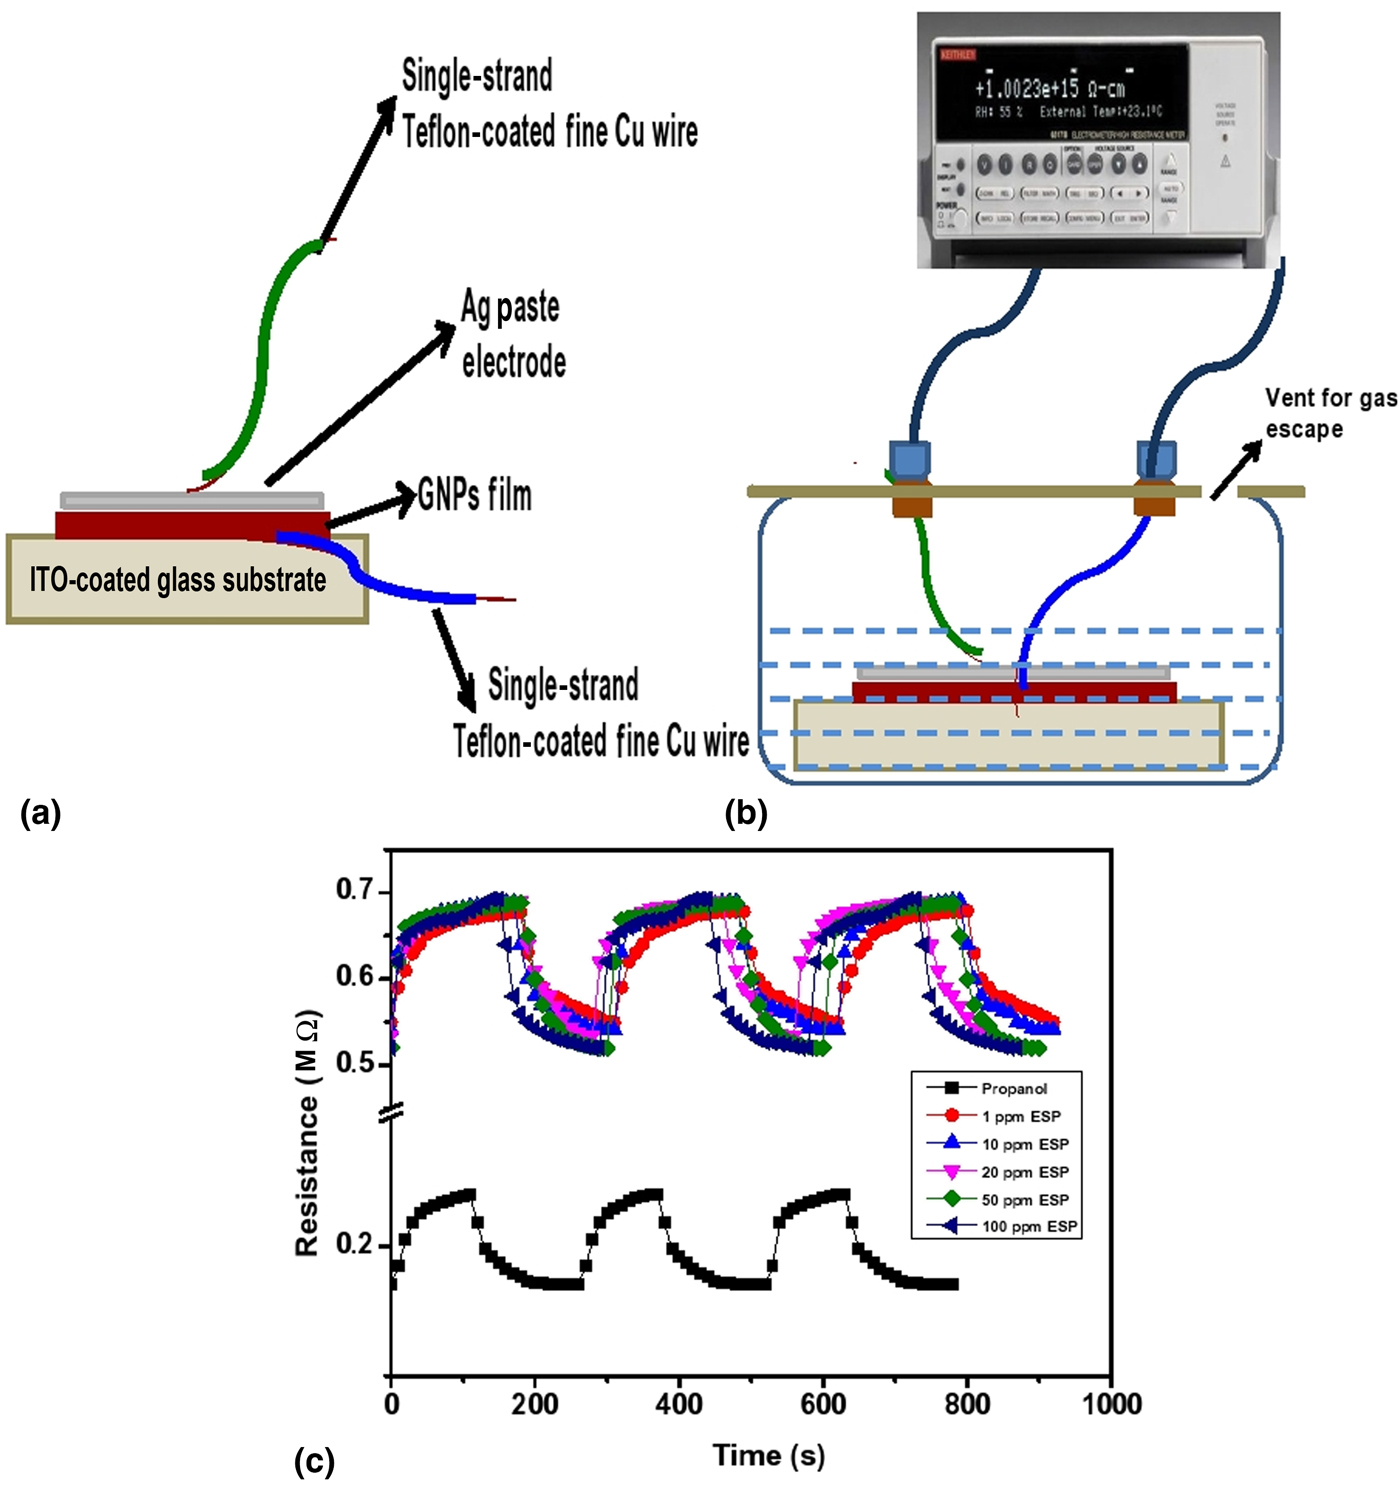
The electronic properties of spin coated GNP films (d = 25 mm, thickness = 100 nm, no. of coatings = 15) on an indium tin oxide (ITO) coated glass plate are optimized by varying the thickness of film, tuning of particle size, and spin rate. As we know that chemiresistors are basically solid-state devices whose sensitivity depends upon the changes in electrical resistance upon interaction with a chemical species through physical adsorption or chemical interaction. In the past decade, the number of researchers have reported chemiresistor vapor sensors based on functionalized GNPs for the detection of toluene and tetrachloroethylene, with a detection limit of ~1 ppm. The response of sensor is sensitive to the nature of functional groups present in the GNP capping agent and their interaction with the binding group present in pesticides. On exposure to propanol solvent and different concentrations of ESP in propanol solutions, the fast increase in resistance was observed. The schematic of the sensing electrode and setup are shown in Figs. 4(a) & 4(b).
Schematic of (a) sensing electrode (b) design for GNP-based chemical sensor, and (c) variation of resistance with time at 25 °C for propanol, 1.0, 10.0, 20.0, 50.0, and 100 ppm concentration of ESP solution on interaction with the GNP sensing electrode.

Working of the sensor
A micropipette was used to inject propanol for the control experiment and ESP solution into a covered glass chamber with a syringe through the inlet (vent for gas escape). The resistance of GNP coated ITO glass substrate was measured before and after exposure to propanol and ESP solutions using a Keithley 2000 multimeter at a 2 V bias voltage. To ensure the repeatability of the data, a series of experiments were carried out. Further, similar measurements were performed at different ESP concentrations to check the stability of the sensor and its level of detection. The resistance versus time curves of this chemical sensor at 25 °C, for propanol and 5 mL solution of 1.0, 10.0, 20.0, 50.0, and 100.0 ppm ESP solutions on interaction with the GNP sensing electrode are presented in Fig. 4(c). This sensor comprises a sensing electrode working on the principle of surface porosity of GNPs, having a low level of interlinkage with enhanced high sorption capacity and high sensitivity for the analytes. Initially, the resistance increases as evidenced from the positive electrical signal, by the physical adsorption of the analyte in a pored network and their chemical interaction through weak hydrogen bonding with functional groups present on their surface. While the decrease in resistance during the experiments i.e., the negative electrical signal is attributed to the phenomena of pore filling by the linker length growth. The selectivity of analyte uptake of the films is comparable for all materials due to the similar chemistry of the linker molecules.[Reference Daskal, Dittrich, Walter and Joseph33]
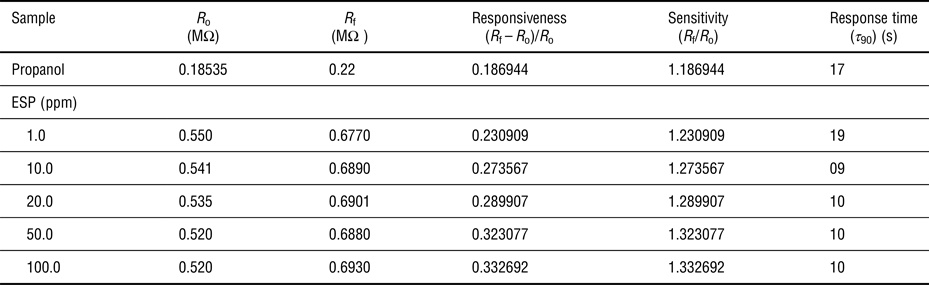
The quality of a chemical sensor depends upon responsiveness, sensitivity, and response time parameters. The responsiveness S is defined as S = (R f − R o)/R o where R f is the electrical resistance of the sensor in air and R o is its resistance in the ESP solution. The sensitivity of the sensor is defined as R f/R o. The response time is the time required for the sample resistance variation to reach 90% of the equilibrium value following a step increase in the concentration of the pesticide solution under test. The values of resistance, responsiveness, sensitivity, and response time of the GNP-based ESP sensor derived from the response and recovery curves are listed in Table I. The sensor resistance is higher in the ESP solution than in air and it increases on increasing ESP concentration. The sensor repeatability was tested in three cycles. Each cycle completes in about 300 s. The resistance increases sharply in the first 25–30 s and then increases very slowly up to 175–180 s. Once the reaction completes in about 180 s then resistance falls very fast. A similar process repeats in the second and third cycles. These results show that responsiveness, sensitivity, and time constant are practically constant (with minor deviations) with consistency in repeatability.
Responsiveness, sensitivity, and response time of propanol, 1.0, 10.0, 20.0, 50.0, and 100 ppm, concentration 5 mL of ESP solution on interaction with the GNP sensing electrode.

Conclusions
This work discusses the design and development of GNP-based ESP chemical sensors for the safety of the mankind and environmental monitoring. GNPs prepared by the citrate route of very uniform size (~8 nm) and size distribution were used in the present studies for the detection of ESP as colorimetric sensors. Due to catalytic nature of GNPs, they help in the degradation of ESP into non-toxic reaction products. This process reduces the inter-particle distance between the GNPs to encourage their clustering and drastic increase in resistance. Further, the design of the fabrication of GNP-based resistive chemical sensors for the quantitative estimation of ESP has been proposed. The sensing mechanism is discussed in terms of the interaction of ESP on the surface of GNPs via O of the SO3 polar functional group present in ESP through weak hydrogen bonding and catalytic nature of GNPs which initiates the decomposition of ESP. The response and recovery curves of this chemical sensor were studied at 25 °C, for 5 mL solution of 1.0, 10.0, 20.0, 50.0, and 100.0 ppm ESP compositions with the GNP sensing electrode. The sensor resistance has been found to increase with the ESP concentration and the data exhibit good repeatability. The responsiveness, sensitivity and time constant show minor deviations with consistent repeatability.
Acknowledgments
The authors sincerely thank V.C., G.B.P.U.A.T. for continuous encouragement and interest in this work. One of the authors (P. Goel) is also thankful to DST, New Delhi for financial support under INSPIRE Faculty Scheme (IFA12-PH-38).