This article tests whether the two prototypes specified by a developmental taxonomy of antisocial behavior, life-course persistent (LCP) and adolescence limited (AL), can be identified within a prospective birth cohort of females and males via general growth mixture modeling (GGMM). Advanced longitudinal methods are applied to test taxonomic predictions regarding developmental course, childhood origins, and adult consequences, with particular attention to the study of gender differences in antisocial behavior.
Until recently, interest and research directed at understanding trajectories of antisocial behavior has focused primarily on males (Lacourse, Nagin, Tremblay, Vitaro, & Claes, Reference Lacourse, Nagin, Tremblay, Vitaro and Claes2003; Schaeffer, Petras, Ialongo, Poduska, & Kellman, 2003; Shaw, Lacourse, & Nagin, Reference Shaw, Lacourse and Nagin2005; Tremblay et al., Reference Tremblay, Nagin, Seguin, Zoccolillo, Zelazo and Boivin2004; Wiesner & Capaldi, Reference Wiesner and Capaldi2003). Classic longitudinal studies in life-course criminology and developmental psychology have established the importance of childhood-onset conduct problems and early involvement in antisocial behavior in predicting future crime among males (Elliott, Huizinga, & Menard, Reference Elliott, Huizinga and Menard1989; Farrington, Reference Farrington1989; Farrington, Reference Farrington1995; Wolfgang, Thornberry, & Figlio, Reference Wolfgang, Thornberry and Figlio1987). Over the last decade, research generated by a developmental taxonomy of antisocial behavior has refined our understanding of the importance of childhood-onset behavioral problems by delineating, and testing, expectations regarding the unique developmental course, childhood origins, and adult prognosis for males on the LCP versus AL pathways (Moffitt, Reference Moffitt, Cicchetti and Cohen2006; Moffitt, Capsi, Harrington, & Milne, 2002). The original statement of the taxonomy asserted that the theory should account for the behavior of females as well as it accounts for the behavior of males (Moffitt, Reference Moffitt, Wietekamp and Kerner1994). To date, however, the majority of empirical research has focused on males, and we know relatively little about the relevance of the developmental taxonomy to females.
In a nutshell, the original developmental taxonomy of antisocial behavior proposed that at least two prototypical subtypes underlie the observed age by crime distribution (Moffitt, Reference Moffitt1993): an LCP pathway that is characterized by social, familial, and neurodevelopmental deficits, onsets in early childhood, and distinguishes a relatively small, yet persistent and pathological subgroup of individuals, and an AL pathway that is hypothesized to be more common, relatively transient, and near normative. AL involvement in antisocial behavior is believed to emerge alongside puberty as a relatively normative response to the roleless years between biological maturation and access to mature privileges and responsibilities, a period of time labeled the “maturity gap.” Although those on the LCP pathway are expected to experience multiple problems in adulthood, AL individuals, given the normative nature of their preteen development, are hypothesized to be more successful in their transition to adulthood, provided that they do not encounter snares, such as substance dependency or a criminal record.
The original statement of the taxonomy was intended to apply to females as well as males (Moffitt, Reference Moffitt, Wietekamp and Kerner1994; Moffitt et al., Reference Moffitt, Caspi, Rutter and Silva2001). Within the developmental taxonomy, much of the gender difference in levels of antisocial behavior is attributed to gender differences in the individual risk factors for persistent antisocial behavior; research has consistently shown that girls have lower rates than boys of symptoms of nervous system dysfunction, difficult temperament, hyperactivity, reading failure and learning disabilities (Gorman-Smith & Loeber, Reference Gorman-Smith and Loeber2005; Lahey et al., Reference Lahey, Van Hulle, Waldman, Rodgers, D'Onofrio and Pedlow2006; Messer et al., Reference Messer, Goodman, Rowe, Meltzer and Maughan2006). Thus, the consequent processes of cumulative continuity ensue for fewer girls than boys, resulting in a smaller number of girls following the LCP pathway. The AL pathway is also hypothesized to be open to females. According to the theory, girls, like boys, should begin engaging in antisocial behavior soon after puberty to the extent to which they have access to antisocial role models and perceive the consequences of antisocial behavior as reinforcing. Although girls, because of gender-typed socialization, may experience heightened perceptions of serious personal risk associated with involvement in antisocial behavior, it is expected that females should engage in AL antisocial behavior in significant numbers and should resemble their male AL counterparts by having few childhood deficits and many delinquent peers during adolescence (Moffitt, Reference Moffitt, Wietekamp and Kerner2004). In short, the taxonomy predicted females are seldom LCP but are often adolescent limited, and the childhood correlates of both subtypes are assumed to be similar across gender (Moffitt et al., Reference Moffitt, Caspi, Rutter and Silva2001).
Although still in its infancy, the study of girls' involvement in antisocial behavior and aggression has grown significantly over the last 2 decades (Giordano, Cernkovich, Stoff, Breiling, & Maser, Reference Giordano, Cernkovich, Stoff, Breiling and Maser1997; Moffitt et al., Reference Moffitt, Caspi, Rutter and Silva2001; Moretti, Odgers, & Jackson, Reference Moretti, Odgers and Jackson2004; Odgers & Moretti, Reference Odgers and Moretti2002; Pepler, Madsen, Webster, & Levene, Reference Pepler, Madsen, Webster and Levene2005; Putallaz & Bierman, Reference Putallaz and Bierman2004; Serbin, Peters, McAffer, & Schwartzman, Reference Serbin, Peters, McAffer and Schwartzman1991; Underwood, Reference Underwood2003). As researchers begin to piece together information from across diverse samples, the question of whether female-specific theories of antisocial behavior are required is beginning to come into focus. To date, however, there is no comprehensive theory of the development of antisocial behavior that is specific to females. Because the vast majority of female antisocial behavior onsets in adolescence, some researchers have argued that a childhood-onset LCP subtype may not exist for girls and, instead, only an adolescent-onset subtype is required to characterize girls' antisocial behavior (Silverthorn & Frick, Reference Silverthorn and Frick1999). Although new research is still emerging, to date, virtually all epidemiological studies testing whether gender-specific pathways of antisocial behavior exist have identified a “childhood-onset” or “early-starter” pathway among females (Bongers, Koot, van der Ende, & Verhulst, Reference Bongers, Koot, van der Ende and Verhulst2004; Broidy et al., Reference Broidy, Nagin, Tremblay, Bates, Brame and Dodge2003; Coté, Tremblay, Nagin, Zoccolillo, & Vitaro, Reference Coté, Tremblay, Nagin, Zoccolillo and Vitaro2002; Fergusson & Horwood, Reference Fergusson and Horwood2002; Lahey et al., Reference Lahey, Van Hulle, Waldman, Rodgers, D'Onofrio and Pedlow2006; Schaeffer et al., Reference Schaeffer, Petras, Ialongo, Masyn, Hubbard and Poduska2006). For example, in an analysis of epidemiological samples from Canada, New Zealand, and the United States, Broidy and colleagues (2003) identified an early-onset pathway of girls, based on teacher reported aggression, in three of the four samples. Similarly, Coté and colleagues, in a representative study of Canadian girls, identified two early-starter pathways of antisocial behavior (aggressive plus oppositional behaviors) that went on to have higher rates of conduct disorder (CD) than later starters. More recently, both Schaeffer and colleagues (2006) and Lahey and colleagues (2006) reported finding early-starter subgroups of females who demonstrated chronically high levels of antisocial behavior across childhood and early adolescence; these early-starter girls, like their male counterparts, were at an increased risk for later antisocial outcomes.
Although initial evidence suggests that an early-onset pathway for girls may exist, there has not yet been a comprehensive test of the extension of the developmental taxonomy of antisocial behavior to females with respect to developmental course, childhood origins, and adult outcomes. In the present study we tested whether predictions stemming from the developmental taxonomy hold in a birth cohort of females and males that have been followed prospectively until age 32. With a specific emphasis on age 32 findings, we addressed three sets of questions:
1. Developmental course: Do the three subgroups anticipated by the developmental taxonomy, namely, LCP, AL, and low antisocial pathways, emerge among females and males in a 30-year prospective birth cohort study? Is an additional subgroup needed? A recent review (Moffitt, Reference Moffitt, Cicchetti and Cohen2006) summarized the growing body of empirical evidence for antisocial subgroups not originally specified by the taxonomy; these subgroups, labeled, “childhood limited” (Farrington, Gallagher, Morley, Stledger, & West, Reference Farrington, Gallagher, Morley, Stledger and West1988; Moffitt, Caspi, Dickman, Silva, & Stanton, Reference Moffitt, Caspi, Dickson, Silva and Stanton1996; Wiesner & Capaldi, Reference Wiesner and Capaldi2003) and “low-level chronic” (D'Unger, Land, McCall, & Nagin, Reference D'Unger, Land, McCall and Nagin1998; Nagin, Farrington, & Moffitt, Reference Nagin, Farrington and Moffitt1995) have emerged across a number of longitudinal studies, but do not yet have well-articulated theories regarding etiology, developmental course, and prognosis. Thus, the present study applied the latest generation of trajectory-based modeling techniques, GGM (Muthén, Reference Muthén and Kaplan2004), to test whether the original subtypes of LCP and AL antisocial behavior emerged, with an eye toward investigating whether an additional subgroup(s) was required. Moreover, prior research has not tested whether the same behaviors tap the construct of antisocial behavior in the same way across development and gender. In other words, it has been assumed that administering the same measure across time, and across males and females, provides a common valid metric for assessing antisocial behavior. In the current study, we empirically test this assumption and evaluate whether our measure of antisocial behavior is invariant across both time and gender prior to mapping developmental trajectories.
2. Childhood origins: Are the childhood origins for the LCP and AL subgroups consistent with expectations from the taxonomy? That is, similar to their male counterparts, females on the LCP pathway are expected to be characterized by social, familial, and neurodevelopmental deficits in childhood. In contrast, those on the AL pathway should score closer to the low antisocial subgroup (or average Dunedin child) on childhood risk factors. Previous work with males in the Dunedin study has demonstrated that LCP antisocial behavior is differentially predicted by these childhood risk factors (Moffitt & Caspi, Reference Moffitt and Caspi2001), with the same risk factors documented for the small number of females classified as belonging to the LCP pathway (Moffitt et al., Reference Moffitt, Caspi, Rutter and Silva2001). However, prior research has relied on classifications derived via clinical algorithms. In the present study, subtypes are defined using trajectory-based statistical models and validated using a subset of childhood risk indicators selected from extensive analyses of earlier waves of the Dunedin Study.
3. Adult outcomes: Do predictions stemming from the taxonomic theory regarding adult outcomes demonstrate predictive validity among females? Specifically, do women on the LCP pathway experience the worst adult consequences at age 32? Prior work with Dunedin females has demonstrated that CD during adolescence predicted a wide range of negative outcomes in early adulthood (Bardone, Moffitt, Caspi, & Dickinson, 1996) and previous publications report Dunedin males' outcomes age 26 (Moffitt et al., Reference Moffitt, Caspi, Harrington and Milne2002) and age 32 (Odgers, Caspi, et al., Reference Odgers, Caspi, Broadbent, Dickson, Hancox and Harrington2007); however, it is not known whether adult outcomes vary across distinct developmental subtypes of antisocial females or whether poor prognosis in adulthood extends to include poor physical health. Thus, this paper differs from prior publications in that it (a) focuses on developmental trajectories for females, along with male comparisons; (b) formally tests whether antisocial behavior is being measured in the same way across males and females; and (c) expands the range of adult outcomes to the age of 32 to include assessments of violence, mental health, physical health, and economic problems among both males and females.
Method
Participants
Participants are members of the Dunedin Multidisciplinary Health and Development Study. The cohort of 1,037 children (52% male) was constituted at 3 years of age, when investigators enrolled 91% of consecutive eligible births between April 1972 and March 1973 in Dunedin, New Zealand. Cohort families represent the full range of socioeconomic status (SES) in New Zealand's South Island and are primarily White. Follow-up assessments were conducted with informed consent at ages 5, 7, 9, 11, 13, 15, 18, 21, 26, and 32 years of age, when 96% of the living Study members were assessed in 2003–2005. Cross-national comparisons lend confidence regarding the generalization of findings from the Dunedin study to other industrialized nations (Moffitt et al., Reference Moffitt, Caspi, Rutter and Silva2001).
Measures
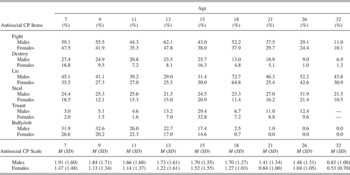
Antisocial conduct problems were measured at ages 7, 9, 11, 13, 15, 18, 21, and 26 years through scoring six key symptoms of DSM-IV CD as being present or absent at each age: physical fighting, bullying others, destroying property, telling lies, truancy, and stealing (American Psychiatric Association, 1994). A composite score, ranging from 0 to 6, was formed at each assessment age representing the number of different types of antisocial behavior the individual had engaged in during the past year (antisocial conduct problems “variety score”). Variety scores are highly correlated with frequency scores (how often the child exhibited antisocial behavior in the past year) and are commonly used in population-based studies. Other DSM-IV CD symptoms were not used because they did not cover the study's age span (e.g., running away, staying out late) or had very rare prevalence (e.g., fire setting, forced gender, animal cruelty). Each of the six conduct problem symptoms was operationalized through multiple items collected at each age: the symptom was considered present if any item in the set was endorsed by a reporter. Symptoms were adapted across the age span to ensure that the measures were developmentally appropriate. “Truancy” included items such as skipping school for younger students and work absenteeism for older employed Study members; “bullying” included items such as bullying other children, threatening violence, and at older ages, robbery; “stealing” included items such as stealing from school or home, shoplifting, auto theft, burglary, absconding from a rental with unpaid bills or rent, and embezzlement from employers. “Fighting” included items such fights with other children, fighting in the street, gang fighting, and assault. “Telling lies” included items such as tells lies to parents and teachers, lying about their age, and providing false information on job or loan applications. “Destroying property” included items such as purposely destroying or damaging other's property. The study's reporting sources were also developmentally appropriate, including parent and teacher in childhood; self, parent, and teacher in adolescence; and self alone in adulthood. The prevalence of each CD symptom and average scale scores by age and gender are included in Table 1; with the exception of age 15, males scored significantly higher than females on antisocial conduct at every assessment age. The reliability values for the scale ranged from α > .60 between ages 7 and 15 and α > .50 between ages 18 and 26.
Frequencies of antisocial conduct problem items by age and gender

Note: CP, conduct problems. Truancy was not assessed at age 32; the differences between antisocial conduct problem scale scores for males versus females are statistically significant (p < .001) at all ages, except for age 15 (p = .08).
Childhood predictors
Each childhood measure is described briefly, accompanied by a reference that reports details of data collection, variable construction, reliability, and validity. The measures in this cohort are described in Moffitt et al. (Reference Moffitt, Caspi, Rutter and Silva2001, Reference Moffitt, Caspi, Harrington and Milne2002) unless otherwise specified. All measures have a reliability of >.70, as assessed by internal consistency, test–retest, or interrater analysis, as appropriate. The childhood measures listed below were selected based on extensive analyses of earlier waves of data in the Dunedin Study.
Family characteristics and context
SES was measured as the highest of father's or mother's occupation using a 6-point scale for New Zealand (Elley & Irving, Reference Elley and Irving1976); 21% of the families were classified as low SES, 63% as medium SES, and 16% as high SES.
Maltreatment was measured using staff observations of rejecting mother–child interaction at age 3, parental reports of harsh discipline at ages 7 and 9, two or more changes in primary caregiver to age 11, and retrospective reports by study members at age 26 of injurious physical abuse or unwanted sexual contact before age 11. Nine percent of boys and girls had two or more indicators of maltreatment (Caspi et al., Reference Caspi, McClay, Moffitt, Mill, Martin and Craig2002).
Family conflict was measured at ages 7 and 9 with the Moos Family Relations Index (Moos & Moos, Reference Moos and Moos1981) completed by mothers of the study members. The conflict subscale contained items such as, “In our family, we believe you don't ever get anywhere by raising your voice” and “Family members sometimes hit each other.”
Inconsistent discipline was measured at ages 7 and 9 as part of an interview about how parents dealt with the study child when he or she misbehaved. Mothers evaluated their own discipline, as well as their husband's discipline on a 4-point scale (1 = always the same; 4 = very changeable).
Parental features
Mother's mental health problems were measured with the Malaise Inventory, a 24-item questionnaire that was completed by the Study members' mothers when the study members were 7 and 9. The questionnaire (Rodgers, Pickles, Power, Collishaw, & Maughan, Reference Rodgers, Pickles, Power, Collishaw and Maughan1999; Rutter, Tizard, & Whitmore, Reference Rutter, Tizard and Whitmore1970) samples a variety of common symptoms of emotional disturbance, and is heavily weighted with items reflecting affective stress response (e.g., easily upset, miserable) and somatic symptoms (e.g., tiredness, headaches).
Mother's IQ was tested using the Science Research Associates (SRA) verbal test (Thurstone & Thurstone, Reference Thurstone and Thurstone1973) when the children were age 3; standardized to population (M = 100, SD = 15). Low mother IQ was defined as <85 on the standardized SRA score.
Parent criminal conviction was measured by parental report in 1998, when parents' ages ranged from 40 to 75. Of parents, 12% reported they had been convicted in the criminal courts.
Child factors
Child IQ was tested using the Wechsler Intelligence Scale for Children—Revised (WISC-R; Wechsler, Reference Wechsler1974) at ages 7, 9, 11, and 13, and the four values were averaged to enhance reliability; standardized to population (M = 100, SD = 15). Low child IQ was defined as <85 on the standardized WISC-R score.
Undercontrolled temperament was measured through staff ratings after observing the child in a 90-min testing session with an unfamiliar examiner at age 3. Factor and cluster analyses reduced these ratings to three temperament types, including the undercontrolled type (Caspi & Silva, Reference Caspi and Silva1995), since replicated in other samples (Asendorpf, Borkenau, Ostendorf, & Van Aken, Reference Asendorpf, Borkenau, Ostendorf and Van Aken2001; Hart, Atkins, & Fegley, Reference Hart, Atkins and Fegley2003; Robins, John, Caspi, Moffitt, & Silva, Reference Robins, John, Caspi, Moffitt and Silva1996). Full psychometric details are provided elsewhere (Caspi, Reference Caspi2000).
Heart rate was measured by nurse examiners at ages 7, 9, and 11. At each age, an average heart rate measure was derived from measures of resting heart rate taken by a nurse on three occasions during the course of the physical examination. The (age standardized) measures of resting heart rate from the three age periods were averaged to form the overall score.
Reading achievement was measured at ages 7, 9, and 11 by the Burt Word Reading Test (Scottish Council for Research in Education, 1976), a word recognition test having normative standards for New Zealand children, which resembles the American Wide-Range Achievement Test of reading. The (age standardized) reading scores from the three age periods were combined to form an overall score.
Attention-deficit/hyperactivity disorder (ADHD) was measured using the Diagnostic Interview for Children—Child Version (Costello, Edelbrock, Kalas, Kessler, & Klaric, Reference Costello, Edelbrock, Kalas, Kessler and Klaric1982) at ages 11, 13, and 15. Diagnoses were made according to the Diagnostic and Statistical Manual of Mental Disorders—Third Edition (DSM-III; American Psychiatric Association, 1980) and confirmed through parent or teacher report including age of onset before age 7; 6% of the cohort was diagnosed. Dunedin was the first cohort study to use a standard diagnostic interview in 1983 when study members were 11 years old. Therefore, information on ADHD symptoms reported by mothers and teachers on scales at ages 5 and 7 was used to confirm symptom onset before the age of 7 for DSM diagnosis.
Peer delinquency was assessed using 10 items from the Revised Problem Behavior Checklist (Quay, Reference Quay1983; Quay & Peterson, Reference Quay and Peterson1993) that was completed by the Study members' mothers when the study members were 15. The peer delinquency subscale contained 10 items, such as “belongs to a gang” and “associates with rougher peers,” measured on a 3-point scale (0 = no, does not apply, 1 = yes, applies somewhat, 2 = yes, certainly applies). Items were averaged to create an overall peer delinquency score.
Age 32 outcomes
Each age 32 outcome is described briefly, accompanied by a reference that reports details of data collection, variable construction, reliability and validity.
Age 32 violence toward others
Violence toward others was selected as the primary age 32 index of antisocial behavior as it represents the most serious form of antisocial behavior and is recognized as one of the most significant global health problems (Krug, Dahlberg, & Mercy, Reference Krug, Dahlberg and Mercy2002).
Partner abuse in the past year at age 32 was measured in a standardized interview about 13 physical abuse acts (e.g., slapping, strangling, kicking, hitting, beating up, forcing sex, and using a weapon) and 13 controlling abuse acts (e.g., damaging clothes, car or pet; stopping contact with family or friends; stalking). Dunedin men's and women's self-reports have been previously validated against their partners' reports and found to be reliable and valid (Moffitt et al., Reference Moffitt, Caspi, Krueger, Magdol, Margolin and Silva1997). Study members who reported any perpetration of physical abuse within a relationship were classified as engaging in physical abuse. Study members who engaged in two or more types of controlling behavior within the past year were classified as engaging in controlling abuse.
Hitting a child was assessed during the Self-Report Crime Interview. Study members were asked one item about hitting or otherwise hurting a child out of anger (Moffitt et al., Reference Moffitt, Caspi, Harrington and Milne2002).
Self-reported violence in the past year at age 32 was measured using the US National Youth Survey Self-Report Crime Interview (Elliott et al., Reference Elliott, Huizinga and Menard1989). Items ascertained simple assault, aggravated assault, gang fighting, robbery, arson, and forced sex (Moffitt et al., Reference Moffitt, Caspi, Harrington and Milne2002). Assaults against partners and children were excluded to avoid overlap with the abovementioned measures. Study members who reported engaging in at least one act of violence within the last year were classified as engaging in self-reported violence at age 32.
Informant-reported fighting in the past year at age 32 was measured by mailing a brief questionnaire to people nominated by the Study member as knowing him/her well (informants included friends, partners and family members). Full details of the Dunedin Study informant rating system are provided elsewhere (Moffitt et al., Reference Moffitt, Caspi, Harrington and Milne2002). Information from informants was available for 96% of study members seen at age 32. Informants were asked to rate whether the study member “got into fights” in the last 12 months (0 = not a problem, 1 = bit of a problem, 2 = yes, a problem); study members rated as 1 or 2 were classified as “getting into fights” at age 32.
Official violence convictions between ages 26 and 32 were measured by searching the computerized New Zealand Police database. Convictions included, but were not limited to: common assault, common domestic assault, assault of child, assault with a weapon, rape, indecent assault on female, robbery aggravated with a firearm, male assaults female with weapon, resisting police, and arson.
Age 32 mental health
Psychiatric disorders during the past year at age 32 were assessed in private structured interviews using the Diagnostic Interview Schedule (DIS; Robins, Cottler, Buckholz, & Compton, 1995). Diagnoses were made according to DSM-IV criteria (American Psychiatric Association, 1994). Prevalence rates in the Dunedin cohort are similar to those from American epidemiological surveys (Kessler, McGonagle, Swartz, Blazer, & Nelson, Reference Kessler, McGonagle, Swartz, Blazer and Nelson1993; Newman et al., Reference Newman, Moffitt, Caspi, Magdol, Silva and Stanton1996). For this report, we examined grouped anxiety disorders (generalized anxiety disorder, obsessive–compulsive disorder, panic disorder, agoraphobia, social phobia, and simple phobia), major depressive disorder, cannabis dependence, dependence on other drugs, alcohol dependence, and posttraumatic stress disorder.
Suicide attempts in the 5 years between ages 26 and 32 were measured using a Life History Calendar (Belli, Shay & Stafford, Reference Belli, Shay and Stafford2001; Caspi et al., Reference Caspi, Moffitt, Thornton, Freedman, Amell and Harrington1996).
Informant reports of internalizing symptoms and substance use were collected using the informant rating system referenced above. Informants rated the study member's impairment on three symptoms of anxiety (e.g., “has unreasonable fears or worries,” “worries a lot,” “gets nervous easily”), and four symptoms of depression (e.g., “feels that no one loves them,” “seems lonely,” “feels depressed, miserable, sad, or unhappy,” “talks about suicide”) using a 3-point scale (0 = no, does not apply, 1 = yes, applies somewhat, 2 = yes, certainly applies). The seven symptoms were combined to form an internalizing scale; individuals scoring 1 SD above the mean were classified as experiencing informant-rated internalizing problems (Moffitt et al., Reference Moffitt, Caspi, Harrington and Milne2002).
Informant reports of substance use problems were also collected using the informant rating system referenced above. Informants rated the study member on two items (e.g., “has alcohol problems,” “has marijuana or other drug problems”) using a 3-point scale (0 = no, does not apply, 1 = yes, applies somewhat, 2 = yes, certainly applies). Study members rated as 1 or 2 on either item were rated as experiencing informant-rated substance use problems (Moffitt et al., Reference Moffitt, Caspi, Harrington and Milne2002).
Age 32 physical health
Cardiovascular disease (CVD) risk
Because the cohort is still too young to present clinical endpoints of cardiovascular disease (e.g., myocardial infarction), we focused on multiple risk-factor clustering as a measure of cardiovascular risk as recommended by chronic disease epidemiologists (Grundy, Posternak, Greenland, Smith, & Fuster, Reference Grundy, Pasternak, Greenland, Smith and Fuster1999; Munoz & Gange, Reference Munoz and Gange1998). Six biomarkers were used: overweight, high blood pressure, elevated total cholesterol, low high-density cholesterol, elevated glycated hemoglobin, and low maximal oxygen uptake. Study members were “clustered” if they had at least three of the aforementioned risk factors. Clinical definitions and the construction of each measure are reported elsewhere (Caspi, Harrington, Milne, Moffitt, & Paulton, Reference Caspi, Harrington, Milne, Moffit and Poulton2006).
High-sensitivity C-reactive protein (hsCRP) is thought be one of the most reliable measured indicators of vascular inflammation (Ridker, Wilson, & Grundy, Reference Ridker, Wilson and Grundy2004) and has been recently endorsed as an adjunct to traditional risk factor screening for cardiovascular risk by the Centers for Disease Control and Prevention and the American Heart Association (Pearson et al., Reference Pearson, Mensah, Hong and Smith2004; Ridker et al., Reference Ridker, Wilson and Grundy2004). Individuals with hsCRP higher than 3.0 mg/l were considered at high risk (Ridker et al., Reference Ridker, Wilson and Grundy2004). Full details of this measure are reported elsewhere (Danese, Pariante, Caspi, Taylor, & Poulton, Reference Danese, Pariante, Caspi, Taylor and Poulton2007).
Respiratory function was assessed using a computerized spirometer and body plethysmograph; technical details are provided elsewhere (Taylor et al., Reference Taylor, Fergusson, Milne, Horwood, Moffitt and Sears2002). Measurements of vital capacity (VC) were repeated to obtain at least three repeatable values (within 5%) followed by full-forced expiratory maneuvers to record the forced expiratory volume in 1 s (FEV1). The FEV1/VC ratio is reported as the primary lung function measure because it is the most sensitive measure for assessing airway remodeling in a large cohort (Rasmussen et al., Reference Rasmussen, Taylor, Flannery, Cowan, Greene, Herbison and Sears2002). Study members also self-reported symptoms of chronic bronchitis: chronic coughing and phlegm (Sears et al., Reference Sears, Greene, Willan, Wiecek, Taylor and Flannery2003). Study members who reported problems with coughing or phlegm at age 32 were classified as experiencing symptoms of chronic bronchitis.
Sexual health
Serological evidence of infection at age 32 with herpes simplex virus type 2 (HSV-2), the most common cause of genital herpes, was obtained using an indirect enzyme linked immunosorbent assay (HerpeSelect 2 ELISA IgG; Focus Technologies, Chanhassen, MN). HSV-2 infection was diagnosed using a cutoff value of 3.5 and any equivocal result (between 0.9 and 3.5) was resolved using HSV-2 Western blot (Ho, Field, Irving, Packham, & Cummingham, Reference Ho, Field, Irving, Packham and Cunningham1993). Full details of this measure are reported elsewhere (Eberhart-Phillips et al., Reference Eberhart-Phillips, Dickson, Paul, Herbison, Taylor and Cunningham2001).
Smoking during the past year at age 32 was assessed as part of the DIS (Robins et al., Reference Robins, Cottler, Bucholz and Compton1995). Tobacco dependence was diagnosed according to DSM-IV criteria.
Dental health
Examinations were conducted using calibrated dental examiners in all four quadrants of the mouth; technical procedures are described elsewhere (Broadbent, Thomson, & Poulton, Reference Broadbent, Thomson and Poulton2006; Thomson, Broadbent, Poulton, & Beck, Reference Thomson, Broadbent, Poulton and Beck2006). We report the number of untreated decayed surfaces present at age 32 and presence of gum disease defined as two or more sites with ≥4-mm combined attachment loss.
Injuries
Study members reported serious injuries between ages 26 and 32, defined as any requiring treatment from a doctor, medical center, or emergency services. We report the percentage who experienced an injury and, among these individuals, the percentage with a nonsport-related injury.
Age 32 economic problems
SES
Study members were asked about their current or most recent occupation; homemakers and those who were not working (e.g., students) were prorated based on their educational status according to the criteria included in the current New Zealand Socioeconomic Index (Davis, Jenkin, & Coope, Reference Davis, Jenkin and Coope2003). This information was coded to a 6-point scale for occupations in New Zealand; 31% of individuals scored in the lowest two groups on this scale and were classified as low SES.
Household income
Sources of income were ascertained (e.g., wages, self-employment, gambling winnings, interest, rent collected, and loans) and used as an aid to calculate total gross past-year income. Instead of presenting the raw data in local currency, we report the percentage of study members falling below the median split on household income.
Unemployed
Months of unemployment between the ages of 26 and 32 (defined as not working, not a student or homemaker, and looking for work) was recorded using a Life History Calendar (Belli et al., Reference Belli, Shay and Stafford2001; Caspi et al., Reference Caspi, Moffitt, Thornton, Freedman, Amell and Harrington1996). Study members who spent 1 or more months unemployed between the ages of 26 and 32 were classified as unemployed.
No educational qualification was defined as ending secondary education prior to receiving qualifications, and not returning to earn qualifications by age 32. Qualifications are based on national exams that almost all students take by age 16, which determine promotion in secondary school and technical schools; passing this exam also helps secure better employment in the labor market (Kennedy, Reference Kennedy1981).
Informant-rated financial problems were collected using the informant rating system described above. Informants rated the study member on two items (e.g., “poor money manager” or “lacked enough money to make ends meet”) using a 3-point scale (0 = not a problem, 1 = bit of a problem, 2 = yes, a problem). Study members rated as 1 or 2 on either item were classified as experiencing informant-rated financial problems (Moffitt et al., Reference Moffitt, Caspi, Harrington and Milne2002).
No money for food or other necessities
Study members were asked “since you were 26, did you ever find it difficult to meet the cost of food and other necessities?” (0 = no, 1 = sometimes, 2 = yes). Study members who received a score of 1 or 2 on this item were classified as experiencing difficulty meeting the cost of food and other necessities.
Homeless/taken in between ages 26 and 32 was measured using a Life History Calendar. Study members reported periods when they were homeless or were taken in by friends or relatives because they had no place to live (Wright, Caspi, Moffit, & Silva, Reference Wright, Caspi, Moffit and Silva1998). Study members who spent 1 or more months homeless or taken in were classified as homeless/taken in.
Methods and Results
Results are presented in two parts. The first part applies multiple-group confirmatory factor analysis (M-Group CFA) to test whether the Antisocial Conduct Problems Scale demonstrated measurement invariance (MI) across age and gender; that is, whether the same construct was measured (a) over time and (b) across males and females. Technically, MI refers to the invariant operation of items over time or across samples; that is, the extent to which item content is being perceived and interpreted exactly the same way across time or across groups (Byrne & Watkins, Reference Byrne and Watkins2003). The second part of the results applies GGMM to test whether the antisocial subgroups anticipated by the developmental taxonomy emerged within males and females. Standard techniques for the analysis of between-group differences (e.g., analysis of variance, logistic regression with planned contrasts) were then applied to (a) externally validate the subgroups in light of expectations regarding childhood origins and (b) test the predictive validity of the taxonomy for females and males based on age 32 outcomes.
Is the Antisocial Conduct Problems Scale Invariant Across Age and Gender?
Method
The first step in growth modeling is to establish that the same construct has been measured across time. A classic example is charting the rate of a child's growth in height across age. In this case, there is a common metric (e.g., inches) available to objectively assess how much the child has grown. When psychological constructs are measured, however, we cannot assume that the same “ruler” or metric has been used at each age. Therefore, we must first test whether the scale demonstrates MI across ages. Establishing MI provides evidence for a common quantitative metric and helps to ensure that we are not comparing “apples” to “oranges” when mapping development across time (McArdle, Reference McArdle1996).
Invariance across age is not the only measurement concern when interpreting results from growth-modeling analyses. It is also possible that the Antisocial Conduct Problems Scale operates differently, or demonstrates bias, across males versus females. Thus, to ensure that our results were comparable across males and females we also tested for MI across gender. Prior work has assumed, but not tested for, MI prior to mapping developmental trajectories of antisocial behavior.
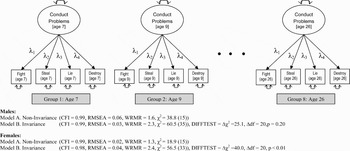
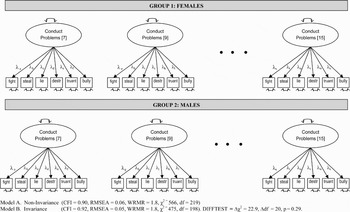
MI of the Antisocial Conduct Problems Scale was assessed through M-Group CFA, a technique that compares groups of individuals on latent variables underlying item sets (Sorbom, Reference Sorbom1974). M-Group CFA has been extended to apply to both continuous and ordered categorical outcomes (Lubke & Muthén, Reference Lubke and Muthén2004). To demonstrate MI, the regression relations between the observed items and the underlying factors are constrained to be equal across multiple groups (Meredith, Reference Meredith1993). When testing MI across age, each assessment age was treated as a separate group (see Figure 1 where Group 1 = age 7, Group 2 = age 9 …); when testing for MI across gender, females and males were treated as separate groups (see Figure 2 where Group 1 = females and Group 2 = males).
Multiple-group confirmatory factor analysis, testing for measurement invariance across age. Models were fit separately for males and females: λ1, factor loading for “fight” constrained to be equal across age 7 to age 26; λ2, factor loading for “steal” constrained to be equal across ages 7–26; λ3, factor loading for “lie” constrained to be equal across age 7–26; λ4, factor loading for “destroy” constrained to be equal across ages 7–26.

Multiple-group confirmatory factor analysis, testing for measurement invariance across males and females. Model A factor loadings (λa–λx) were freely estimated across males and females; Model B factor loadings (λa–λx) were constrained to be equal across males and females.

Analyses were conducted in Mplus Version 4.0 (Muthén & Muthén, Reference Muthén and Muthén1998–2006). Models were estimated using weighted least squares mean and variance adjusted (WLSMV) estimation, a technique appropriate for categorical data (Muthén & Shedden, Reference Muthén and Shedden1999). Two models were estimated to assess MI. Model A allowed factor loadings (see Figure 1, λ1−λ4, Figure 2, λa−λx) to be freely estimated across groups, whereas Model B, which was nested within Model A, constrained the factor loadings to be equal across groups. Two sets of analyses were performed using this strategy. The first set of analyses tested for invariance across age; here, Model A allowed the factor loadings to vary across age groups and Model B constrained the factor loadings to be equal across age groups (Figure 1). The second set of analyses tested for invariance across gender; here, Model A allowed the factor loadings to vary across males and females and Model B constrained the factor loadings to be equal across males and females (Figure 2).
An adjusted chi-square DiffTest (Muthén, du Toit, & Spisic, in press) was used to test for differences between nested models. The chi-square DiffTest corrects for the fact that the difference in chi-square values between two nested models is not distributed as a chi square when using the WLSMV estimator (Muthén & Muthén, 1998–2004). The DiffTest procedure in Mplus is an accepted means of testing for MI of nested categorical models (Asparouhov & Muthén, Reference Asparouhov and Muthén2006). Support for MI existed if there was not a significant difference between models (between Model A and Model B). Other standard fit criteria, such as the root mean square error of approximation (RMSEA) and comparative fit index (CFI; Hu & Bentler, 1995, 1999) are also presented; however, because of evidence that these indices may have low power to reject a model with binary indicators (Yu & Muthén, Reference Yu and Muthén2002), decisions regarding MI were made based primarily on fit indices recommended for categorical data, namely, the DiffTest.
Results
Is the conduct problems scale invariant across age?
For males, MI across age 7 to age 26 was established. There was not a significant change in fit between Model A (CFI = .99, RMSEA = .06, weighted root mean square residual [WRMR] = 1.6, χ2 = 38.8, df = 15), which allowed factor loadings to be freely estimated across age groups (see Figure 1, λ1−λ4) versus Model B (CFI = .99, RMSEA = .03, WRMR = 2.3, χ2 = 60.5, df = 35), which imposed an invariant factor structure (χ2 DiffTest, Δχ2 = 25.1/Δdf = 20, p = .20). In practical terms, these findings lend support for the developmental appropriateness of the Antisocial Conduct Problems Scale for males across the ages of 7 to 26.
For females, MI across age 7 to age 26 was not demonstrated. There was a significant change in fit between Model A (CFI = .99, RMSEA = .02, WRMR = 1.3, χ2 = 18.9, df = 15) and Model B (CFI = .98, RMSEA = .04, WRMR = 2.4, χ2 = 56.5, df = 33) based on the χ2 DiffTest (Δχ2 = 40.0/Δdf = 20, p < .01). In practical terms, this finding raised the possibility that if the scale was used across the entire age range for females we could be comparing younger “apples” with older “oranges.”
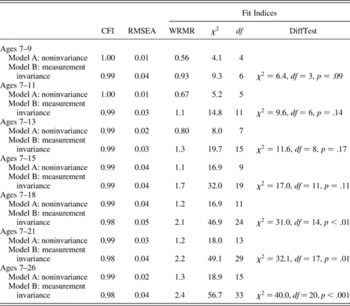
Because of the limitations of the Antisocial Conduct Problems Scale for females, the next step was to identify where (that is, at what age) the assumption of MI failed. M-Group CFA was applied to test how far across the age span MI could be assumed for females. As shown in Table 2, the first set of CFA models tested for MI across age 7 and age 9 only. Results from the χ2 DiffTest demonstrated no significant differences between Model A and Model B (Δχ2 = 6.4/Δdf = 3, p = .09). Support for MI was also found when measures of conduct problems at age 11 (Δχ2 = 9.6/Δdf = 6, p = .14), age 13 (Δχ2 = 11.6/Δdf = 8, p = .17) and age 15 (Δχ2 = 17.0/Δdf = 11, p = .11) were successively added to the model. When the age 18 data were added to the model, however, a significant loss in model fit was detected (Δχ2 = 31.0/Δdf = 14, p < .01), indicating that invariance of the scale could not be assumed across this age period. In practical terms, there was evidence that we had measured the same construct in females from age 7 to age 15; however, beyond this age the assumption of MI could not longer be supported.
Model-group confirmatory factor analysis across age for females

Note: Models were estimated using weighted least squares mean and variance adjusted estimation (WLSMV). Comparisons between models were made using the χ2 DiffTest, which is appropriate for categorical data (and WLSMV estimation). The DiffTest compares the H0 analysis model (Model B) to a less restrictive H1 alternative model (Model A) in which the H0 model is nested. The degrees of freedom (df) reported in the DiffTest are not the difference between the dfs in the H0 and H1 models; technical details of the DiffTest are described elsewhere (see Asparouhov & Muthén, Reference Asparouhov and Muthén2006). CFI, comparative fit index; RMSEA, root mean square error of approximation; WRMR, weighted root mean square residual.
To summarize, these findings have implications for the application of trajectory-based modeling. For males, evidence of MI existed across the entire age span, supporting the use of the conduct problems scale from ages 7 through to 26. For females, however, we could not be confident that CD symptoms measured the same antisocial construct past age 15. As such, without evidence of MI beyond this point it would be difficult to interpret our results; specifically, there was no assurance that quantitative, rather than qualitative, change would be mapped beyond age 15. Therefore, we were obliged to use different observation periods to evaluate the taxonomy in males (ages 7–26) versus females (ages 7–15) in the following sections.
Is the conduct problems scale invariant across gender?
Next, we tested whether the Antisocial Conduct Problems Scale measured the same construct within males and females. M-Group CFA was used to test for MI across the developmental period where age invariance had been established for females (ages 7–15). As shown in Figure 2, Model A allowed factor loadings (λa−λx) to be freely estimated across males and females (CFI = .90, RMSEA = .06, WRMR = 1.8, χ2 = 566, df = 219), whereas Model B imposed an invariant structure across males and females (CFI = .92, RMSEA = .05, WRMR = 1.8, χ2 = 475, df = 198). The difference between Model A and B was not statistically significant according to the DiffTest (Δχ2 = 22.9/Δdf = 20, p = .29). In practical terms, these results provide evidence that the Dunedin study measured the same antisocial construct in males and females between the ages of 7 and 15.
Does the use of different assessment periods impact our ability to test the taxonomy of antisocial behavior in females?
Arguably, the use of a shorter period of observation for females versus males (7–15 vs. 7–26 years) did not significantly impact our ability to test whether the two prototypical antisocial subtypes emerge within the female sample. First, MI across age and gender was established for the Antisocial Conduct Problem Scale during a period of development that is critical for testing the taxonomic theory. The conduct problems scale demonstrated invariance from age 7 to age 15, which informed whether antisocial behavior began in childhood versus adolescence. Second, the use of the Antisocial Conduct Problem Scale up to age 15 informed whether the childhood-onset group demonstrated persistence during the 8-year period from age 7–15. Third, to assess continuity into adulthood we used more developmentally appropriate age 32 indices of antisocial behavior (e.g., aggression against partners and children). This type of assessment strategy may be especially important for females as traditional antisocial behavior measures focus on official offending versus behaviors that occur in the home.
Does the Developmental Taxonomy Apply to Females and Males?
Method
GGMM (Muthén, Reference Muthén and Kaplan2004; Muthén & Shedden, Reference Muthén and Shedden1999) was applied to test whether the hypothesized subgroups, LCP, AL, and low antisocial (Low), emerged within a longitudinal birth cohort. GGMM is an extension of traditional growth curve modeling (McArdle & Epstein, Reference McArdle and Epstein1987; McArdle, Nesselroade, Schinka, & Velicer, Reference McArdle, Nesselroade, Schinka and Velicer2003) where latent variables are estimated based on multiple indicators of the construct observed across time. Unlike traditional growth curve modeling, key parameters of the growth process (y 0, A, y s) are allowed to vary by trajectory class (see Equations 1–3), and heterogeneity is captured through the use of latent categorical variables (Muthén & Shedden, Reference Muthén and Shedden1999). In other words, GGMM does not assume that individuals are drawn from a single population and, instead, tests whether the population is constructed of two or more discrete classes of individuals.
GGMM is similar to semiparametric group-based (SPGB) modeling (Nagin, Reference Nagin1999) that is performed using an SAS program called PROC TRAJ; both approaches are designed to identify subclasses of individuals that follow unique patterns of growth (Muthén, Reference Muthén and Kaplan2004). GGMM differs from SPGB in that it allows for class-specific variation (random effects). In this sense the SPGB approach can be considered a special case of the GGMM. In the present study, model comparisons were performed in order to test whether class-specific variation was required.
First level (random effects):

Second level (fixed effects):


where y 0 is the latent scores representing an individuals level, A[t] is the basis parameters representing the form of change over time, y s is the latent slopes of individual change over time, and e[t] is the measurement error.
GGMM and SPGB modeling have been applied to map heterogeneity in the developmental course of antisocial behavior (Broidy et al., Reference Broidy, Nagin, Tremblay, Bates, Brame and Dodge2003; Coté et al., Reference Coté, Tremblay, Nagin, Zoccolillo and Vitaro2002; Nagin & Tremblay, Reference Nagin and Tremblay2001; Schaeffer et al., Reference Schaeffer, Petras, Ialongo, Poduska and Kellam2003; Wiesner & Windle, Reference Wiesner and Windle2004). The technical details of the GGMM (Muthén & Muthén, 1998–2004) and SPGB (Nagin, Reference Nagin1999, Reference Nagin2005; Nagin & Land, Reference Nagin and Land1993) are described elsewhere. Briefly, models were fitted in Mplus Version 4.0 (Muthén & Muthén, 1998–2006) using maximum likelihood estimation. Following the steps outlined in Muthén (Reference Muthén and Kaplan2004), a series of models were fitted beginning with a one-class model and progressing sequentially to a six-class model. Evaluations of relative model fit were made following the addition of each class using the criteria described below. Next, variance parameters (random effects) were added to the models to test whether class-specific variance estimates were required.
Missing data were handled through full information at maximum likelihood (FIML) estimation under the assumption that the data were missing completely at random (MCAR) or for reasons that could be explained by other variables included in the model (Little & Rubin, Reference Little and Rubin1987). FIML is a widely accepted technique for dealing with missing data (Arbucle, Reference Arbucle, Marcoulides and Schumacker1996; Enders, Reference Enders2001; Raykov, Reference Raykov2005). Missing data presented a minimal threat to the results of these analyses because of the high retention rate in the Dunedin study; retention exceeded 90% for all measurement occasions except for age 13. Moreover, prior tests of selective attrition in the Dunedin Study support the MCAR assumption (Moffitt et al., Reference Moffitt, Caspi, Rutter and Silva2001). In technical terms, Mplus generates a covariance coverage matrix that provides the proportion of available observations for each time point, and pairs of time points. Covariance coverage ranged from .78 to .93 for females and from .77 to .95 for males; indicating that a minimum of 77% of the sample was used to estimate the relationships between any two particular time points.
The analyses proceeded in four steps.
Step 1
GGMM was applied to identify latent classes of individuals with distinct profiles of antisocial behavior across time. Models were fit separately for females and males. The optimal number of classes for each gender was determined based on recommended indices of model fit and classification accuracy, including the Bayesian information criterion (BIC; Raftery, Reference Raftery and Marsden1995; Schwartz, Reference Schwartz1978), Akaike information criterion (AIC; Akaike, Reference Akaike1974), Lo–Mendell–Rubin likelihood ratio test (LMR-LRT; Lo, Mendell & Rubin, Reference Lo, Mendell and Rubin2001), and entropy. BIC is a commonly used fit index where lower values index a more parsimonious model. AIC is considered a less conservative fit index (Nagin, Reference Nagin2005); however, like the BIC, AIC indexes relative model fit by balancing model complexity versus goodness of fit to the sample data. LMR-LRT provides a likelihood-ratio based method for determining the ideal number of classes; a low p value indicates that a k – 1 class model should be rejected in favor of a model with at least k classes. Entropy is a measure of classification accuracy created by averaging posterior probabilities after each individual has been assigned to their most likely class; values closer to 1 index greater precision (range = 0–1).
Step 2
Solutions were evaluated based on expectations from the developmental taxonomy regarding number of classes, developmental shape and prevalence rates. Specifically, three criteria were used to evaluate the solution. First, does the model that demonstrates the best empirical fit also contain the expected number of classes? At least three classes were expected to emerge, including: a LCP, AL, and low antisocial pathway. Second, does the shape of development correspond with the pathways anticipated by the taxonomy? Third, do the prevalence rates for each class correspond with those predicted by the theory? That is, the LCP class is expected to be relatively small and exhibit high levels of conduct problems beginning in childhood and persisting to adulthood. The AL class is hypothesized to be more common, to initiate conduct problems in midadolescence and to desist thereafter. The low-antisocial class should comprise the majority of the population and is expected remain low across development.
Step 3
The GGMM solution was externally validated for females, as well as males, using prospectively gathered childhood risk factors. Standard techniques for evaluating between-group differences (analysis of variance, logistic regression with planned contrasts) were used to assess whether the LCPs' profile of childhood risk was differentially characterized by social, familial, and neurodevelopmental deficits, whereas the AL profile of childhood risk was not.
Step 4
The predictive validity of the developmental taxonomy was evaluated using four outcome domains at age 32: violence toward others, mental health, physical health, and economic problems.
Results
Step 1. Empirical evaluation of the GGMM solutions
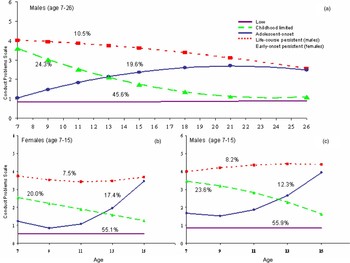
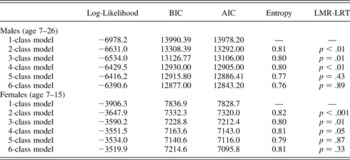
Elsewhere (Odgers, Caspi, et al., Reference Odgers, Caspi, Broadbent, Dickson, Hancox and Harrington2007; Odgers, Milne, et al., Reference Odgers, Milne, Caspi, Crump, Poulton and Moffitt2007), we applied GGMM to test the validity of the distinction between childhood- versus adolescent-onset conduct problems made in the developmental taxonomy. In our previous work, we reported data for males only and emphasized our plan to extend our work to include females as reported here. As previously reported for males, a four-class model represented the best empirical fit to the data (see Figure 3a, BIC = 12,930.0, entropy = .80, LMR-LRT = p < .01). As demonstrated in Table 3, the decrease in BIC between a three- and four-class model was large (13,126.8 to 12,930.0), and the LMR-LRT test (p < .01) favored rejecting the three-class model for the four-class model. Moving from a four- to five-class model, however, was not well supported; the relative change in BIC was small (12,930.0–12,915.8), classification quality was lower (entropy = .77) and the LMR-LRT test favored rejecting the five-class model (p = .43). A model that allowed for random effects also favored the four-class solution (LMR-LRT four vs. three class, p = .02, four vs. five class, p = .70).Footnote 1
Trajectories of antisocial behavior across age for males (n = 526) and females (n = 494). [A color version of this figure can be viewed online at www.journals.cambridge.org]

Fit indices for general growth mixture models

Note: BIC, Bayesian information criterion; AIC, Akaike information criterion; LMR-LRT, Lo–Mendell–Rubin likelihood ratio test.
For females, a four-class model also represented the best empirical fit to the data (see Figure 3b, BIC = 7,163.6, entropy = .81, LMR-LRT = p = .05). As demonstrated in Table 3, the decrease in BIC between a three- and four-class model was large (from 7,228.9 to 7,163.6) and the LMR-LRT test (p = .05) provided support for rejecting the three-class model. Moving from a four- to five-class model, again, was not well supported; the relative change in BIC was small (7,163.6–7,140.7) and the LMR-LRT test favored rejecting the five-class model (p = .86). A model that allowed for random effects also favored a four-class solution (LMR-LRT four vs. three class p = .06, four vs. five class p = .42).Footnote 2
Step 2. Evaluating models based on criteria derived from the developmental taxonomy
As shown in Figure 3a, the trajectory groups for males included an LCP class (10.5% of the male members of the cohort), who initiated antisocial behavior early and persisted into adulthood, and an adolescent-onset class (19.6%), whose conduct problems emerged during adolescence and remained relatively high into adulthood. Hereafter, we refer to this group as adolescent onset, because their participation in antisocial conduct extended beyond adolescence, and thus the AL label is not appropriate. A class of individuals, labeled childhood limited, who demonstrated conduct problems in childhood but subsequently desisted, was also identified (24.3%). The final class, labeled low antisocial (low), was the largest of the male population (45.6%) and was characterized by low levels of antisocial conduct problems.
A similar pattern existed for females (see Figure 3b. The trajectory groups for females included an early-onset and persistent class (7.5% of the female cohort members), who initiated antisocial behavior in childhood and persisted into midadolescence. Also identified was an adolescent-onset class (17.4%) whose conduct problems emerged during adolescence. A class of individuals, labeled childhood limited, who demonstrated mild to moderate levels of conduct problems in childhood but subsequently desisted, was also identified (20.0%). The final class, labeled low, comprised the majority of the female population (55.1%) and was characterized by low levels of antisocial conduct problems. Full details of the growth parameter estimates for each antisocial trajectory group are available from the authors upon request.
Because of the fact that different age periods were used for males and females in the GGMM analyses, we also fitted the data for males using only age 7 to age 15 measures. As demonstrated in Figure 3c, a four-class solution (BIC = 8,250.0, entropy = .82, LMR-LRT = p < .001) represented the best empirical fit to the data: the four-class model represented an improvement over a three-class model (LMR-LRT p < .001) but results did not support a more complex five-class solution (LMR-LRT p = .15). An examination of Figures 3b and Figure 3c, illustrates the similarity across female and male trajectories with respect to both the number of classes and trajectory shapes. The similarity of the solutions across gender is also illustrated in Appendix A, where the estimated trajectories for each individual are plotted by gender and trajectory class.
Step 3. External validation of trajectory classes using childhood risk factors
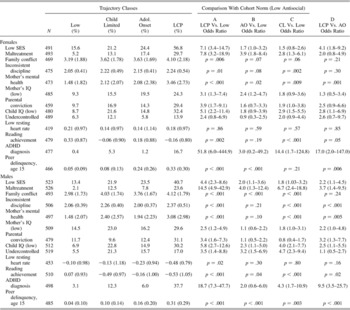
Trajectory classes for males (ages 7–26) and females (ages 7–15) were validated using prospectively gathered childhood risk factors. Results from Table 4 test three key expectations from the taxonomy. First, it is expected that those on the LCP pathway should deviate from the low antisocials on social, familial, and neurodevelopmental risk factors in childhood. As shown in the column labeled A, when compared to the low antisocials, LCPs scores significantly worse on virtually every childhood risk factor for early-onset persistent females (10 of 12) and on every childhood risk factor for LCP males (12 of 12). Second, those on the AL pathway were expected to resemble the cohort norm on childhood risk factors. Adolescent-onset females closely resembled the Lows; statistically significant differences were found for only 3 of 12 childhood risk factors (maltreatment, maternal malaise, and mothers' IQ). For males, significant differences were found between adolescent onsets and low antisocials on 6 of 12 childhood risk factors (column B). Third, those on both the AL and LCP pathways were predicted to have high levels of exposure to delinquent peers. Indeed, those on the LCP and adolescent-onset pathways had significantly elevated rates of peer delinquency at age 15 (columns A and B); this finding held for both males and females. There were no a priori expectations regarding the childhood-limited class, as they were not anticipated by the taxonomic theory, but they scored worse than the low antisocials on 7 of 12 (boys) and 10 of 12 (girls) risk factors.
Prevalence rates of childhood risk factors by trajectory-class membership and gender

Note: Low, antisocial low; CL, childhood limited; AO, adolescent onset, LCP, life-course persistent males or early-onset persistent females; SES, socioeconomic status; Undercontrolled, undercontrolled temperament; ADHD, attention-deficit/hyperactivity disorder.
Step 4. Predictive validity of the developmental taxonomy
Do females on the early-onset and persistent pathway engage in violence beyond adolescence?
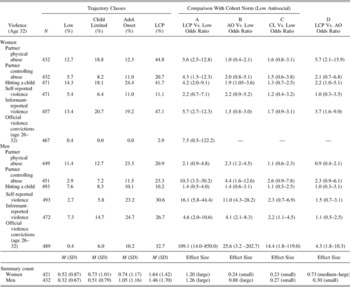
Table 5 presents age 32 rates of violence toward others by trajectory-class membership and gender. Results from this table convey three main findings. The first is that women on the early-onset persistent pathway demonstrated continuity in antisocial behavior into adulthood (hereafter this group will be labeled LCP). At age 32, a large percentage of LCP women engaged in violence toward partners (44.8%) and children (41.7%) and were rated as “getting into fights” by informants (47.1%). In total, 75% of LCP women had engaged in one or more of the violent acts listed in Table 5. Differences between women on the LCP versus low pathways reached statistical significance for four of six violence outcomes (column A).
Prevalence rates of age 32 violence toward others by trajectory-class membership and gender

Note: Effect sizes are small, ≤0.35; medium, >0.35 to ≤0.80; large, >0.80.
Men on the LCP pathway also demonstrated continuity in antisocial behavior at age 32. Differences between men on the LCP versus low antisocial pathway reached statistical significance for four of six violence outcomes, with 33% of LCP men (vs. 0.4% of low men) receiving a conviction for violence between age 26 and 32 (column A). In total, 59% of LCP men had engaged in one or more of the violent acts listed in Table 5.
To summarize the results, we created an index of the number of violent outcomes with which the cohort members were experiencing problems. The means and corresponding effect sizes (Cohen d) by trajectory class and gender are displayed at the bottom of Table 5. Overall comparisons between those on the LCP versus low pathway revealed large effect sizes for both women (d = 1.20) and men (d = 1.26).
The second main finding conveyed in Table 5 is that adolescent-onset women were experiencing very few problems with violence at age 32. Women on the adolescent-onset pathway differed from low antisocials on only one of six outcomes, resulting in a small effect size between subgroups (d = 0.24). Adolescent-onset women were also experiencing significantly fewer problems with violence than their LCP counterparts, with a medium to large effect size (d = 0.73) reported between subgroups. In contrast, adolescent-onset men were experiencing considerable problems with violence at age 32. Men on the adolescent-onset pathway differed from low antisocials on five of six outcomes (column B), resulting in a large effect size between subgroups (d = 0.88). Adolescent-onset men were not, however, equivalent to their LCP counterparts in terms of official offending; LCP men were over four times more likely to have received an official conviction for violence between age 26 and 32.
The third main finding conveyed in Table 5 is that childhood-limited women and men were not at an elevated risk for violence at age 32. No significant differences were found between childhood-limited versus low-antisocial women on measures of age 32 violence. Only two significant differences were reported between men on the childhood-limited versus low pathway; informants reported that 14.7% of childhood-limited men, versus 7.3% of the lows, “got into fights” during the last year, and 6% of childhood-limited men, versus 0.4% of lows, received an official conviction for violence (column C). Overall comparisons between those on the childhood-limited versus low-antisocial pathways revealed small effect sizes for both women (d = 0.23) and men (d = 0.27).
Are individuals on the LCP pathway experiencing the worst outcomes in adulthood?
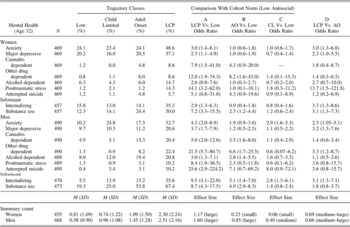
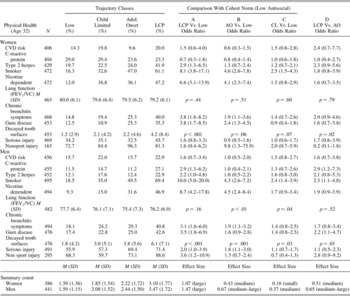
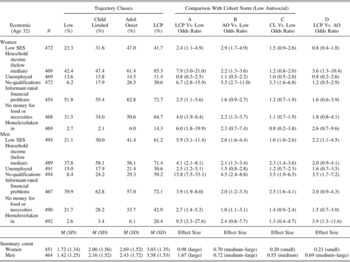
Tables 6–8 present the prevalence of age 32 outcomes by trajectory-class membership and gender. Four sets of planned comparisons are included in each table. Columns A and B illustrate whether those on the LCP and adolescent-onset pathways were faring worse than the low antisocial class on age 32 outcomes, whereas column D contrasts LCPs and adolescent onsets against each other. Results presented in these three columns align with predictions stemming from the developmental taxonomy; that is, that LCPs would experience the worst adult outcomes, and, to the extent that the adolescent-onset class maps on to the AL class specified by the taxonomy, that adolescent-onset involvement in antisocial behavior would be associated with a more successful transition into adulthood. Finally, column C evaluates the adult outcomes of the childhood-limited class, a subgroup not anticipated by the original taxonomy.
Prevalence rates of age 32 mental-health problems by trajectory-class membership and gender

Note: Effect sizes are small, ≤0.35; medium, >0.35 to ≤0.80; large, >0.80.
Prevalence rates of age 32 physical-health problems by trajectory-class membership and gender

Note: CVD, cardiovascular disease; FEV1, forced expiratory volume in 1 s; VC, vital capacity. Nonsport injury is calculated as a percentage of those with serious injury. Effect sizes are small, ≤0.35; medium, >0.35 to ≤0.80; large, >0.80.
Prevalence rates of age 32 economic problems by trajectory-class membership and gender

Note: Effect sizes are small, ≤0.35; medium, >0.35 to ≤0.80; large, >0.80.
To synthesize the results in Tables 6–8, we created summary indices of the number of problems within each domain. The mean number of problems and corresponding effect sizes (Cohen d) for each domain are displayed by class at the bottom of each table.
Table 6 presents age 32 rates of mental health problems by trajectory-class membership and gender. Results from this table convey three main findings. The first is that LCP women and men had the worst mental health outcomes. Significant differences between women on the LCP versus low antisocial pathway were reported for seven of nine outcomes, whereas LCP men differed from the low antisocials on every mental health outcome (column A). Overall comparisons between those on the LCP versus low antisocial pathways revealed large effect sizes for both women (d = 1.17) and men (d = 1.60).
The second main finding conveyed in Table 6 is that adolescent-onset women were experiencing substance-related problems. Women on the adolescent-onset versus low-antisocial pathway had significantly higher rates of dependency on drugs (other than cannabis) and informant-rated substance-use problems. Adolescent-onset women were not, however, more likely to meet diagnostic criteria for other psychiatric disorders (column B). Overall comparisons between women on the adolescent-onset versus low-antisocial pathway revealed a small effect size (d = 0.23).
Adolescent-onset men were also experiencing substance-related problems. When compared to low antisocials, adolescent-onset men had significantly higher prevalence rates of dependency on cannabis, other drugs, and alcohol. Adolescent-onset men were also more likely to be rated as experiencing substance-use problems and internalizing symptoms by informants (column B). Overall comparisons of mental health problems between men on the adolescent-onset versus low-antisocial pathway revealed a large effect size (d = 0.85).
In sum, adolescent-onset men and women were experiencing mental health problems that were, primarily, restricted to substance use. It is important to note, however, that those on the adolescent-onset pathway were not experiencing the same burden of mental health problems as their LCP counterparts; overall comparisons of mental health problems between those on the LCP versus adolescent onset pathways revealed medium to large effect sizes for both women (d = 0.69) and men (d = 0.66).
The third main finding conveyed in Table 6 is that those on the childhood-limited pathway were experiencing very few mental health problems; childhood-limited women could not be distinguished from low-antisocial and childhood-limited men differed significantly from low antisocials on only two of nine mental health outcomes (column D, anxiety and informant-rated internalizing symptoms). Overall comparisons of mental health problems between those on the childhood-limited versus low-antisocial pathway revealed no differences among women (d = 0.06) and a small to medium effect size for men (d = 0.40).
Table 7 presents age 32 rates of physical health problems by trajectory-class membership and gender. Results from this table convey three main findings. The first is that LCP women and men had the worst physical health outcomes. Women on the LCP versus low-antisocial pathway were faring worse on 6 of the 11 physical health outcomes, including Type 2 herpes, smoking, nicotine dependence, chronic bronchitis symptoms, gum disease, and decayed tooth surfaces. Men on the LCP versus low-antisocial pathway were also faring worse on the majority (9 of 11) of physical health outcomes (column A). Overall comparisons of physical health problems between those on the LCP versus low-antisocial pathway revealed large effect sizes for both women (d = 1.07) and men (d = 1.47).
The second main finding in Table 7 is that the adolescent-onset class was also experiencing physical health problems at age 32. Women on the adolescent-onset versus low-antisocial pathway were faring worse on 5 of 11 physical health outcomes; similarly, adolescent-onset men differed from the low antisocials on 6 of 11 physical health outcomes (column B). Overall comparisons of physical health problems between those on the adolescent-onset versus low-antisocial pathway revealed medium effect sizes for women (d = 0.43) and medium to large effect sizes for men (d = 0.67). Adolescent-onset men and women were not, however, experiencing the same level of physical health problems as their LCP counterparts; comparisons between the two subgroups on the summary index of physical health problems revealed a medium effect size for women (d = 0.51) and a medium to large effect size for men (0.65).
The third main finding conveyed in Table 7 is that the childhood-limited class was experiencing very few physical health problems. Women on the childhood-limited pathway differed from their low-antisocial counterparts on only one physical health outcome (column C, smoking). Similarly, childhood-limited men differed from low antisocials on only 3 of 11 physical health outcomes (column C, smoking, lung function, and untreated decayed tooth surfaces). Overall comparisons of physical health problems between those on the childhood-limited versus low-antisocial pathway revealed small effect size for women (d = 0.18) and small to medium effect size for men (d = 0.37).
Table 8 presents age 32 rates of economic problems by trajectory-class membership and gender. Again, results from this table convey three main findings. In the first, LCP women and men were experiencing the worst economic outcomes at age 32. Women on the LCP versus low-antisocial pathway were faring significantly worse on six of seven economic outcomes, whereas significant differences between men on the LCP versus low-antisocial pathway were found on every outcome (column A). Overall comparisons of economic problems between those on the LCP versus low-antisocial pathway revealed large effect sizes for both women (d = 0.98) and men (d = 1.67).
The second main finding in Table 8 is that the adolescent-onset class was also experiencing economic problems (column B). Women in the adolescent-onset class were more likely (than the low antisocials) to be classified as low SES, fall below the median on household income, have no qualifications, and report having no money for food/necessities. Adolescent-onset men were also experiencing financial problems; significant differences were found for five of the seven economic outcomes (the only exceptions were “unemployed” and “taken in/homeless”). Overall comparisons of economic problems between those on the adolescent-onset versus low-antisocial pathways revealed medium to large effect sizes for both women (d = 0.70) and men (d = 0.72). It is important to note, however, that adolescent-onset men were not experiencing the same level of economic problems as their LCP counterparts; comparisons between the two subgroups on the summary index of economic problems revealed a medium to large effect size (d = 0.69). Conversely, only a small difference was observed between adolescent-onset and LCP women (d = 0.23).
The third main finding is that childhood-limited women were not experiencing economic problems at age 32. Although childhood-limited women were 3.3 times more likely than low antisocials to lack “educational qualifications,” they were not experiencing economic problems based on other age 32 economic outcomes. The economic standing of the childhood-limited men at age 32, however, was not as positive. Men on the childhood-limited versus low-antisocial pathway were more likely to fall below the median on household income, have no educational qualifications, and be rated by informants as experiencing financial problems (column C). Overall comparisons of economic problems between those on the childhood-limited versus low-antisocial pathways revealed a small effect size for women (d = 0.20) and a medium effect size for men (d = 0.55).
Discussion
The following discussion highlights how the main findings from this study inform our understanding of the developmental course and consequences of antisocial behavior among females. The discussion also extends beyond gender to detail the implications of our results for further refinement of the developmental taxonomy, future research and prevention strategies.
Finding 1: LCP and adolescent-onset subtypes emerge among males and females in a prospective study of a birth cohort
A small, albeit growing, body of research is accumulating regarding whether comparable developmental pathways of antisocial behavior exist among females and males (Broidy et al., Reference Broidy, Nagin, Tremblay, Bates, Brame and Dodge2003; Coté et al., Reference Coté, Tremblay, Nagin, Zoccolillo and Vitaro2002; Fergusson & Horwood, Reference Fergusson and Horwood2002; Gorman-Smith & Loeber, Reference Gorman-Smith and Loeber2005; Moffitt et al., Reference Moffitt, Caspi, Rutter and Silva2001; Schaeffer et al., Reference Schaeffer, Petras, Ialongo, Masyn, Hubbard and Poduska2006; Silverthorn & Frick, Reference Silverthorn and Frick1999; Xie et al., Reference Xie, Cairns, Cairns, Pepler, Madsen and Webster2005). Although the existence of an adolescent-onset pathway of antisocial behavior among females has been well documented, the existence of a distinct childhood-onset persistent subgroup of females has been questioned (Silverthorn, Frick, & Reynolds, Reference Silverthorn, Frick and Reynolds2001).
Our results support the existence of both a LCP and adolescent-onset antisocial pathway among females. The GGMM solution identified a small group of females (7.5% of the cohort) who began engaging in antisocial behavior in childhood and persisted through adolescence (based on conduct problem symptoms; see Figure 3b and into adulthood (based on age appropriate indices of adult antisocial behavior; see Table 5). Consistent with prior research (for a review see Moffitt et al., Reference Moffitt, Caspi, Rutter and Silva2001), gender differences in antisocial behavior were observed at virtually every age, with a narrowing of the male/female ratio during adolescence. That is, with the exception of age 15, males were significantly higher on antisocial conduct problems at each assessment age (see Table 1). When trajectory models were conducted separately by gender, slightly fewer females (7.5%) than males (10.5%) were classified as following the LCP pathway. However, if trajectory groups were defined based on the combined sample of males and females only 5% of females versus 13% of males were classified as following an LCP pathway. These results suggest that an LCP subgroup of females will emerge regardless of whether a combined or a female-only sample is examined; however, the estimated prevalence rates of LCP females will be lower if trajectory models are fitted to combined samples of males and females.
The identification of an early-onset and persistent subgroup of females is consistent with results from existing prospective studies (Bongers et al., Reference Bongers, Koot, van der Ende and Verhulst2004; Broidy et al., Reference Broidy, Nagin, Tremblay, Bates, Brame and Dodge2003; Coté, Zoccolillo, Tremblay, Nagin, & Vitaro, Reference Coté, Zoccolillo, Tremblay, Nagin and Vitaro2001; Fergusson & Horwood, Reference Fergusson and Horwood2002; Kratzer & Hodgins, Reference Kratzer and Hodgins1999; Lahey et al., Reference Lahey, Van Hulle, Waldman, Rodgers, D'Onofrio and Pedlow2006; Schaeffer et al., Reference Schaeffer, Petras, Ialongo, Masyn, Hubbard and Poduska2006; White & Piquero, Reference White and Piquero2004). For example, Coté and colleagues (2001) reported that approximately 11% of girls (from a representative Canadian sample) followed a medium-high to high trajectory of persistent disruptive behaviors across the ages of 6 to 12 and were at an increased risk for later CD. Schaeffer and colleagues (2006) identified an early-starter subgroup of females (9% of the female cohort from a representative US inner-city sample) that demonstrated chronically high levels of antisocial behavior and were at an increased risk for antisocial outcomes in adolescence and young adulthood. Similarly, Lahey et al. (Reference Lahey, Van Hulle, Waldman, Rodgers, D'Onofrio and Pedlow2006 reported that 3.5 to 6.9% of females (from a national US sample) followed an LCP pathway between the ages of 4 and 17 and were at increased risk for official offending in adulthood. Considered alongside the findings from this study, this emerging body of research supports the existence of a small, yet significant, early-onset and persistent subgroup of females who are at risk for poor prognosis in a number of domains across adolescence and into early adulthood.
In the present study, the GGMM solution also identified an adolescent-onset subgroup of females (17% of the cohort) who began engaging in antisocial behavior during adolescence and, based on age appropriate indicators, were not experiencing significant problems with antisocial behavior in adulthood. Thus, the adolescent-onset subgroup of females appears to be AL, although without complete trajectories of antisocial behavior between ages 15 and 26, we cannot know exactly when they desisted. Thus, our findings suggest that both an early-onset and persistent pathway and an AL pathway exist for females. As will be documented in the following section, our results also supported predictions from the developmental taxonomy regarding the distinct childhood origins and adult consequences for females on the LCP versus AL pathway.
Finding 2: The childhood origins of females on the LCP versus AL pathway are distinct
Our results support predictions from the developmental taxonomy regarding the childhood origins of female LCP and AL subtypes. Similar to prior results with males (see Moffitt, Reference Moffitt, Cicchetti and Cohen2006, for a review), the LCP path for females was differentially predicted by individual risk characteristics including low intellectual ability, reading difficulties, and hyperactivity. The LCP path for females was also differentially predicted by parenting risk factors, including mothers with poor mental health, experiences of harsh and inconsistent discipline, much family conflict, and low family SES. Although girls on the LCP pathway did not differ from the cohort norm on undercontrolled temperament or low resting heart rate, the observed relationships were in the expected direction. Overall, LCP females were faring significantly worse compared to the average Dunedin females (low antisocials) on 10 of 12 childhood risk factors. In contrast, female study members on the AL path, tended to have backgrounds that were normative, or sometimes even better than the average Dunedin child's; they differed on only 3 of 12 childhood risk factors (maltreatment, mother's mental health, and mother's IQ). Finally, as predicted by the taxonomy, both LCP and AL females were significantly elevated on peer delinquency during adolescence.
Finding 3: LCP females experience the most severe consequences in adulthood
Antisocial behavior among girls has been linked to a wide range of poor outcomes in adulthood, including substance dependence, involvement in abusive relationships, and social welfare dependence (Bardone et al., Reference Bardone, Moffitt, Caspi and Dickson1996; Moffitt et al., Reference Moffitt, Caspi, Rutter and Silva2001; Serbin et al., Reference Serbin, Peters, McAffer and Schwartzman1998). However, to our knowledge, no studies have tested whether the adult consequences for females on the LCP versus AL pathway are more severe.
Our results demonstrate that females on the LCP pathway have poor outcomes across multiple domains at age 32. In addition to exhibiting high continuity in antisocial behavior into adulthood (effect size vs. low antisocials, d = 1.20), LCP females also suffer from significant mental health (effect size vs. low antisocials, d = 1.17), physical health (effect size vs. low antisocials, d = 1.07), and economic problems (effect size vs. low antisocials, d = 0.98). Overall, females on the LCP pathway had the highest prevalence rates on 29 of the 33 outcomes examined, with statistically significant differences reported (compared to the low antisocials) for 23 of 33 outcomes.
The story differs, however, for females on the AL pathway. AL females demonstrated very little continuity in their antisocial behavior into adulthood (effect size vs. low antisocials, d = 0.24). Although a small percentage of AL women became ensnared by drug use (other than cannabis), they were not more likely to meet diagnostic criteria for other types of psychiatric disorders. Moreover, when all types of substance dependency are combined, only 12% of AL women (vs. 8% of low antisocials), met diagnostic criteria, indicating that substance dependency was a problem for only a small percentage of the subgroup.
Economic status was the only domain where AL women demonstrated significant deficits at age 32. AL women were elevated when compared to low antisocials (d = 0.70) and did not demonstrate marked differences from their LCP counterparts (d = 0.23). Young AL women may be especially vulnerable to factors, such as young parenthood, that compromise their economic outcomes during their early 30s. Indeed, at age 32, 72% of LCP and 61% of AL women had children, versus 50% of low-antisocial women. These young women are likely to require significant financial resources to support their children, and also may have missed out on important educational and vocational training opportunities because of, for example, child-rearing responsibilities or engagement in antisocial behavior. In contrast, young men who father children at a young age may be less likely to be responsible for their children. In addition, males who miss out on educational opportunities are likely to still have occupations with a sizable salary open to them (e.g., construction work), whereas there are few well-paying positions for young women who have missed out on educational and vocational training. These hypotheses about why AL women have economic difficulties should be tested in future research.
To summarize, these findings inform our understanding of the adult consequences of antisocial behavior among females in two ways. First, LCP females had the most severe and pervasive problems in adulthood; the overall prognosis for LCP women at age 32 is poor. Second, although AL females are not experiencing the same degree of problems as their LCP counterparts, they are at risk for poor economic outcomes. AL females comprise a substantial percentage of the population (~17%) and, as such, interventions should focus on factors that may ensnare antisocial adolescent girls into a pathway to poor economic outcomes as women.
Our results also have implications that go beyond gender for refining the developmental taxonomy and informing future research and practice. The following section will discuss each of the three antisocial subgroups, summarize how the subgroups fared at age 32 and observe whether the group's outcomes fit predictions from the developmental taxonomy.
LCP pathway: Still the most violent and least likely to reform
As predicted, those on the LCP pathway were experiencing significant problems at age 32. Although poor outcomes among LCP males were observed in this sample at age 26 (Moffitt et al., Reference Moffitt, Caspi, Harrington and Milne2002), 5 years later we have learned three new pieces of information about this subgroup. First, there are no signs of desistance for LCP males or females; 32.7% of males received a new conviction for violence between age 26 and 32, and although LCP women were not receiving official convictions for violence, 75% of had engaged in at least one form of self- or informant reported physical violence in the last year. Despite the fact that the Dunedin sample is more than 10 years past the peak age for violent offending, violence among the LCP subgroup remains high. It is also important to note that we may have underestimated LCPs levels of violence because of the fact that opportunities for engaging in the majority of violent outcomes (e.g., hitting a child, controlling, and or hitting a partner) may have been disproportionately limited for LCP males because of their time in prison. In this regard it merits mention that 18% of LCP men had spent time in prison between the ages of 26 and 32, versus only 5.1% of adolescent-onset men, and 0% of low-antisocial men.
Second, as we have followed our cohort further across the life span, physical health has emerged as a new and important outcome domain to consider for those on the LCP pathway. This study is one of the first to demonstrate a prospective link between the LCP pathway and increased adult health burden in females and males. Although our sample is relatively young to assess physical health problems, at this early age LCP men and women differed from the low antisocials on a wide range of physical health problems, including sexually transmitted disease, nicotine dependency, chronic bronchitis, and gum disease.
Adolescent-onset or AL pathway?
Prior to evaluating the outcomes for the adolescent-onset class it is necessary to consider whether our application of trajectory-based models was able to correctly classify individuals who fit the AL definition. We suspect that some AL individuals may have been assigned to the low-antisocial group based on our trajectory analysis, and those assigned to the adolescent-onset group may thus be more persistent than anticipated. As specified in the original description of the taxonomic theory, AL individuals are expected to show relatively “little continuity in their antisocial behavior,” may have “sporadic crime free periods in the midst of their brief crime careers,” and may demonstrate “cross situational inconsistency” (Moffitt, 1993, p. 686). Given that antisocial behavior among ALs is expected to be relatively transient, it is likely that trajectory-based methods, that are ideal for mapping enduring and consistent patterns of development, may by less successful in detecting this type of “transient” or “intermittent” behavioral pattern.
In short, there are two reasons why many “true” AL individuals may have been missed in our trajectory analyses. First, a more intensive sampling of measurement occasions during adolescence may have been required to detect intermittent involvement in antisocial behavior at these ages. In the Dunedin study, adolescent antisocial behavior was assessed at ages 11, 13, 15, and 18. These assessment periods capture the Study member's involvement in antisocial acts over the past year. It is possible, therefore, that individuals who had transient involvement in antisocial behavior between the ages of 11 and 12, 13 and 14, and 15 and 17 would not end up in the AL subgroup. Second, it is also the case that individuals who engaged in antisocial behavior during only one of the three assessment periods during adolescence were classified as belonging to the low-antisocial or childhood-limited subgroups in our solution, despite the fact that, conceptually, they met the definitional criteria for the AL subgroup. In other words, our method for classifying individuals may not have been sensitive enough to capture the entire AL class. With these limitations in mind, the outcomes for the adolescent-onset class can be evaluated.
The developmental theory of antisocial behavior predicts that those who begin their involvement in antisocial behavior during adolescence should make the transition to adulthood with greater ease than their LCP counterparts. A prior follow-up of this cohort demonstrated that at age 26 those on the AL pathway were still experiencing problems (Moffitt et al., Reference Moffitt, Caspi, Harrington and Milne2002). Five years later, results suggest males on the adolescent-onset pathway did not limit their antisocial behavior to adolescence, although they were more able to make a successful transition into adulthood than their LCP counterparts. Figure 3a shows the adolescent-onset subgroup of males did not self-report fewer antisocial conduct problem symptoms than LCPs at age 26. However, as shown in Table 5, between age 26 and 32 the adolescent-onset subgroup had fewer official convictions for violence than LCPs.
Although not to the same extent as LCPs, adolescent-onset males were also at risk for adjustment problems in adulthood across a wide range of domains (substance use, physical health, and economic problems). The taxonomy anticipated that some individuals on the AL pathway would offend longer than others, if they attracted “snares,” factors such as addiction that foster offending. Elsewhere we have shown that substance dependence in this cohort promotes persistence of offending (Hussong, Carran, Moffit, Caspi, & Corrig, Reference Hussong, Curran, Moffitt, Caspi and Carrig2004). Here, for both adolescent-onset men and AL women, mental health problems were restricted primarily to substance use. Similarly, the types of physical health problems that adolescent-onset (men) were experiencing were related to an antisocial lifestyle; that is, they had higher rates of smoking, dental problems and injuries. Economically, however, both adolescent-onset men and women were not faring well.
To summarize, contrary to the taxonomy, a group of males was identified with adolescent onset but subsequent persistence to age 32 (although the predicted desistance was seen in females). Because of the spacing of measurement occasions during adolescence in this sample, combined with the challenges of mapping this type of transient behavioral pattern using trajectory-based methods, it is likely that many individuals who were involved in antisocial behavior during adolescence were not included in our adolescent-onset class. Instead, a more persistent subgroup emerged that, although not to the same extent as their LCP counterparts, was still experiencing problems across multiple domains at age 32.
Childhood-limited pathway: Antisocial behavior may indicate two divergent pathways for males
A childhood-limited subgroup, not anticipated by the taxonomy but identified recently in the literature, was also identified. This class is of particular interest to researchers and clinicians given the rapid pattern of desistence that may signal true recovery or, alternatively, a type of developmental process whereby problems shift from externalizing problems into other domains. Among males, the childhood-limited subgroup's rapid pattern of desistence meant that they could not be distinguished from the low antisocials in adulthood. This class included 24% of male children, suggesting that short-term antisocial conduct problems are very common among young boys. However, without evidence of persistence, such childhood problems were not sufficient to signal continuity of antisocial behavior into adulthood (Moffitt et al., Reference Moffitt, Caspi, Rutter and Silva2001; Tremblay, Reference Tremblay2000; Tremblay, Hartup, & Archer, Reference Tremblay, Hartup and Archer2005).
When age 32 outcomes were examined, childhood-limited men were experiencing small to moderate problems that were restricted to internalizing disorders, smoking, and financial difficulties. Overall, however, childhood-limited men were faring significantly better than their LCP counterparts despite their equivalent initial levels of antisocial behavior in childhood. Thus, although this class may not represent “true recoveries,” given that they are experiencing isolated problems in adulthood, the types of support and interventions this subgroup requires will be quite different from those needed by their LCP counterparts.
For females, childhood-limited conduct problems do not signal a poor outcome. At age 32, childhood-limited females closely resembled the cohort norm across all domains. It is important to note, however, that childhood-limited females did not overlap with LCP females on measures of antisocial behavior in childhood. As such, this subgroup would be less likely (than their male childhood-limited counterparts) to emerge as a clinically relevant subgroup in childhood.
Limitations and Implications
This study has clear limitations. First, it is challenging to construct a developmentally appropriate measure of conduct problems that can be applied from childhood into adulthood. Although we tested and confirmed MI of behaviors across our age range for males, we were not able to span the entire age range for females by assessing CD symptoms from the DSM-IV. Future research should include traditional conduct problem scales as well as a broad range of candidate female-specific symptoms derived from developmental research and clinical practice. The growing body of work on relational and social aggression (Crick & Grotpeter, Reference Crick and Grotpeter1995; Underwood, Reference Underwood2003), bullying (Pepler et al., Reference Pepler, Craig, Yuile, Connolly, Putallaz and Bierman2004) and aggression within the context of adolescent romantic relationships (McMaster, Connolly, Pepler, & Craig, Reference McMaster, Connolly, Pepler and Craig2002) may assist in expanding assessment tools for both females and males. It should also be noted that strict MI is an idealization, and its existence in the real world of psychological measurement is a rarity (Meredith, Reference Meredith1993). In the present case, modifications were made to the content of the items to ensure that the measures were appropriate for the developmental stage of our sample. As such, the Antisocial Conduct Problems Scale could never fit the stringent criteria of metric invariance that requires identical item content across age. Thus, trajectory shapes should be interpreted in light of age-specific forms of measurement error.
Second, individuals were assigned to classes based on posterior probabilities of their most likely class membership; however, observed pathways may fall between two or more estimated trajectories. As shown in Appendix A, individuals do not follow “lock step” with the predicted trajectory for their class (Nagin, Reference Nagin2005). Moreover, whereas trajectory-based methods are a powerful tool for modeling strong developmental patterns over time, solutions need to be evaluated with respect to measurement quality, across both age and gender, and against how well the empirical model corresponds with one's theory of development (Ferrer & McArdle, Reference Ferrer and McArdle2003; Sampson & Laub, Reference Sampson and Laub2005). In the present case, trajectory-based models seem ideal for approximating the LCP pattern of constant and enduring antisocial behavior; however, to the extent that AL behavior is brief, transient, or at worst, not captured within the available measurement intervals, trajectory-based modeling may not provide the optimal strategy. Moreover, the issue of whether the LCP class demonstrates continued persistence in antisocial behavior across the entire life span into old age has been challenged (Sampson & Laub, Reference Sampson and Laub2003) and still remains an open question within this sample. These limitations reaffirm the need to view the trajectories as approximations, not precise maps, of the developmental course of conduct problems, and to carefully consider the fit between theory and the assumptions underlying alternative statistical models when mapping development (Hertzog & Nesselroade, Reference Hertzog and Nesselroade2003).
Third, this study is based on a single New Zealand cohort who came of age in the 1990s. Although the prevalence rates of health and antisocial problems are similar to those in other Western nations, and previous findings about them from this cohort have been replicated (Moffitt et al., Reference Moffitt, Caspi, Rutter and Silva2001), these findings require replication in other countries. As such, generalization of our findings across cultures and historical periods is a question left for future research. For example, birth cohorts who came of age in the 1950s to the 1970s desisted crime younger than cohorts who came of age in the 1990s (Nagin et al., Reference Nagin, Farrington and Moffitt1995; Sampson & Laub, Reference Sampson and Laub2003).
Fourth, our cohort is young in terms of the age-based and cumulative risk for physical health problems. As such, we likely underestimated the eventual health burden for the LCP class. Older cohorts, and the continued tracking of our cohort, can estimate the full extent of the health burden. Continued follow-up of the Dunedin cohort will also allow for the examination of outcomes related to intergenerational transmission of risk. Although our Study members are still too young to effectively assess the well being of offspring by trajectory class (only 50% of women and 35% of the men in the low class had children by the age 32, compared to 72% of LCP women and 57% of LCP men), elsewhere we have reported that a history of CD among parents in the Dunedin cohort predicts they will provide a suboptimal caregiving environment for their offspring (Jaffee, Belsky, Harrington, Caspi, & Moffitt, Reference Jaffee, Belsky, Harrington, Caspi and Moffitt2006).
Fifth and finally, rising rates of female violent crime and the increasing numbers of girls entering the juvenile justice system has raised a pressing question: can our understanding of antisocial behavior among males be extended to inform interventions for females within clinical and forensic settings (Moretti & Odgers, Reference Moretti and Odgers2006; Snyder & Sickmund, Reference Snyder and Sickmund2006)? Although the Dunedin study is well suited for addressing basic scientific questions related to etiology, developmental processes, and prevention priorities, our findings cannot directly inform treatment within clinical of forensic settings, or address whether gender-specific programming is required.
With these limitations in mind, our results suggest that the burden of problems associated with LCP antisocial behavior, for both females and males, may be larger than we originally thought. These findings provide one of the first comprehensive assessments of the long-term public health burden following childhood- and adolescent-onset antisocial behavior, and suggest that “cost estimates” of antisocial behavior, for both males and females, may need to be recalibrated to account for multiple kinds of costs to the individual and society.
Appendix A
Predicted values for individuals by trajectory class membership, four-class solution, ages 7–15 for females and males: (a) early-onset persistent females, (b) adolescent-onset females, (c) childhood-limited females, (d) low-antisocial females, (e) life-course persistent males, (f) adolescent-onset males, (g) childhood-limited males, and (h) low-antisocial males. [A color version of this figure can be viewed online at www.journals.cambridge.org]