Introduction
In the USA, ~83 per 100 000 adolescents and young adults will experience the first-episode psychosis (FEP) each year (Simon et al., Reference Simon, Coleman, Yarborough, Operskalski, Stewart, Hunkeler, Lynch, Carrell and Beck2017) and generally experience positive, negative and neurocognitive symptoms (Kahn et al., Reference Kahn, Sommer, Murray, Meyer-Lindenberg, Weinberger, Cannon, O'Donovan, Correll, Kane, Van Os and Insel2015). The outcome of FEP can range from complete recovery to the development of schizophrenia (SZ) or non-schizophrenia (NSZ) resulting in serious functional impairments that are determined by neurocognitive and negative symptom severity (Reichenberg et al., Reference Reichenberg, Feo, Prestia, Bowie, Patterson and Harvey2014). Advances in structural and functional neuroimaging have increased our understanding of the pathogenesis of SZ with functionally abnormal information processing in FEP and chronic SZ (Kahn et al., Reference Kahn, Sommer, Murray, Meyer-Lindenberg, Weinberger, Cannon, O'Donovan, Correll, Kane, Van Os and Insel2015). However, a cost-effective clinical tool that can easily serve as a proxy for brain dysfunction, as well as aid in predicting diagnostic and treatment specificity in FEP is crucial in psychiatry.
Neurological examination abnormalities (NES) are quantified by measuring subtle, partially localizable (cerebello-thalamo-prefrontal cortical circuit) and heritable neurological signs comprising sensory integration, motor coordination and motor sequencing of complex movements (Keshavan et al., Reference Keshavan, Sanders, Sweeney, Diwadkar, Goldstein, Pettegrew and Schooler2003b; Bachmann et al., Reference Bachmann, Degen, Geider and Schröder2014; Zhao et al., Reference Zhao, Li, Huang, Yan, Dazzan, Pantelis, Cheung, Lui and Chan2014; Li et al., Reference Li, Huang, Xu, Wang, Li, Zeng, Lui, Cheung, Jin, Dazzan, Glahn and Chan2018). Neuroscientific evidence for the importance of NES comes from the identification of cerebral correlates, covariation with cognition and its potential as a candidate endophenotypes for schizophrenia-spectrum disorders (Chan and Gottesman, Reference Chan and Gottesman2008; Chan et al., Reference Chan, Xu, Heinrichs, Yu and Wang2010). Moreover, a lifespan study by Chan et al. (Reference Chan, Xie, Geng, Wang, Lui, Wang, Yu, Cheung and Rosenthal2016) profiling NES scores across the schizophrenia spectrum and healthy controls has demonstrated that while healthy controls exhibit a U-shaped pattern for NES scores and age, patients on the schizophrenia spectrum demonstrated a relatively stable elevation in NES scores (Chan et al., Reference Chan, Xie, Geng, Wang, Lui, Wang, Yu, Cheung and Rosenthal2016). Impairments in NES (higher scores) have been described in high-risk subjects (relatives of SZ patients, unaffected monozygotic twins discordant for SZ) (Torrey et al., Reference Torrey, Taylor, Bracha, Bowler, McNeil, Rawlings, Quinn, Bigelow, Rickler and Sjostrom1994; Prasad et al., Reference Prasad, Sanders, Sweeney, Montrose, Diwadkar, Dworakowski, Miewald and Keshavan2009; Bachmann et al., Reference Bachmann, Degen, Geider and Schröder2014), antipsychotic-naïve FEP (Sanders et al., Reference Sanders, Keshavan and Schooler1994), chronic SZ patients (Sanders and Keshavan, Reference Sanders and Keshavan1998; Bachmann and Schröder, Reference Bachmann and Schröder2018) and other psychiatric diagnoses (Bombin, Reference Bombin2005; Chan et al., Reference Chan, Xie, Geng, Wang, Lui, Wang, Yu, Cheung and Rosenthal2016). However, the diagnostic specificity of NES has not been fully elucidated. In the largest cross-sectional study of NES in SZ spectrum disorders, it was shown that NES captures a moderate portion of psychosis proneness with reasonable specificity (Chan et al., Reference Chan, Xie, Geng, Wang, Lui, Wang, Yu, Cheung and Rosenthal2016). In a 6-month follow-up study of FEP, we have previously shown that factor scores for cognitively demanding and perceptual tasks were higher in the FEP schizophrenia (FEP-SZ) group relative to FEP non-schizophrenia (FEP-NSZ, participants with psychosis and a non-schizophrenia diagnosis) and control groups, but not between the FEP-NSZ and control group (Keshavan et al., Reference Keshavan, Sanders, Sweeney, Diwadkar, Goldstein, Pettegrew and Schooler2003b). Factor scores for baseline repetitive motor task abnormalities were elevated in both patient groups compared to controls, but not between the FEP groups, while factors scores for cognitive/perceptual tasks distinguished FEP-SZ from FEP-NSZ and HC groups, but not between FEP-NSZ and HC (Keshavan et al., Reference Keshavan, Sanders, Sweeney, Diwadkar, Goldstein, Pettegrew and Schooler2003b). Overall, few studies have evaluated the clinical utility of NES measures in predicting whether FEP patients develop either FEP-SZ or FEP-NSZ.
NES assessment could have the additional benefit of predicting psychosis symptom improvement. Treatment of FEP targets various domains, including positive and negative symptoms, cognitive dysfunction, social, academic and vocational functioning. In the literature, ‘response’ is defined as the reduction of total symptoms compared with baseline by 20–25% (minimally improved), 40–50% (much improved) whereas remission requires sustained mild positive, negative and disorganized symptoms for at least 6 months (Andreasen et al., Reference Andreasen, Carpenter, Kane, Lasser, Marder and Weinberger2005). A meta-analysis of NES by Bachmann et al. (Reference Bachmann, Degen, Geider and Schröder2014) and Bachmann and Schröder (Reference Bachmann and Schröder2018) demonstrated that NES reductions (predominantly motor system subscales and to a lesser degree sensory integration scales) are more pronounced in patients with a remitting than in those with a non-remitting schizophrenia course, and that reductions of psychopathological symptoms paralleled the reduction in NES scores over time (Bachmann et al., Reference Bachmann, Degen, Geider and Schröder2014; Bachmann and Schröder, Reference Bachmann and Schröder2018). Seven studies in this meta-analysis reported on remission status; however, the included studies were underpowered, did not include an antipsychotic-naïve FEP population, and the definition for remission varied with only one study using the Andreasen criteria (Prikryl et al., Reference Prikryl, Ceskova, Tronerova, Kasparek, Kucerova, Ustohal, Venclikova and Vrzalova2012), while none used percent response categorization. Additionally, since antipsychotic effects on NES are measured indirectly, there have been mixed results regarding the side effects of antipsychotics on NES (Bachmann and Schröder, Reference Bachmann and Schröder2018), as well as mixed associations between NES and specific antipsychotic treatment response (Dazzan and Murray, Reference Dazzan and Murray2002). To our knowledge, only a few small studies have evaluated the ability of baseline and follow-up scores of NES to predict response.
Taken together, an easy to administer, bedside-elicited, endophenotypic measure such as NES could act as a predictive clinical marker for differentiating FEP patients and response outcome. Thus, in the largest longitudinal study to date of NES we aim to study the role of NES in differentiating diagnostic and response groups in a prospective FEP population with minimal to no confounding influence of previous antipsychotic usage, chronicity and institutionalization. We hypothesize that NES will be able to (1) differentiate between FEP diagnostic groups and response outcome, (2) predict diagnostic and response group classification and (3) will be associated with psychopathology and functioning, but not antipsychotic or illness duration.
Methods
Participants
The study protocol and consent form were reviewed and approved by the IRB at the University of Pittsburgh and all subjects provided written informed consent or assent. The recruitment and assessment methods were described previously (Keshavan et al., Reference Keshavan, Haas, Miewald, Montrose, Reddy, Schooler and Sweeney2003a). From 1996 to 2004, the study population comprised of FEP patients from inpatient and outpatient services of the Western Psychiatric Institute and Clinic, Pittsburgh and they were under the care of Dr Keshavan. Patients were eligible to enter the study if they were aged 12–50 years, met the DSM-IV criteria for a psychotic disorder and had a 1-year follow-up assessment. Patient exclusion criteria included subjects with significant head injury, substance abuse or dependence, neurological/medical illness, prior antipsychotic exposure or mental retardation (Keshavan et al., Reference Keshavan, Haas, Miewald, Montrose, Reddy, Schooler and Sweeney2003a). All diagnoses were formally confirmed after at least 12 months of follow-up. Healthy comparison (HC) subjects were recruited from local neighborhoods and communities in which the patients resided, underwent a Structured Clinical Interview for DSM-IV–Non-Patient Edition (First et al., Reference First, Spitzer, Williams and Gibbon1997), and exclusion criteria included a current or previous axis I disorder, history of neurological or chronic medical problem with the potential to influence brain function, prior exposure to any psychotropic medication within 6 months of baseline assessment, first-degree relative history of schizophrenia or mood disorders or mental retardation (IQ < 75) (Keshavan et al., Reference Keshavan, Haas, Miewald, Montrose, Reddy, Schooler and Sweeney2003a). We did not include any subjects who were missing predominant hand information.
Our final baseline sample included 553 subjects (349 FEP probands and 204 HC subjects). FEP probands were divided based on their DSM-IV diagnosis into two groups: 232 FEP-SZ (participants with a schizophrenia n = 65, schizophreniform n = 10, schizoaffective n = 44 or residual/unspecified SZ diagnosis n = 113) and 117 FEP-NSZ (participants with psychosis and non-schizophrenia diagnosis, such as Bipolar 1 disorder n = 17, major depressive affective disorder n = 33 or delusional disorder n = 12, reactive psychosis not otherwise specified or psychosis not otherwise specified n = 55). For a breakdown of diagnosis by maximum time point, see online Supplementary Table 1. For a comparison of baseline demographic and clinical differences between FEP participants that followed-up (n = 194) v. those that dropped-out (n = 155) at 1-year, see online Supplementary Table 2.
Clinical assessment
Neurological evaluations were carried out using an inter-rater reliable modified version of the Buchanan–Heinrich Neurological Evaluation Scale (Sanders et al., Reference Sanders, Forman, Pierri, Baker, Kelley, Van Kammen and Keshavan1998) at several time points (baseline, week 4, week 8, week 26 and year 1). All of the NES measurements were conducted by a trained and reliable rater who was blind to the clinical data and to the subjects' groups, had consistently adequate reliability (a detailed description and evaluation of inter-rater reliabilities and the purpose for modifying the NES battery can be found in the following study) (Sanders et al., Reference Sanders, Forman, Pierri, Baker, Kelley, Van Kammen and Keshavan1998) and baseline evaluations were performed prior to treatment with antipsychotics. For the diagnostic group analysis, week 4 data were excluded since only two HC subjects had NES data at this time point. Prior factor analysis and principal component analysis data (Keshavan et al., Reference Keshavan, Sanders, Sweeney, Diwadkar, Goldstein, Pettegrew and Schooler2003b) yielded two factors: repetitive motor (REPMOT; fist-ring, fist-edge-palm, alternating fist-palm and rapid alternating movements) and cognitive perceptual (COGPER, audiovisual integration, face-hand test and verbal memory). The average total NES score (TOT13) was also reported (Buchanan and Heinrichs, Reference Buchanan and Heinrichs1989; Keshavan et al., Reference Keshavan, Sanders, Sweeney, Diwadkar, Goldstein, Pettegrew and Schooler2003b). To test the stability of these two factors, we repeated the factor analysis performed by Keshavan et al. (Reference Keshavan, Haas, Miewald, Montrose, Reddy, Schooler and Sweeney2003a, Reference Keshavan, Sanders, Sweeney, Diwadkar, Goldstein, Pettegrew and Schoolerb) using the same 13 NES scores on our larger sample and we obtained the same two clusters (data not shown). For a breakdown (mean and standard deviation) of REPMOT and COGPER sub-scores by diagnosis and by time, see online Supplementary Table 3. From the 553 subjects assessed at baseline, 56 subjects were missing baseline REPMOT, COGPER, and TOT13 scores [32 FEP-SZ (13.8%), 14 FEP-NSZ (12%) and 10 HC (4.9%)]. The Amelia II R package was used for modal imputations (n = 100) using race, sex and group as nominal variables, and this was performed in all three groups at baseline (Honaker et al., Reference Honaker, King and Blackwell2011). For subjects with NES data at baseline and another follow-up time point, we calculated a NES change score by simple subtraction.
Duration of untreated psychosis (DUP) was defined as the number of weeks between the onset of psychotic symptoms and index admission into this study. This was determined by consensus based on SCID, medical records and review by the diagnostic group chaired by senior clinicians (MK or DM). Average IQ was collected from all patients using Ammon's quick IQ test (Ammons and Ammons, Reference Ammons and Ammons1962). Global functioning measures were obtained from the global assessment of functioning scale (GAF) (Endicott et al., Reference Endicott, Spitzer, Fleiss and Cohen1976) and average positive and negative symptoms were obtained from the Scale for the Assessment of Positive Symptoms (SAPS) and Negative Symptoms (SANS) (Andreasen, Reference Andreasen1990), respectively. Assessment of extrapyramidal symptoms was performed using items addressing bradykinesia-rigidity, tremor and akathisia (McEvoy et al., Reference McEvoy, Hogarty and Steingard1991).
Missing baseline Hollingshead Four-Factor Index socioeconomic status (Hollingshead, Reference Hollingshead1975) data were imputed for both missing mother (n = 48, 8.7%) and father (n = 68, 12%) data as described above, followed by averaging the parents socioeconomic status score.
Response classification
A subset of FEP probands with baseline and 1-year follow-up data for total symptoms (e.g. SANS and SAPS scores) were characterized into response and non-response groups at 1-year based on definitions reviewed by Kahn et al. (Reference Kahn, Sommer, Murray, Meyer-Lindenberg, Weinberger, Cannon, O'Donovan, Correll, Kane, Van Os and Insel2015). We were unable to use the Schizophrenia Working Group definition for remission in schizophrenia because of the relatively short follow-up of our naturalistic FEP study design, as well as the required strict remission criteria of 6 months of sustained symptom remission, which led to an underpowered sample size for subsequent analyses (n = 1 remitter at year 1) (Andreasen et al., Reference Andreasen, Carpenter, Kane, Lasser, Marder and Weinberger2005). This observation was likely due to our naturalistic study design, which meant that some participants followed up at 6-months and some didn't, which made it difficult to obtain the remission status for many of our subjects. Response groups were created by calculating a percent change score (year 1-baseline/baseline) and participants with greater than a 25% reduction in average symptoms (combined SAPS and SANS) from baseline were characterized as responsive (n = 99) and those with less than 25% reduction as non-responsive (n = 95). A 25% improvement threshold was chosen to enhance the sample size of the group comparison.
Statistical analyses
All statistical analyses were performed using the R statistical analysis software (version 3.3.3, https://www.r-project.org/). Baseline sociodemographic and clinical differences between groups were analyzed with independent chi-squared tests or one-way analysis of variance (ANOVA). NES and clinical measures were assessed for normality utilizing visual inspection of histograms. We have >95% power to detect a 1.13 mean difference between FEP-SZ and FEP-NSZ, with a standard deviation of 1.3 and sigma of 0.05 (Keshavan et al., Reference Keshavan, Sanders, Sweeney, Diwadkar, Goldstein, Pettegrew and Schooler2003b).
A repeated measures ANOVA was used to assess both a group (diagnostic and treatment response), time, group by time interaction effect and group by response by time interaction effect on REPMOT, COGPER and TOT13 using random (subject) and fixed effects (age of consent, sex, race, parental socioeconomic status, handedness and antipsychotic status). Post-hoc pair-wise contrasts (FEP-NSZ to HC, FEP-SZ to HC, FEP-NSZ to FEP- SZ, Response to Non-Response) were run for REPMOT, COGPER, TOT13, SAPS, SANS and GAF utilizing a general linear model at each time point using data adjusted for age at consent, sex, race, parental socioeconomic status, handedness and antipsychotic status. To test the effects of IQ on NES we performed an additional analysis including IQ as a covariate.
Logistic regression analysis was used to examine a baseline univariate and multivariate prediction model with diagnostic group classification as the dependent variable and predictive variables being baseline REPMOT, COGPER and TOT13 measures. Crude and adjusted odds ratios (OR), Akaike information criteria (AIC) and 95% confidence intervals were calculated for each model. A similar approach was taken for response prediction with response status as the dependent variable and predictive variables being baseline and change from baseline for week 4, week 8 and week 26 REPMOT, COGPER and TOT13 measures. All diagnostic group data was co-varied for age at consent, sex, race and handedness, but not antipsychotic status since this did have a significant contribution to our model in the repeated measure and post-hoc analysis. Response data were additionally co-varied for year 1 antipsychotic usage to consider the effect of treatment. The area under the receiver operating curve (AUC) was used to assess the capacity of the index to distinguish diagnostic and response group comparisons.
Baseline and year 1 correlation between each NES measure and clinical measures for probands, FEP-SZ, FEP-NSZ, responders and non-responders were performed using Spearman correlations. False Discovery Rate (FDR) was used to correct p values for multiple comparisons.
Results
Demographics
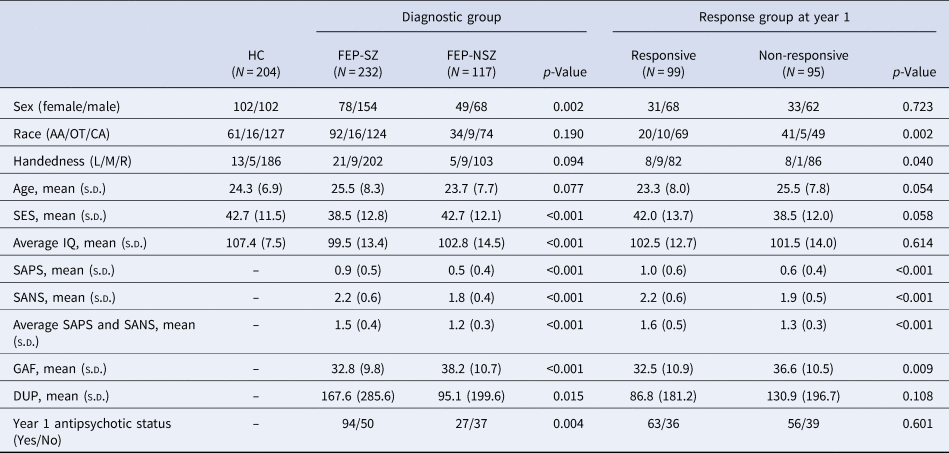
Baseline sociodemographic and clinical information for diagnostic and response groups are summarized in Table 1. Sex and socioeconomic status were significantly different across diagnostic groups, while race and handedness were significantly different in the response groups. At baseline, the FEP-SZ group showed significantly worse IQ, positive and negative symptoms, GAF scores, longer duration of illness and greater year 1 antipsychotic use compared to the FEP-NSZ group (208 FEP-SZ and NSZ participants had year 1 data). With regards to response classification, the response group demonstrated worse positive and negative symptoms, and GAF scores at baseline. There were no significant differences for IQ, duration of illness or year 1 antipsychotic status between response groups. There were no significant differences for race, handedness, age, socioeconomic class, IQ, psychosis severity or GAF between the drop-out and follow-up groups, but there was a greater percentage of women and a longer DUP in the drop-out group (online Supplementary Table 2).
Baseline demographic information for diagnostic and response groups

FEP, first-episode psychosis; SZ, schizophrenia; NSZ, non-schizophrenia; HC, healthy controls; AA, African American; OT, other; CA, Caucasian; L, left; M, mixed; R, right; SES, socioeconomic status; SAPS, Scale for the Assessment of Positive Symptoms; SANS, Scale for the Assessment of Negative Symptoms; GAF, global assessment of functioning; DUP, duration of untreated psychosis.
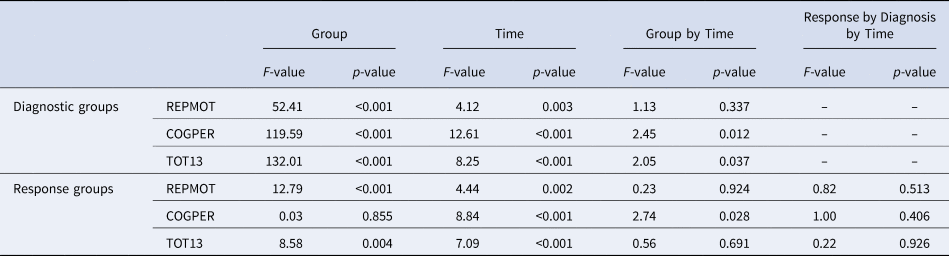
Clinical course of psychosis
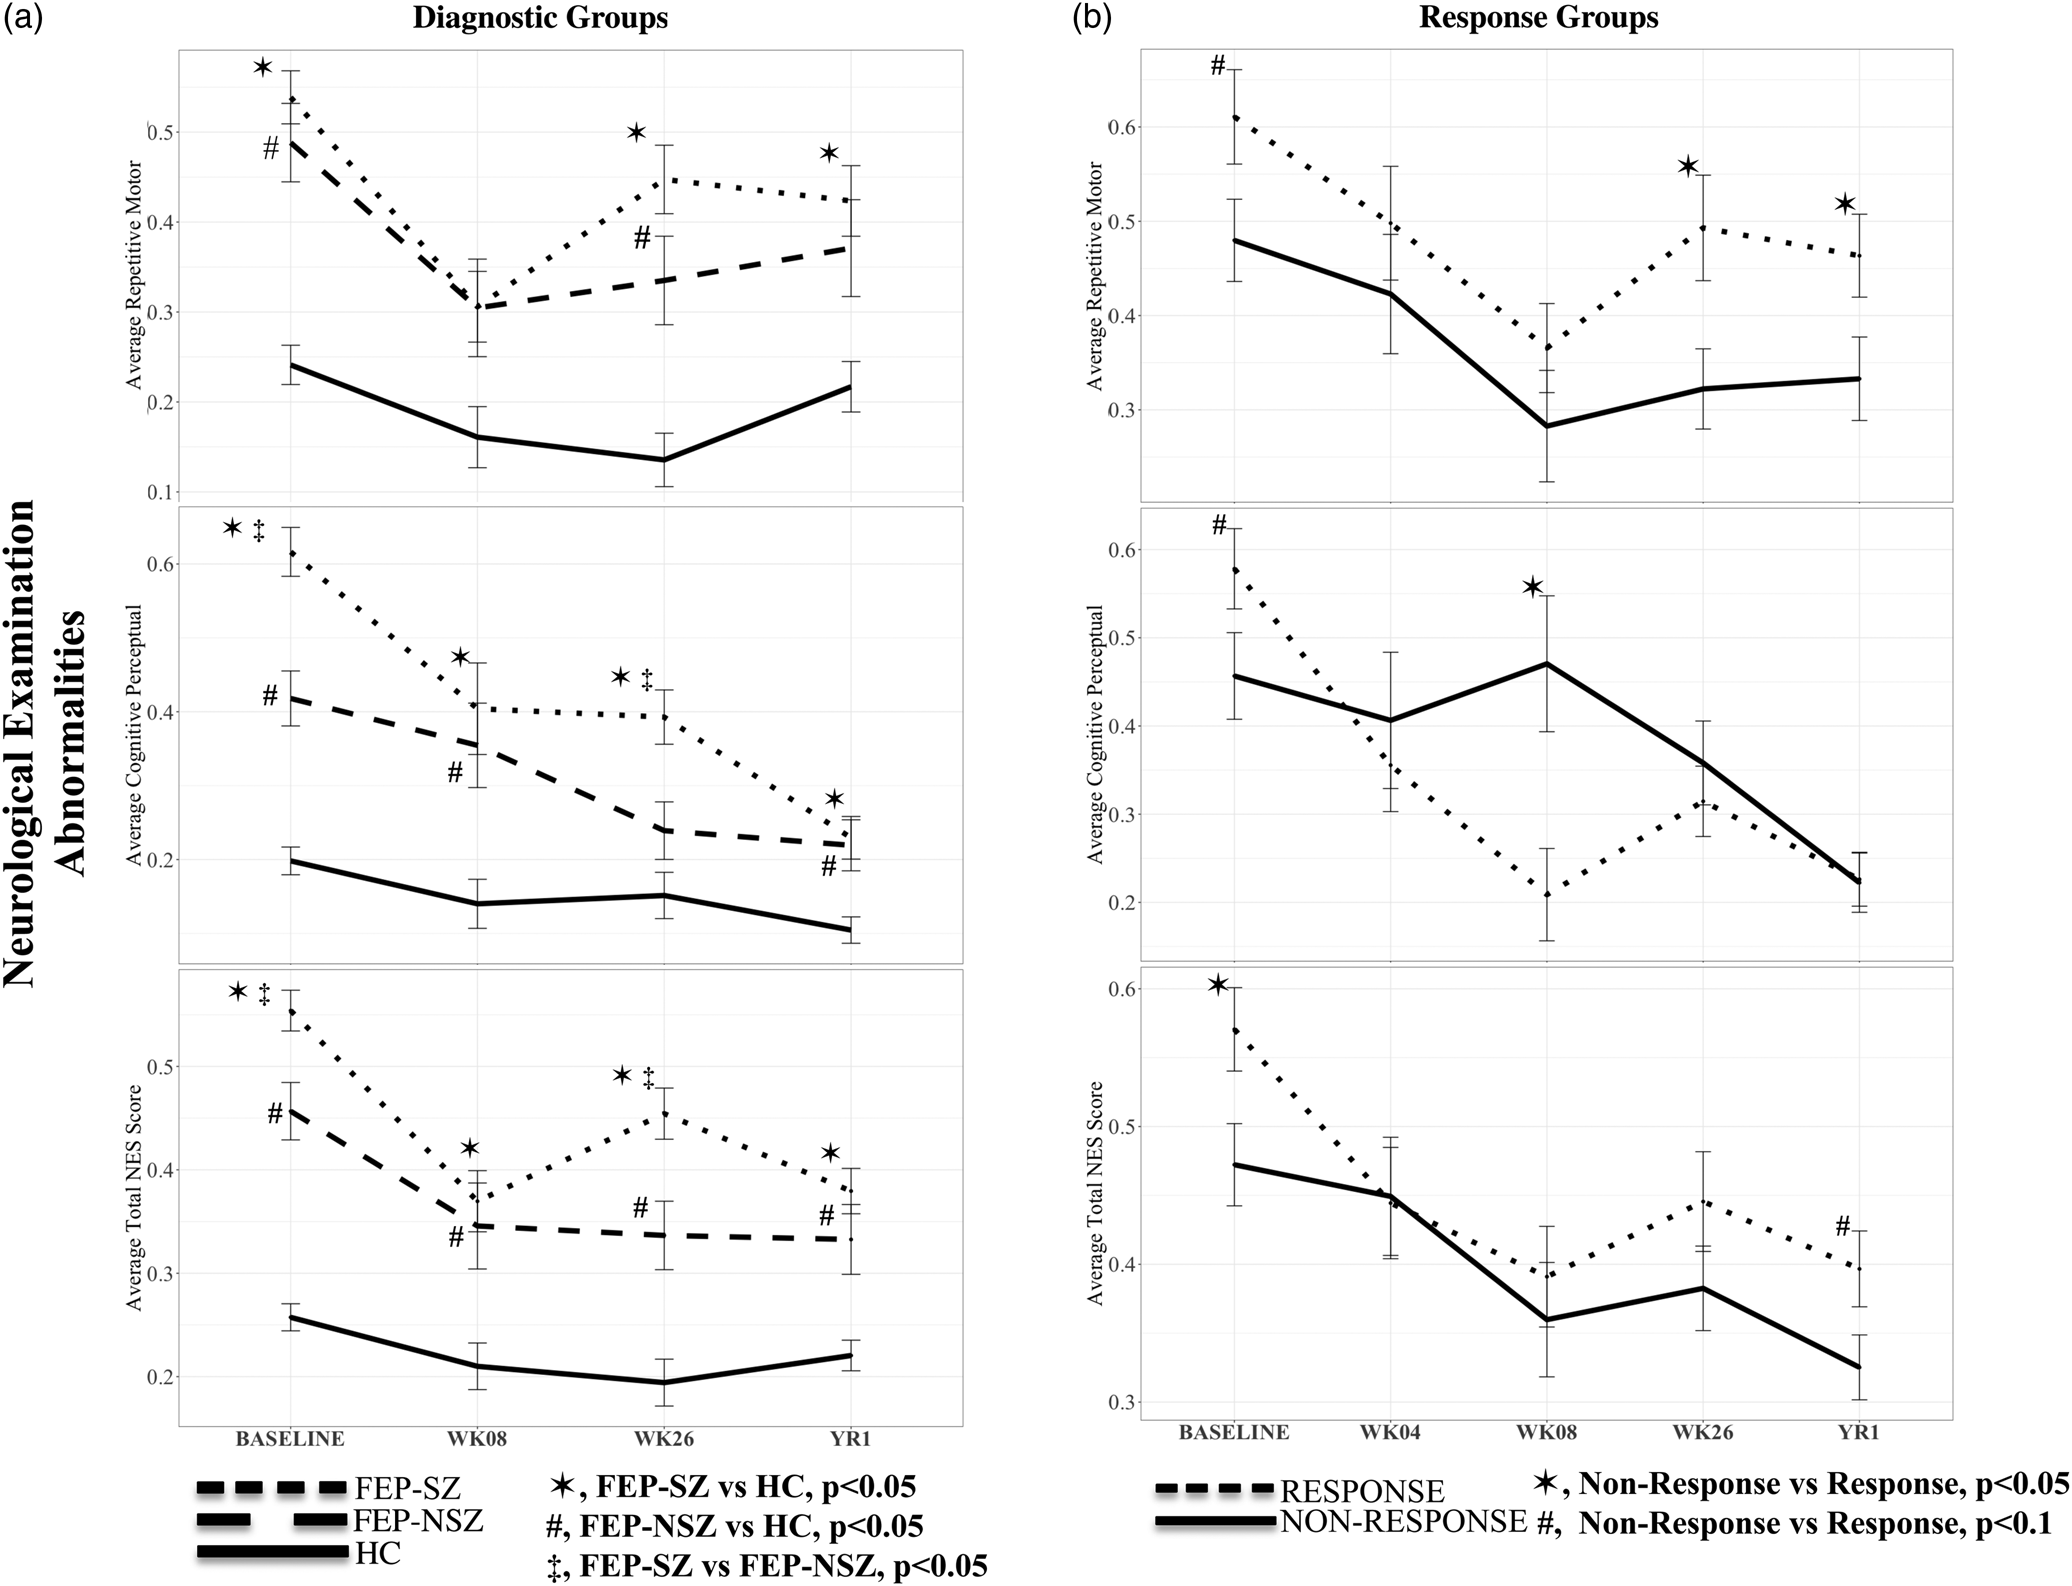
In the diagnostic group analysis, there was a significant group, time and group by time interaction (p < 0.01) for all NES measures, except for group by time in REPMOT (Table 2). Race had a significant moderating effect on REPMOT (p = 0.013, F = 3.18), but not for COGPER or TOT13. COGPER, REPMOT and TOT13 measures decreased over the clinical course of psychosis (Fig. 1a) which corresponds to a reduction in psychopathological symptoms (online Supplementary Fig. 1a) and functional improvement (online Supplementary Fig. 2a). Both FEP groups demonstrated significantly greater NES measures across the factored groups and at all-time points compared to controls, with FEP-SZ demonstrating the greatest impairments (Fig. 1a). Compared to FEP-NSZ, the FEP-SZ group had significantly worse COGPER and TOT13 scores at baseline and week 26 (Fig. 1a). Additionally, the FEP-SZ group demonstrated worse SANS, SAPS, average psychopathology (online Supplementary Fig. 1a) and GAF scores (online Supplementary Fig. 2a) compared to FEP-NSZ subjects at all-time points analyzed, except for year 1 SAPS, which demonstrated a trending difference.
Longitudinal changes in repetitive motor, cognitive perceptual, average total NES score with standard error bars across (a) diagnostic groups (b) response classification at year 1. FEP-SZ, first-episode psychosis schizophrenia; FEP-NSZ, first-episode psychosis non-schizophrenia; HC, healthy control; NES: neurological evaluation scale. Adjusted for age, sex, race, handedness and socioeconomic status.

Repeated measures ANOVA for group, time, group by time and response by diagnosis by time interaction
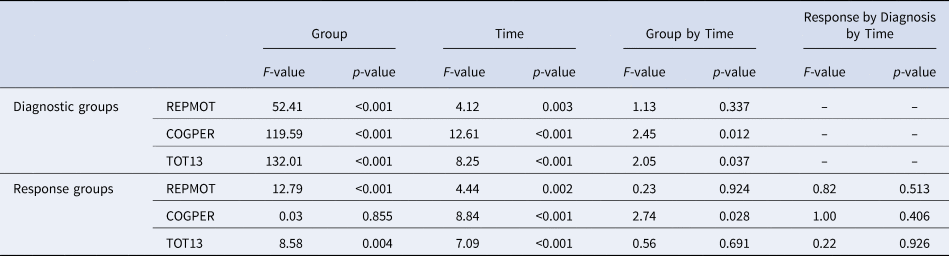
ANOVA, analysis of variance; REPMOT, repetitive motor; COGPER, cognitive perceptual, TOT13: average neurological evaluation scale total score. Co-varied for age, sex, race, handedness, socioeconomic status and antipsychotic status. Results were similar when excluding antipsychotic status as a covariate.
Response groups displayed a significant group effect for REPMOT and TOT13 (p < 0.005), as well as a significant time effect for all three measures (p < 0.003), and a significant group by time effect for COGPER (p = 0.025) (Table 2). There was no significant group by response by time effect on any of the NES measures (Table 2). Race did not play a significant moderating effect on response status for any of the NES measures. The response group showed that NES measures decreased over time (Fig. 1b), which corresponds to symptomatic (online Supplemental Fig. 1b) and functional (online Supplementary Fig. 2b) improvement. Compared to non-responders, the response group demonstrated a significantly greater difference for baseline TOT13 (p < 0.05) and a trending increase for REPMOT and COGPER (p < 0.1) (Fig. 1b). REPMOT was significantly increased in responders relative to non-responders at week 26 and year 1. At week 8, COGPER was significantly reduced in responders compared to non-responders (Fig. 1b). Responders also demonstrated significantly greater improvements in SAPS, SANS, average psychopathology (online Supplementary Fig. 1b) and GAF scores (online Supplementary Fig. 2b) at week 26 and year 1 compared to non-responders. Additionally, there was no interaction between antipsychotic status and NES scores between responders and non-responders (data not shown). Similar significant results were obtained for the diagnostic and response categorization when performing repeated measures ANOVA using unimputed data (data not shown). The distribution of psychosis severity change score in the response groups can be found in online Supplementary Fig. 3.
Prediction analysis
For the diagnostic group analysis, univariate and multivariate regressions demonstrated that baseline REPMOT, COGPER and TOT13 could predict FEP-SZ [AUC (SE): REPMOT = 0.710 (0.025), COGPER = 0.762 (0.023), TOT13 = 0.810 (0.021)] or FEP-NSZ [AUC (SE): REPMOT = 0.664 (0.033), COGPER = 0.663 (0.032), TOT13 = 0.711 (0.030)] classification compared to controls, with FEP-SZ demonstrating the greatest risk prediction (Table 3, online Supplementary Fig. 4a, b). Baseline COGPER (OR = 2.58, p = 0.001) and TOT13 (OR = 3.96, p = 0.001) were able to significantly differentiate between FEP-SZ and FEP-NSZ subjects [AUC (SE): REPMOT = 0.540 (0.033), COGPER = 0.624 (0.031), TOT13 = 0.611 (0.033)] even after controlling for sociodemographic variables (Table 3, online Supplementary Fig. 4c).
Logistic regression evaluating the effect of baseline neurological examination abnormalities on diagnostic group classification

HC, healthy controls; FEP-NSZ, first-episode psychosis non-schizophrenia; FEP-SZ, first-episode psychosis schizophrenia; OR, odds ratio; CI, confidence interval; NES, neurological evaluation scale. Co-varied for age, sex, race, handedness, socioeconomic status.
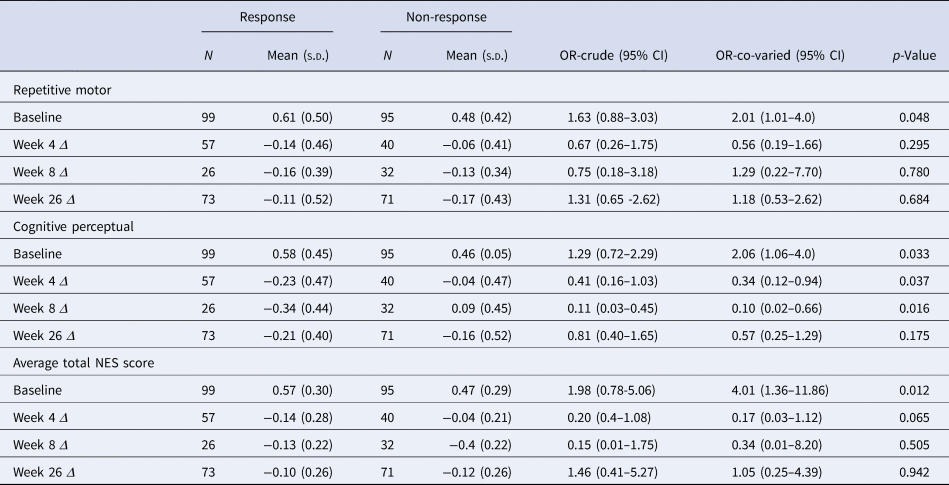
In the response group analysis, univariate and multivariate regressions demonstrated that baseline REPMOT (OR = 2.01, p = 0.048), COGPER (OR = 2.06, p = 0.033) and TOT13 (OR = 4.01, p = 0.012) could significantly predict response classification [AUC (SE): REPMOT = 0.576 (0.041), COGPER = 0.598 (0.041), TOT13 = 0.591 (0.041)] compared to non-responders (Table 4, online Supplementary Fig. 5). When accounting for DUP, the results remained significant for COGPER (p = 0.042) and TOT13 (p = 0.017), but not for REPMOT (p = 0.055). Baseline psychosis severity scores were not included in the model, since baseline scores are accounted for in the response classification, making these two variables collinear. Furthermore, changes in COGPER at week 4 (OR = 0.34, p = 0.037) and week 8 (OR = 0.10, p = 0.016) from baseline predicted response compared to non-response (Table 4). When co-varying for year 1 antipsychotic usage, baseline NES measures still predicted response classification. Additionally, there was no significant interaction effect between baseline NES scores and year 1 antipsychotic usage (data not shown). Univariate effect of diagnostic group classification, DUP or year 1 antipsychotic usage status did not predict responders from non-responders (data not shown), and as a result DUP was not included in the multivariate analysis.
Logistic regression evaluating the effect of neurological examination abnormalities on response at year 1.
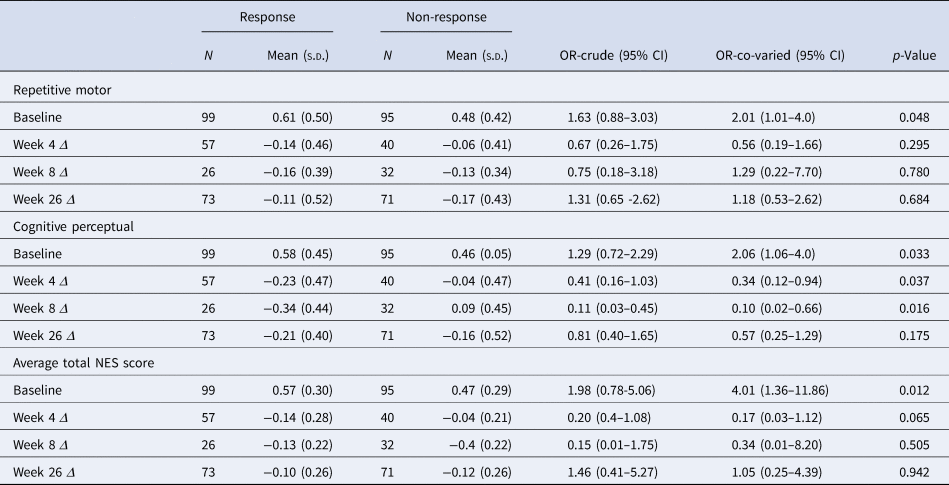
NES, neurological evaluation scale; OR, odds ratio; CI, confidence interval, co-varied for age, sex, race, handedness, socioeconomic status and year 1 antipsychotic usage. Δ, change indicates change from given time point to baseline.
NES covariance with clinical measures
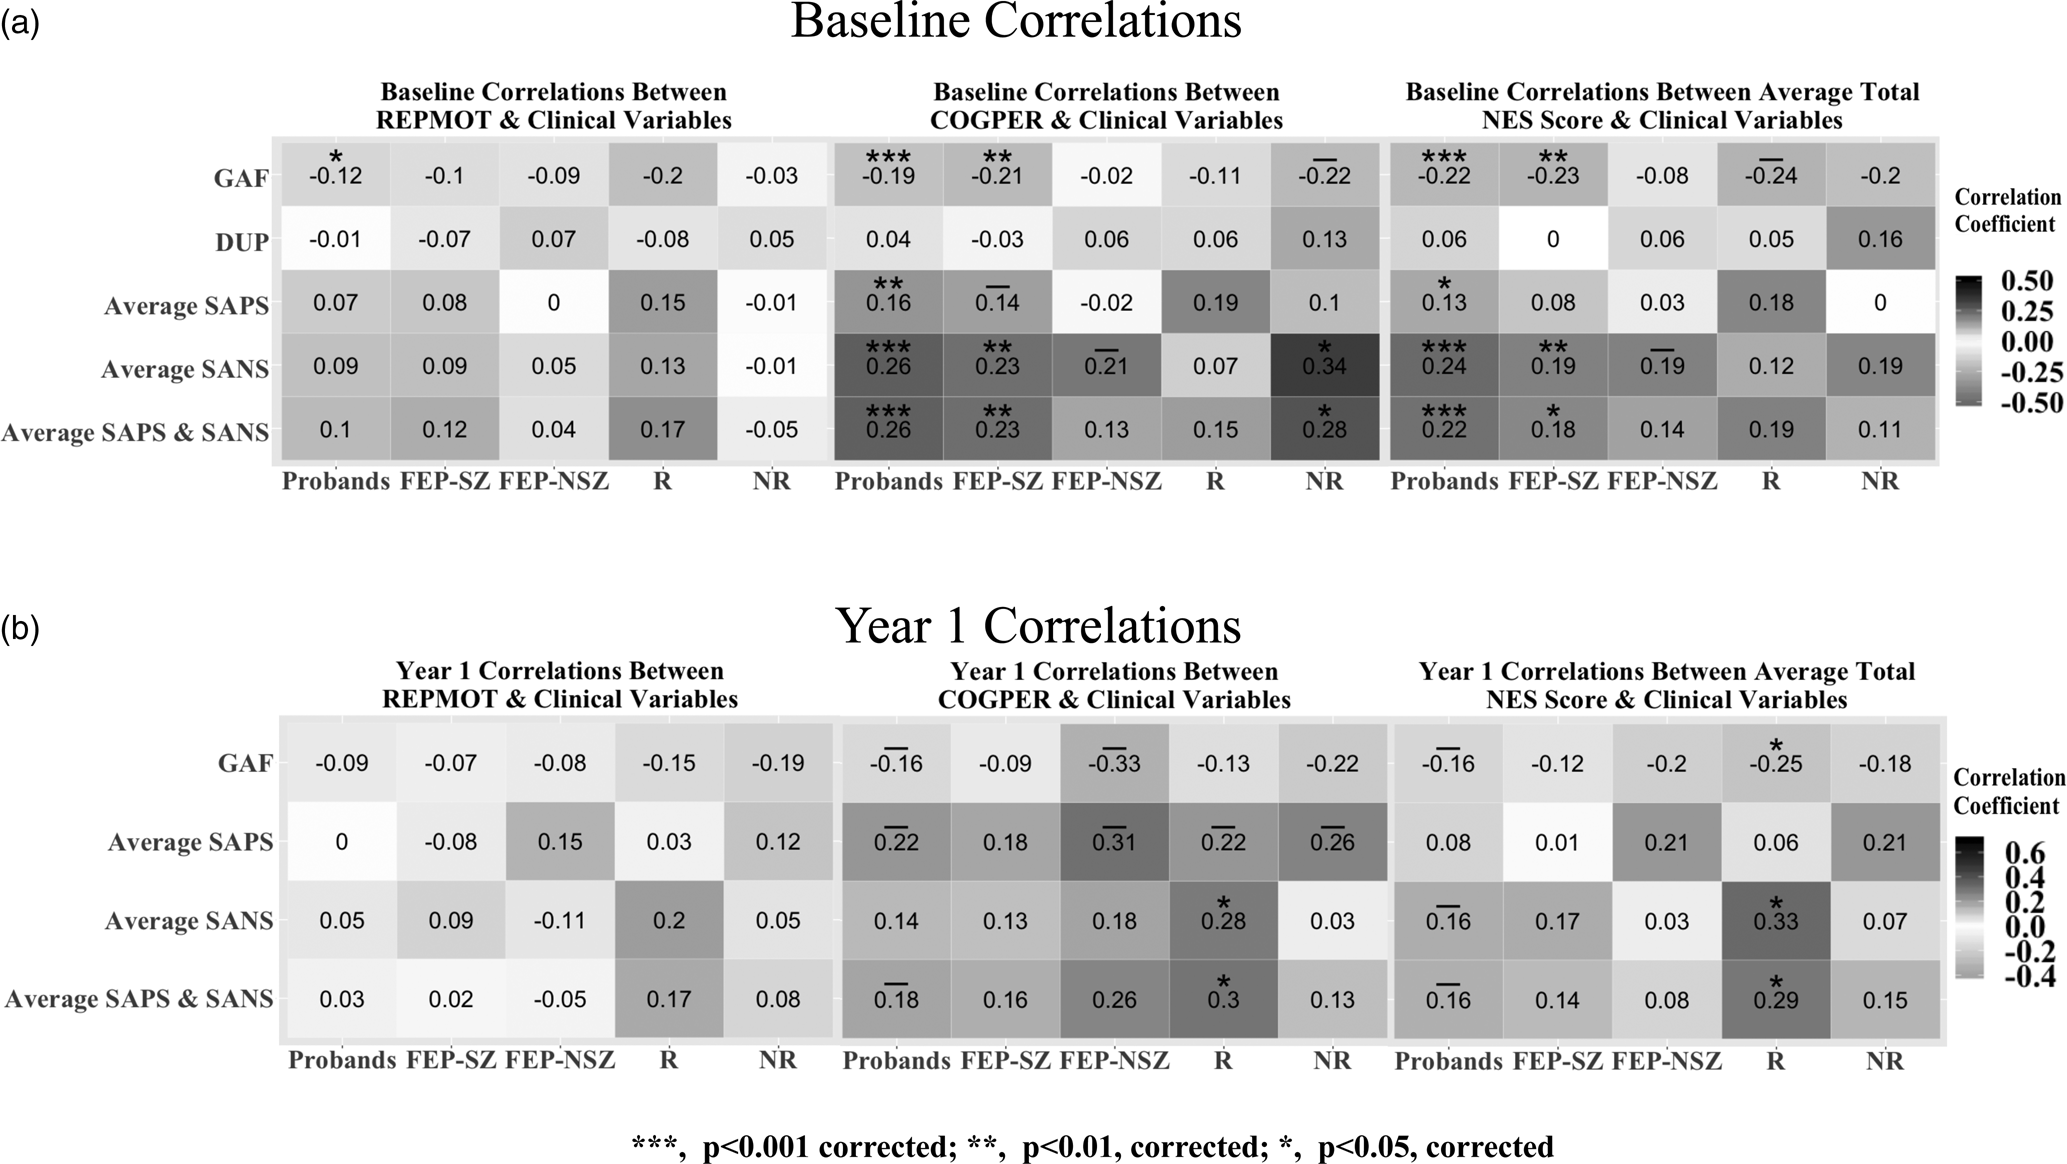
In the baseline correlational analysis, TOT13 demonstrated the greatest relationship with other clinical measures and this effect was mostly driven by COGPER (Fig. 2a). Specifically, higher COGPER scores were significantly associated with (1) worse GAF scores in probands and FEP-SZ, (2) greater SAPS scores in probands, (3) worse SANS in probands, FEP-SZ and non-responders and (4) greater average psychopathology scores in probands and FEP-SZ groups (Fig. 2a). No baseline relationships were observed for REPMOT except for GAF in probands (Fig. 2a). In a post hoc analysis, we examined the relationship between extrapyramidal symptoms (EPS) and NES scores at baseline and year 1. At baseline, none of the participants was on antipsychotics, but there was a significant positive correlation between EPS and REPMOT (r = 0.210, p = 0.005), COGPER (r = 0.196, p = 0.009) and TOT13 (r = 0.253, p < 0.001). At year 1, there was a significant positive relationship between EPS score with REPMOT (r = 0.419, p < 0.001) and TOT13 (r = 0.393, p < 0.001), but not COGPER (r = 0.122, p = 0.254) while controlling for antipsychotic status. Lastly, while there was a significant negative relationship between IQ and TOT13 (r = −0.443, p ⩽ 0.001), REPMOT (r = −0.284, p ⩽ 0.001) and COGPER (r = −0.402, p ⩽ 0.001) at baseline, the group comparisons remained similar after additionally controlling for IQ (data not shown).
Correlations between REPMOT, COGPER and total NES scores and clinical variables across diagnostic and response classification groups at (a) baseline and (b) year 1. REPMOT, repetitive motor; COGPER, cognitive perceptual; NES, Neurological Evaluation Scale, R, response; NR, non-response; GAF, Global Assessment Scale; DUP, duration of psychosis; SAPS, Scale for the Assessment of Positive Symptoms; SANS, Scale for the Assessment of Negative Symptoms. Data were adjusted for age, sex, race, handedness and socioeconomic status. (−), p < 0.1.

In the year 1 correlational analysis, COGPER continued to demonstrate the greatest number of relationships with clinical measures (Fig. 2b). Specifically, COGPER was significantly (p < 0.05, corrected) correlated with greater SANS and average psychopathology scores in responders. No REPMOT relationships were observed at year 1.
Discussion
In summary, we found that both the diagnostic and response groups demonstrated a pattern in which NES measures for COGPER, REPMOT and TOT13 decreased over the clinical course of psychosis paralleling a reduction in psychopathological symptoms and functional improvement, with FEP-SZ and non-responders exhibiting worse trajectories. Additionally, we found that baseline TOT13, and its subscale COGPER, were better than REPMOT at (1) predicting psychosis compared to controls, (2) differentiating FEP-SZ from FEP-NSZ and (3) potentially distinguishing responders from non-responders (this effect was not driven by either FEP-SZ or FEP-NSZ groups, nor by DUP). Additionally, changes in COGPER at week 4 and week 8 from baseline differentiated responders from non-responders, whereas REPMOT and TOT13 did not. We identified significant group-specific associations between COGPER and worse GAF, positive and negative symptomatology and some of these findings persisted at year 1 assessment. Similar to our repeated measures ANOVA and logistic regression analysis, we found that better COGPER scores at baseline and year 1 were associated with better psychosis symptoms (specifically SAPS and average SAPS/SANS). Lastly, we showed that neither diagnostic group classification, DUP or year 1 antipsychotic usage status had an effect on response classification. These observations are of clinical relevance since NES's may be a prognostic/predictive biomarker in an antipsychotic-naïve FEP population.
The findings reported here are consistent with the literature, which suggests that while NES scores decrease in the clinical course of schizophrenia with improvement of psychopathological symptoms, they remain impaired compared to controls (Bachmann et al., Reference Bachmann, Degen, Geider and Schröder2014). We expanded on this body of literature by examining a large group of FEP-NSZ and found that while they have fewer impairments compared to the FEP-SZ group, their clinical trajectories are similar, an observation which has not been previously described. Additionally, group differences reported here replicate our past work, which showed that compared to HC and FEP-NSZ, FEP-SZ patients demonstrated higher NES scores with COGPER scores being markedly worse (Keshavan et al., Reference Keshavan, Sanders, Sweeney, Diwadkar, Goldstein, Pettegrew and Schooler2003b). We showed that there is a significant positive relationship between EPS and NES scores at baseline and year 1 (even after controlling for year 1 antipsychotic use), which could be due to an overlap in symptoms, but further work is needed to elucidate this relationship. We also showed that there is a significant negative relationship between IQ and NES scores at baseline which did not affect our group comparison results and is consistent with the literature (Chan et al., Reference Chan, Xie, Geng, Wang, Lui, Wang, Yu, Cheung and Rosenthal2016). In a large cross-sectional study of NES across the psychosis spectrum showed that in their other psychiatric disorders group (21% bipolar disorder and 18% major depression disorder) there were no significant NES differences but did not comment on the group's psychosis status (Chan et al., Reference Chan, Xie, Geng, Wang, Lui, Wang, Yu, Cheung and Rosenthal2016). While our findings parallel our earlier work, this study is unique in that we included a larger sample and performed a predictive analysis, which demonstrated that baseline COGPER assessment may be utilized to differentiate FEP groups, which can have important implications for monitoring disease progression or to identify subjects with an increased liability toward schizophrenia. We also showed longitudinal NES stability in HCs, which is consistent with a developmental longitudinal study of 5-year duration, demonstrating that in late childhood, children typically have elevated NES scores that gradually decline with motor maturation into young adulthood and are not related to learning effects (Martins et al., Reference Martins, Lauterbach, Slade, Luís, DeRouen, Martin, Caldas, Leitão, Rosenbaum and Townes2008). In our HC sample of young adults, we observed low NES scores that remained stable over time, and the latter could not be explained by learning effects.
Consistent with the response literature comparing NES (Bachmann et al., Reference Bachmann, Degen, Geider and Schröder2014), we found that baseline NES and psychosis severity was significantly higher in responders (determined by >25% improvement in positive and negative symptom scores) and that a greater decrease in NES across the clinical course was more evident in responders v. non-responders. The non-responders tended to have less NES and psychosis severity compared to responders at baseline, but the rate of change was less prominent in the non-responder group and this was independent of DUP. A few studies have reported increased NES in non-remitters compared to remitters at the follow-up time point, but these studies have been limited by small sample sizes, inclusion of FEP participants already on antipsychotics, and inconsistent definition of remission status (Bachmann et al., Reference Bachmann, Degen, Geider and Schröder2014). A 4-year follow-up study of FEP used the Andreasen remission criteria of schizophrenia and demonstrated that remitters had improved total NES score and sensory integration/motor sequencing, while non-remitters had worse total NES score over time, however, baseline NES could not differentiate these groups (Prikryl et al., Reference Prikryl, Ceskova, Tronerova, Kasparek, Kucerova, Ustohal, Venclikova and Vrzalova2012). The association between the degree of change in NES and response categorization is consistent with previous findings (Bachmann et al., Reference Bachmann, Degen, Geider and Schröder2014; Bachmann and Schröder, Reference Bachmann and Schröder2018). We extended this area of research by demonstrating that baseline COGPER and its repeated assessment at week 4 and week 8 might be viable course predictors in antipsychotic-naïve FEP. Additionally, we accounted for the effect of diagnostic group classification, DUP or year 1 antipsychotic usage and did not identify these as predictors of response in our sample, despite divergent findings in the literature (Carbon and Correll, Reference Carbon and Correll2014). Our study is distinctive in that we performed the largest naturalistic study to date of antipsychotic-naïve FEP patients demonstrating the effectiveness as a bedside clinical tool.
NES are generally present prior to SZ diagnosis and treatment initiation suggesting that NES are an intrinsic feature of SZ (Keshavan et al., Reference Keshavan, Sanders, Sweeney, Diwadkar, Goldstein, Pettegrew and Schooler2003b; Bachmann et al., Reference Bachmann, Bottmer and Schröder2005). Also, findings from structural and functional MRI studies support the conceptualization of NES as a manifestation of the cerebello-thalamo-prefrontal brain network model of schizophrenia disorders and related psychotic disorders with some of these regions (activation in cortical motor areas, the thalamus and the cerebellum) potentially being heritable in mono- and di-zygotic twins (Zhao et al., Reference Zhao, Li, Huang, Yan, Dazzan, Pantelis, Cheung, Lui and Chan2014; Li et al., Reference Li, Huang, Xu, Wang, Li, Zeng, Lui, Cheung, Jin, Dazzan, Glahn and Chan2018). Thus, NES trajectories coupled with other diagnostic criteria may facilitate earlier SZ diagnoses and thereby improve prognosis. Since an extended duration of untreated illness is generally associated with a worse prognosis (Loebel et al., Reference Loebel, Lieberman, Alvir, Mayerhoff, Geisler and Szymanski1992), earlier recognition of these signs can lead to earlier diagnosis and earlier exposure to preventative measures. While our findings did not show significant relationships between NES and DUP, we found that COGPER was a better predictor of diagnostic and response classification (independent of diagnostic group). Additionally, the positive associations between COGPER and symptomology, predominantly with negative symptoms, but positive symptoms as well, are consistent with previous literature (Bombin, Reference Bombin2005; Chan et al., Reference Chan, Geng, Lui, Wang, Ho, Hung, Gur, Gur and Cheung2015). Moreover, past literature has not examined the relationship between NES and clinical variables across the clinical course and here we showed that there is stability between COGPER impairment and worse clinical outcomes. Therefore, NES changes seem to parallel symptomology and evaluating NES trajectories may help predict response.
There are a number of strengths of this FEP study including evaluating NES without the confounding influences of chronicity or previous antipsychotic usage. By determining the effects of NES over time, longitudinal studies show variable patterns better than when compared to cross-sectional studies. Furthermore, to our knowledge, this is the largest sample size of a single site longitudinal study reporting NES scores. We acknowledge some limitations to this study, including patient attrition, relatively short duration of follow-up, a limited collection of cognitive domains and lack of comprehensive antipsychotic dosage information. Notwithstanding these limitations, our study points to the value of further research in NES as a potentially valuable bedside marker of treatment response.
Supplementary material
The supplementary material for this article can be found at https://doi.org/10.1017/S0033291719002162
Acknowledgements
The authors thank the families who took part in this study, and the many participants who contributed to this project. This publication was supported by funds received from National Institute of Mental Health grants (NIMH) MH-45203, MH-01180 and MH- 45156 (MSK) and by NIH General Clinical Research Center grant M01 RR-00056. We thank Kevin Eklund RN MSN who performed the neurological assessments.