


I
No event as important to Britain's political history as the Labour party's supplanting of the Liberals in the early twentieth century can escape sustained historical examination – and so it has proved. For several decades now, historians have advanced two competing explanations of the collapse of the Liberal party, and of the installation of the new Labour–Conservative duopoly at the heart of British political life. The first – most associated with George Dangerfield's seminal Strange death of Liberal England – contends that the Liberals, even at their zenith in 1906, were doomed to eventual replacement by the Labour party due to the rapid onset of class politics and the escalating tension between capital and labour.Footnote 1 The second explanation rejects this sociological ‘inevitablist’ thesis by contending that the Liberals had successfully contained Labour before 1914, but were suddenly felled by the ‘rampant omnibus’ of the transformation of politics and society arising from the Great War.Footnote 2 Despite this disagreement, both sides in this debate do however agree that whether or not Liberalism was doomed by 1914, it certainly was by 1918, after the wartime split between the Asquithians and Lloyd Georgeites.
As a result, the electoral history of the 1920s tends to be studied as the consequences of prior causal factors (whether pre- or mid-war), so much so that one of the principal debates that dominate this decade (on the so-called ‘franchise factor’) is explicitly anchored in an event which occurred before any interwar elections were fought: the Representation of the People Act 1918.Footnote 3 The second debate – which centres on Chris Cook's 1975 book The age of alignment – does however accord considerably more importance to events in the 1920s.Footnote 4 Cook examines the 1922, 1923, and 1924 elections in fine-grain psephological detail, analysing shifts in support as various parties entered, withdrew, and re-entered different types of seat. Regarding the crucial question of cui bono, he argues that the 1920s saw a realignment of progressive politics, with Labour capturing the main bulk of the Liberals’ radical and working-class vote, with Conservative support remaining relatively static.Footnote 5 Others have rejected Cook's thesis by arguing that if the 1920s was an age of alignment, this did not take the form of the consolidation of the progressive vote behind Labour, but rather the hardening of the anti-socialist vote behind the Conservatives, particularly on account of the ‘red scare’ election of 1924 following the publication of the Zinoviev Letter.Footnote 6
Despite the obvious importance of the decline of Liberalism in the 1920s there remain considerable gaps in our understanding. Arguments over whether the Liberals were doomed by the advent of universal suffrage, or whether they were haemorrhaging votes primarily to Labour or the Conservatives, tells us little about the decline itself in much electoral detail.Footnote 7 This appears to be because the majority of historians take the general view that the ultimate replacement of Liberalism by Labour – whether ‘accidentalist’ or ‘inevitabilist’ in origin – was largely a fait accompli by 1918, thus rendering the story of how this electorally unfolded largely an exercise in descriptive detail above causal analysis. We reject this view by arguing – regardless of whether the fait accompli thesis is accepted – that there remains a crucial but scarcely touched auxiliary question: namely, whether the party (especially after reunion in 1923) could have performed significantly better in elections than it did in this decade, and thus whether genuine three-party politics could conceivably have been maintained into the 1930s and perhaps beyond the Second World War. While it is pertinent to ask this question both of the 1923 contest itself, and that of 1929, it is most critical to ask whether the disaster of 1924 could have been avoided or substantially mitigated. This article seeks to provide this analysis, and through doing so, make the major revisionist argument that Lloyd George – the man almost universally blamed for the evisceration – has been unfairly scapegoated by both contemporaries and historians.
Described by Sidney Webb as ‘the funeral of a great party’ and by the Daily Mail as the ‘passing of a party', this election saw the Liberals lose three-quarters of their seats to be left with just forty MPs, a cataclysm from which they never recovered.Footnote 8 While a campaign dominated by socialism versus anti-socialism rather than Free Trade versus Protection was always likely to see the Liberals lose ground, the sheer extent of the reverse suffered from 1923 cannot be overestimated. Had they managed to hold two-thirds or even half of their seats, they would have retained a strong Commons presence in what turned out to be by far the longest parliament of the decade, which would (amongst other things) have given them more capacity to influence the political narrative during the General Strike of 1926. As it transpired, the absence of a strong centrist Liberal voice in parliament during this key moment of tension between capital and labour was exactly what the party did not need in its ongoing struggle to remain politically and intellectually relevant.Footnote 9 In addition, a better showing in 1924 would have given the Liberals some foundation from which to fight in 1929, and enabled them to capitalize on the full mobilization of the Lloyd George Fund, and the intellectual revival stemming from the Summer School movement. That 1924 was a complete rout, rather than a mere setback, robbed the party of both opportunities, and ultimately from the chance to maintain genuine three-party politics into the next decade.Footnote 10
While the Liberals’ divided leadership and uninspiring manifesto in this election have certainly been criticized, most blame for the evisceration has been laid at the door of the party's feeble electioneering effort. For Cook, the Liberals in 1924 were afflicted by ‘political blindness’ and ‘were afterwards to admit that probably the single most powerful factor working against them was their limited field of candidates’.Footnote 11 This pitiful effort, where they contested just 346 seats (118 fewer than in 1923), is universally derided, with Trevor Wilson describing it as ‘fighting to lose’, Alan Sykes as ‘paralysis’, Peter Rowland as a ‘sentence of death’, and Cook as ‘nothing short of disastrous’.Footnote 12 On similar lines, Michael Hart contends that ‘the sequel to this negative, ill-organized campaign was the decimation of the party’ not least due to the number of Liberal withdrawals in favour of the Conservatives which ‘produce[d] fusion at local level and…sacrifice[d] identity which in some cases was never recovered’.Footnote 13
The lack of Liberal candidates is seen as particularly crucial for two reasons beyond the obvious message of weakness it transmitted. The first is that, in the uniquely unstable context of three-party elections in the 1920s where pacts were commonplace, few seats could really be considered safe.Footnote 14 Absence from the field limited a party's capacity to benefit from the inevitable churn – what David Powell has called the ‘lottery-like dimension of the electoral system' – which was so pronounced that the Liberal Daily News was being only slightly hubristic when it wrote (even in 1924) that ‘there was a time when it seemed absurd to attack a Tory seat in Kent, Surrey or Bucks, but that day is gone’.Footnote 15 The second is the idea of a ‘withdrawal penalty': in other words, that the intermittent presence of Liberal candidates in most constituencies – due to pacts, vacations, and re-entries – made it hard to retain electors’ loyalty, thus rendering the party unable to consolidate gains, build strength in marginal constituencies, and ultimately assemble a heartland. This stands in sharp contrast with Labour's ultimately successful approach of entering and refighting seats that initially seemed hopeless.Footnote 16
Much of the blame for the lack of candidates in 1924 – and by extension the feeble campaign run by the party more generally – centres on Lloyd George and his infamous fund, which had been accumulated in large part through the sale of honours.Footnote 17 Put briefly, Liberal headquarters urgently needed money to field a respectable 450 to 500 candidates.Footnote 18 But Lloyd George maintained that fighting so many seats in such inauspicious circumstances was hopeless, and grudgingly and belatedly provided only £50,000 of the £130,000 requested. Lloyd George is depicted as a Machiavellian figure deliberately leading the party to the slaughter, because he knew Asquith's followers would bear the brunt of the losses (and his rival likely face personal defeat at Paisley) leaving himself undisputed king of the remnant. Hart argues that he ‘had only his fund as a bargaining counter’ and ‘when the flow of Lloyd George money ceased some seats with sitting Liberals slid into inactivity’.Footnote 19 Rowland goes much further, describing the fund as ‘the equivalent of hundreds of life belts’ but Lloyd George ‘instead of hurling them into the water so the Liberal Party had at least a chance of reaching the shore…resolved to keep them locked up in his shed and to turn an almost deaf ear to all cries for help’.Footnote 20 G. R. Searle takes a similar view, arguing that ‘Lloyd George's behaviour only makes sense if one supposes that he was “riding for a fall”’, confident in the knowledge that he would be able to seize control of the party, as does Sykes, who contends that ‘the Liberal party, however moribund, was the only institutional base left to Lloyd George’.Footnote 21 Wilson depicts the Welshman as willing to weaken his party to the point of catastrophe so long as he could control it. Ultimately, according to Wilson, ‘he probably had no deep purpose: he just liked having the money…by clinging to the fund he might simply be injuring the Liberal party and bringing himself into disrepute probably did not occur to him’.Footnote 22 Donald McCormick's biography, The mask of Merlin, is most damning, judging simply that ‘he destroyed the Liberal Party’.Footnote 23
The intense interest in the fund amongst historians (and their accompanying proclivity to cite it as a crucial factor in explaining the party's collapse in 1924) broadly mirrors the contemporary interpretation of Asquithian Liberals. The veteran organizer, Sir Robert Hudson, wrote that ‘it was the unanimous opinion of agents and organizers in the country that Liberals had greatly suffered by the paucity of their candidates and general feebleness of their attack’, Margot Asquith firmly subscribed to ‘the theory that Lloyd George was the deliberate architect of the catastrophe’, while Alfred Mond complained directly to him that ‘[y]ou are placing our candidates financially hamstrung at the most critical moment of the party's history’.Footnote 24 For his part, Herbert Gladstone described the shortage of candidates as ‘desperate’ and recalled that ‘we were at least 180 short… Lloyd George then and throughout was fully aware of that fact and that without his aid we could not have an effective force in the field’.Footnote 25 Vivian Phillipps, the Liberal chief whip who tried to persuade Lloyd George to fund 400 candidates, directly blamed him, writing in his privately published autobiography that ‘the party had been assassinated and the electors had no use for this corpse’.Footnote 26
Lloyd George – who apparently rebuked Phillipps's protest that just 300 candidates meant ruin with the reply ‘oh no, this election does not count’ – thus assumes the role of chief villain. John Campbell's reading – which takes seriously the Welshman's stated argument that party organization required overhauling before funds could make a difference – is one of the few that extends him some sympathy.Footnote 27 But, mindful that the 1924 election sealed the Liberal party's demise, it is hardly surprising that few historians have taken Lloyd George's misgivings about Liberal organization's primitive state – which he likened to fighting with ‘bows and arrows’ and ‘wooden ploughs’ in 1924 – as representing the sincere reason he refused to mobilize the fund fully until 1925 when the party became his.Footnote 28 Nonetheless, the extent to which the embittered judgements of Asquithians have been taken virtually at face value by historians is striking, especially because it remains entirely unclear what difference more candidates would have actually made in 1924. The first section of this article below attempts to shed light on this crucial question, and its ramifications in 1929.
In addition to investigating the extent of Lloyd George's role in the collapse of 1924, an investigation into the psephology of this election also has implications for our broader understanding of the inevitability of the relegation of the Liberals to a distant third party. This is important because this by no means looked certain, or even likely, prior to the election, which was widely interpreted by contemporaries as an unexpected calamity for the party that in no way reflected their still substantial reserves of popular support. Auguries of the likely result were pessimistic but did not foresee disaster. On the eve of polling, the Manchester Guardian predicted 100 Liberal seats, the Daily Express between 85 and 124, and the Fortnightly Review carried the relatively unalarming assessment that ‘not even the most sanguine Liberal believes at this moment that he can hope to be in a majority in the new Parliament’.Footnote 29 The previous year, a poll for the department store Selfridges, weighted by recalled votes from 1923, forecast an unpromising but far from calamitous national vote share of 21 per cent.Footnote 30 Indeed, even widespread acknowledgement that the election was largely a single-fronted battle between socialism and anti-socialism did not inspire forecasts of a Liberal collapse, with the Daily News predicting only that ‘the public will be in no mood to make fine distinctions’, and the Conservative campaign manager, Lord Younger, simply that ‘it is a difficult matter to forecast the result of [the] election…but I am quite confident that if Unionists and Liberals work together and cooperate in certain constituencies…it will tend to the advantage of both parties’.Footnote 31 After the election, discussing the Liberals’ evisceration, the Economist reported that ‘no party prophet foresaw its extent’ but also stressed that
no impartial observer will believe that the 2,900,000 or so votes polled by the Liberal party represent the true strength of Liberalism in the country…nor, we imagine, will any but the most partisan of Conservatives pretend that the 7,400,000 total does not greatly exceed the figure of the true supporters of Conservative doctrine.Footnote 32
The Nineteenth Century and After also doubted the permanence of the seeming realignment from Liberal to Conservative, noting ‘the electoral “reserves”, two million strong, who appear when the issue seems to them vital to the national life and to themselves, were thrown into the battle on the Conservative side’ only in the particular circumstances of October 1924.Footnote 33 In a deeper examination of the results published in December, Lord Raglan concluded that even if Labour won every constituency where they had a chance in the next election they would remain in a minority, and still placed the reasonable upper limit of Liberal ambition as high as 200 seats.Footnote 34
This interpretation – that the 1923 result was the truer reflection of the underlying strength of united Liberalism in the 1920s, and 1924 the aberration – has also found considerable support from historians, with Cook in particular arguing that ‘by 1923…the process of decline had not reached the stage when recovery was impossible’ and sees 1924 as an ‘opportunity…let slip’.Footnote 35 This forms part of an important (if overlooked) secondary argument of Age of alignment: that the Liberals greatly accelerated their decline by the way they fought elections throughout the 1920s. For Cook, the party's poor organization, its unhealthy reliance on pacts, and particularly its inability or reluctance to field candidates consistently is encapsulated by the damning statistic that they managed to win as many as 281 seats at least once in the five elections held between 1918 and 1929, but could hold only 22 throughout the period.Footnote 36 Other historians have referenced Liberal electioneering efforts largely in passing, but are equally unequivocal that the result in 1924 in no way reflected the party's true strength. Searle cites the ‘bias in the electoral system’ which ‘cruelly disguised the underlying Liberal strength’, while Powell contends that, even after the debacle, Liberalism was ‘not yet extinct as a political force and there was the possibility that under fresh leadership it might yet revive sufficiently to reclaim a place at the centre of power’.Footnote 37 Phillip Williamson also stresses that, for much of the period after 1926, a return of up to 120 seats (and with it the potential role of kingmaker) at the next election was widely envisaged.Footnote 38 More general accounts also see 1924, rather than 1923, as the exceptional result, with Campbell describing it as ‘a surprise to many'; Paul Adelman as a ‘shock'; A. J. P. Taylor as ‘freak'; and John Ramsden (commenting on the scale of the Unionist triumph) as ‘entirely unexpected’.Footnote 39 While Wilson – who argues that the 1923 castle was built of sand and always likely to be swept away when circumstances changed – represents something of a dissenting voice, he nonetheless joins the great majority of historians and contemporaries in pointing the finger of blame at the Liberals themselves – and especially Lloyd George –for causing (or at least greatly exacerbating) the 1924 disaster.Footnote 40
II
Before we begin our analysis of electoral politics in the 1920s, it is first necessary to discuss method. This article is primarily (although not entirely) psephological, prioritizing an extensive quantitative analysis of electoral data above reconstruction of campaign language and discourse. While the popularity of the ‘linguistic turn’ in political history has rendered such data-driven approaches less fashionable than they were in the heyday of ‘electoral sociology’ in the 1970s, the power and utility of historical psephology for explaining election results and shifts in party dynamics is considerable.Footnote 41
Elections in this period were notoriously messy, and require careful statistical handling. The first problem is that the contests of 1918 and 1922 featured two separate Liberal parties and (in the former) the coupon. The second is that the whole period saw constant withdrawals and re-entries by parties, as well as innumerable constituency pacts designed to consolidate, split, strengthen, or weaken one party or the other. Many constituencies shifted from straight fights (i.e. those featuring two of the main parties) to triangular contests (where all three entered the fray) and back again. Traditional two-party swing can often be rendered almost meaningless in such circumstances, as can national vote share.
A key development that allows us to move beyond the analysis of Cook is the recent (although still almost entirely overlooked) digitization of F. W. S. Craig's British parliamentary election results.Footnote 42 This hugely expands the potential scale and scope of historical psephology, allowing us to perform large-scale comparative analyses of the whole nation, rather than (like Nick Smart) in practice being restricted to a single region or (like Jon Lawrence and Jane Elliot working in a slightly earlier period) a single type of constituency.Footnote 43 National analyses also represent the most powerful means of cutting through the confusion of withdrawals, re-entries, pacts, and straight versus triangular fights, to assess holistically the size and loyalty of the Liberal voting base. Accordingly, we have provided a number of general statistical tables – which go considerably beyond those found in Craig or Cook – as Appendices.
The first section of this article analyses to what extent the electoral data suggests that the Liberals could have managed better performances, especially in 1924, through a fuller and more strategically intelligent electioneering effort. This sheds light on whether the floundering Liberal ship was suddenly sunk by one disastrously misfought election, or whether the 1924 result was in fact an accurate reflection of the party's underlying position which more candidates and money would have done little to improve. We perform three major statistical analyses. First, we forecast how well the Liberals would have performed with more candidates, especially in 1924. Secondly, we assess the crucial question of the ‘vacation penalty’ when the Liberals re-entered a seat in which they had previously stood aside. This allows us to shed light on whether Liberal prospects of recovery in 1929 were harmed by leaving so many constituencies without a candidate in 1924. Thirdly, we investigate a major psepholgical variable which has been almost entirely ignored in existing accounts of the period: turnout. The aim is to gauge whether there was a substantial group of electors who would have voted Liberal in the 1920s, but were unable to do so because they lacked Liberal candidates to vote for.
Having provided quantitative analysis of the impact of the Liberals’ lack of candidates, this article's second section moves away from psephology by investigating contemporary interpretations of these developments through a study of constituency election campaigns in 1923, 1924, and 1929. It concentrates on constituencies where Liberal withdrawals (and re-entries) seem the most baffling or counter-intuitive: for example Kinross and West Perthshire, which the Liberals came within 150 votes of winning in 1923 but withdrew from in 1924, or Bury St Edmunds, a safe Unionist seat which the party curiously chose to enter in 1924 having not put up candidates in 1918, 1922, or 1923. This analysis sheds light on how grassroots Liberals, their opponents, and the local press interpreted the party's constituency electioneering efforts in 1924 and 1929, and to what extent they ascribed the decline from 1923 as being caused by the lack of resources or candidates.
It may be observed that this section's methodology differs from that of the vast majority of previous histories of Liberalism in the 1920s, which have primarily focused on understanding divisions at the top of the party, and internal disputes over the use or misuse of the Lloyd George Fund. The principal source underpinning such analyses has been the minute examination of private papers, memoranda, and diaries. While this approach has self-evident benefits, this article quite deliberately moves away from it, for two reasons. First, we contend that, regardless of which senior figure said what to whom, the actual effect that these decisions had on the fortunes of Liberalism in 1924 in the constituencies themselves still remains largely unknown. Secondly, we observe that, despite intense interest in the fund, no admission in any letter or memorandum yet discovered by numerous biographers (many of them highly critical of Lloyd George's conduct following reunification) suggests anything approaching an admission from their subject that he deliberately starved the party of cash in 1924 to weaken it. Given the Welshman's notorious coyness about his fund, this is hardly surprising. For both these reasons, it may thus confidently be asserted that much more is to be gained through a methodology which can shed light on electoral politics in the 1920s by moving away from the rarefied world of the Lloyd George papers and those of Asquithian contemporaries.
III
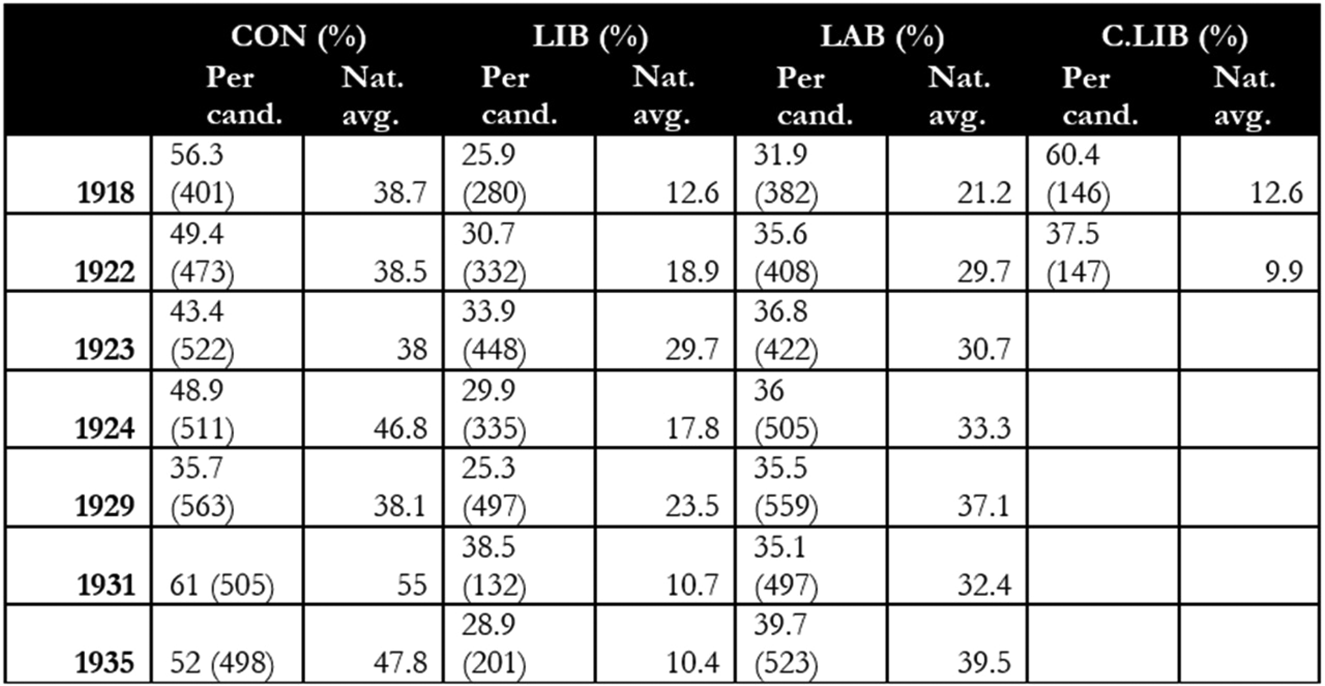
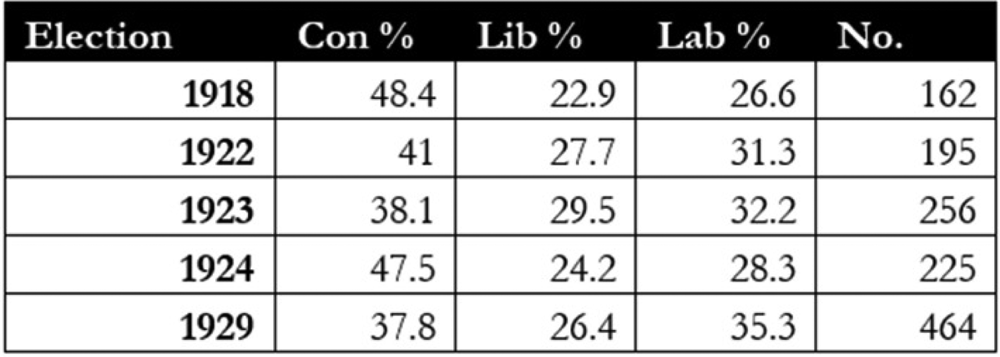
We begin by providing figures for average vote share per candidate throughout the period, which is shown in Appendix 1, supplemented by Appendix 2, which breaks this down by straight fights and triangular contests. These rather fundamental statistics are, quite remarkably, not provided in other accounts (including Cook's) on anything approaching a comprehensive basis, with most simply using national party averages which do not take the number of candidates (or which opposition parties they ran against) into account. Turning to Appendix 1, we can immediately observe that the Liberal candidates who fought in 1924 secured an average vote share of 29.9 per cent: 4.6 percentage points higher than in 1929, and only 0.8 and 4 percentage points lower than in 1922 and 1923 respectively. Where Liberals stood in 1924, their candidates thus performed respectably, polling vote shares which were quite typical for Liberal candidates, which ranged from an average of 25.3 per cent to 33.9 per cent in the period 1918 to 1929. In addition, Labour candidates did not on average perform any better in 1924 (where they averaged 36 per cent per candidate) than they had in previous elections in the 1920s (where they maintained a very consistent average vote share of 35.5–36.8 per cent).
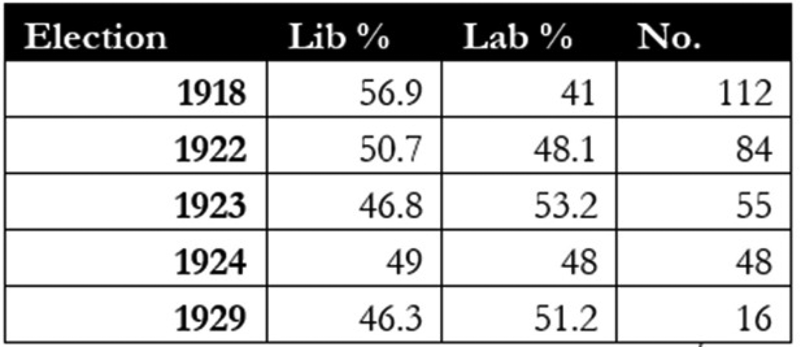
Breaking this analysis down by contest type adds a further layer of nuance. Appendix 2.4, which displays triangular fights, shows the Liberals lagging behind Labour by an average of 4.1 percentage points in 1924, compared to 3.6 behind in 1922, 2.7 behind in 1923, and 8.9 behind in 1929. Put simply, Labour were always stronger on average in three-cornered fights in the 1920s, and 1924 was typical rather than exceptional. Turning to the forty-eight straight fights between the progressive parties in 1924 (Appendix 2.3) the Liberals actually led Labour by one percentage point, compared to 2.6 points ahead in 1922, 6.4 behind in 1923, and 4.9 behind in 1929. This again does not suggest that 1924 was a particular annus horribilis. Overall, the Liberals did not perform any worse in 1924 against Labour competition in either triangular or straight fights than was typical throughout the 1920s. Their real collapse in 1924 came against the Conservatives: in straight fights, they fell away from just 0.2 percentage points behind them in 1923 to 15.2 points adrift in 1924 (Appendix 2.2). In triangular contests, this respective gap widened from 8.6 percentage points to a massive 23.3 points (Appendix 2.4). This national data appears to corroborate Smart's argument that the realignment of 1924 represented a shift from Liberal to Conservative rather than Liberal to Labour.Footnote 44
While historians have hitherto lacked aggregate psephological data of comparable granularity, it is nonetheless easy to see why they have blamed organizational failure for hugely exacerbating the Liberal rout of 1924. Put simply, candidates seemed to perform respectably in isolation against Labour, but somehow the party ended up winning just forty seats overall. The obvious explanation seems to be that the Liberals made poor strategic choices on which constituencies to fight, evoking parallels with the disastrous electioneering efforts of 1895 and 1900, where the party not only ran too few candidates, but also made poor strategic choices of where to concentrate their scarce resources to maximize seats won.Footnote 45 We examine this hypothesis in Figure 1, which analyses the 245 seats which the Liberals did not contest in 1924, providing forecasts of how well the party might have fared had they fielded candidates.Footnote 46
Projected average Liberal candidate performance in 1924 in the 245 constituencies they did not contest

We can use this data to estimate what the Liberals really surrendered in 1924 through leaving so many seats vacant, and whether their seemingly limp effort cost them a large number of seats. In the 136 constituencies vacated in 1924 that they had fought in 1923, the party averaged 26.7 per cent of the vote per candidate, which we adjust downwards to a 22.7 per cent estimate (given the national 4 percentage point decline in Liberal vote share per candidate shown in Appendix 1). On face value, these 136 constituencies were thus not a group where many Liberal candidates stood a realistic chance of victory: the party won just six of them in 1923, and all of these MPs in fact ran in 1924 as anti-socialist ‘Constitutionalists’: a move which enabled four to be returned with Conservative support in straight fights against Labour, compared to the two we forecast would have been victorious had they fought as Liberals.Footnote 47 Additionally, in only twenty-five of these 136 seats did the Liberals surrender a firm foothold (defined as 40 per cent or more of the vote in a straight fight and 30 per cent or more in a three-cornered contest), suggesting that precious few seats surrendered were in plausible striking distance even had 1924 in fact turned out to be a favourable election for Liberalism. We can also go back further to seats vacated before 1923. Here, we find groups of twenty-four and thirty-one last fought by Liberals (not National or Lloyd George Liberals) in 1922 and 1918 respectively, where we can estimate respective average vote shares of 17.2 per cent and 25.5 per cent had they been fought in 1924. Eleven of these seats had been won previously (all in straight fights) and we forecast that the Liberals would have retained eight of them in 1924 so long as a triangular contest could have been avoided.Footnote 48 This is a very substantial caveat, however, given the increasing Conservative reluctance to stand aside in favour of Liberals after their reunification in 1923.Footnote 49
Overall, it seems far-fetched to forecast the Liberals would have won any more than a dozen additional seats in 1924 even if they had run candidates in all of the 245 they left vacant, and even these tiny smattering of potential gains would have been highly dependent on continued Conservative co-operation. Therefore, it can be confidently asserted that historians – and Asquithian organizers – have greatly overstated the psephological impact that more candidates would have had on the number of seats the Liberals could have actually won in 1924, even if such candidates would have had the superficial effect of boosting Liberal vote share nationally.
The damage the Liberals supposedly did to themselves through mass withdrawals in 1924 also has implications for 1929. It is argued that by vacating seats so readily – and so often leaving Liberal voters with no Liberal candidate to vote for – the party squandered the opportunity to maintain voter loyalty and foster a heartland of reliable seats. This stands in contrast to Labour, who seemingly built strength gradually by doggedly fighting and refighting even hopeless constituencies. The importance of 1924 to this broader argument is that it was the election where the Liberals abandoned the hard-won bridgehead secured in 1923 which might – even if damaged one year later – have given them a position from which to fight in the more auspicious political circumstances of 1929. As it transpired, 178 Liberal candidates in this final election of the decade had to re-enter constituencies where no Liberal had stood for at least six years, and to solicit Liberal voters who would have previously been forced either to stay at home, or to vote Conservative or Labour.
In these 178 seats which the Liberals re-entered in 1929, they polled an average of 20.3 per cent of the vote per candidate, with just ten receiving more than 35 per cent. Breaking this down further by analysing the aforementioned sub-group of 136 (i.e. the seats fought in 1923 that were vacated in 1924), we find that the Liberals re-entered no fewer than 122 of them in 1929, polling an average of 19.3 per cent of the vote. This translates to an average 7.4 percentage point decline in vote share compared to 1923, compared to the 8.6 percentage point average decline between these two elections that Liberal candidates suffered nationally (33.9 per cent in 1923 and 25.3 per cent in 1929, see Appendix 1). Rather than a vacation penalty, the Liberal candidates that returned in 1929 if anything received a small vacation bonus.
Deeper analysis confirms this general picture. In the aforementioned group of twenty-five seats where the Liberals in 1924 vacated a firm foothold (i.e. a 1923 poll of 40 per cent or more in a straight fight or over 30 per cent in a triangular contest) we find that, in the eight three-cornered 1923 fights, they once again faced both Conservative and Labour opponents in 1929. In them, they averaged 22.4 per cent of the vote in 1929 compared to the 32.5 per cent they had won six years previously. Relative to the national change in vote share per candidate, Liberals in these eight three-way fights do just 1.5 percentage points worse than we might have expected. Turning to the seventeen straight 1923 fights, all bar Fylde; Glasgow Shettleston; and Hamilton were re-entered in 1929. All fourteen became triangular contests, with the Liberals losing them all, with only one remotely close.Footnote 50 Their average vote share in these constituencies was 28.7 per cent in 1929, compared to 44.6 per cent in 1923: a substantial 15.9 percentage point decline. However, we must obviously control for the fact that all these constituencies moved from straight fights in 1923 to triangular contests in 1929 (a development which inevitably depresses the vote share of the two original parties). While there is no perfect methodology for this, if we simply compare the Liberals to the winning opposition party alone, and recalculate the 1929 vote shares as if they were straight fights, we find that the Liberals would have averaged 38 per cent of the vote compared to 62 per cent for their opponents.Footnote 51 Compared to the 44.6 per cent they received in these constituencies in 1923, this represents a projected 6.6 percentage point drop. This is actually roughly in line (in fact slightly better) than the 8.6 percentage point average decline per candidate suffered nationally between 1923 and 1929 (Appendix 1).
The obvious objection to the data presented in the two paragraphs above is that they do not control sufficiently for the natural vagaries of movements between straight and triangular fights from one election to the next. We can do much to mitigate this, however, through analysing a group of seventy-seven constituencies – shown in Figure 2 – which were fought by all three parties in 1923 and 1929, but which were left vacant by the Liberals in 1924. In these, the Liberal vacation penalty – calculated by comparing the move in their vote share in these seats between 1923 and 1929 to that seen in all triangular contests nationally (Appendix 2.4) – stood at a meagre 1.1 percentage points. The slimness of this penalty is rendered particularly stark when it is pointed out that, by the same calculation, the Conservatives actually fell further – by 1.6 percentage points – in their triangular contests between 1923 and 1929. This is despite the Tories having the luxury of maintaining candidates in no fewer than seventy-six of the seventy-seven seats in 1924, compared to the Liberals without any at all.
The seventy-seven triangular contests fought by the Liberals in 1923 and 1929, which they withdrew from in 1924
Note: In some instances, the sum of these figures falls slightly short of 100 per cent due to the exclusion of a handful of minor fourth-party candidates. Figures for triangular contests nationally are supplied for comparison.

Overall, there is very little evidence of any vacation penalty suffered by re-entering Liberals in 1929. Indeed, the absence of a vacation penalty can also be observed in the performances of other parties. If we examine the twenty-three seats Labour fought in 1922, vacated in 1923, and re-entered in 1924, we find that re-entering Labour candidates suffered an average vacation penalty of 4 percentage points compared to the national vote movements shown in Appendix 1: more than the Liberals, but still relatively small. The Conservatives were quite consistent with where they chose to stand aside (thirty-seven of the seventy-two seats they left vacant in 1922 were also not challenged in 1923 or 1924) but in the nine constituencies where they stood in 1922, withdrew in 1923, and re-entered in 1924, their vote share rose from an average of 31.3 per cent to 39 per cent respectively per candidate. Taking into account national changes between 1922 and 1924, these re-entering Conservatives polled 7.2 percentage points better than we might have expected, delivering them a substantial vacation bonus.Footnote 52 Overall, there is little evidence that any party suffered a particular penalty for vacating seats when they chose to re-enter them.
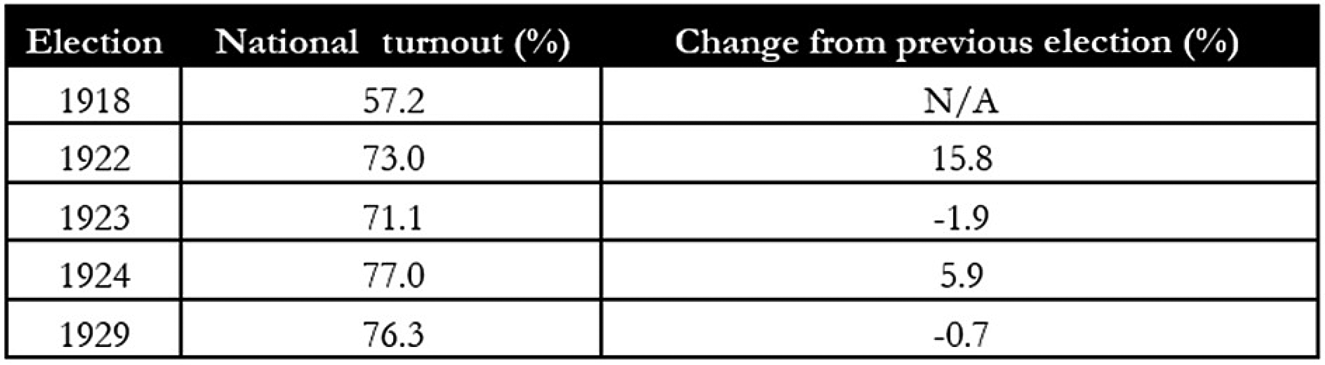
While re-entering Liberal candidates did not appear to suffer (in terms of vote share) any discernible penalty for their party's intermittent presence in the constituencies they were fighting, there remains the question of turnout. Simply put, is there any evidence that the absence of Liberal candidates led to a portion of stalwart Liberal voters staying at home, potentially weakening their loyalty and proclivity to back the party when it did return and put up a candidate? We can begin to investigate this by looking again at 1924, where we find that the presence of a Liberal candidate had little effect on average turnout: in the 245 constituencies without one, average turnout was 75.9 per cent, just 1.1 percentage points lower than the national turnout of 77 per cent. Looking at the 136 seats the Liberals had freshly withdrawn from since 1923 reveals an almost identical picture, with an average turnout just one percentage point lower than nationally.Footnote 53 In 1929, when the Liberals re-entered 122 of these 136 seats, there was a negligible turnout boost of 0.2 percentage points compared to the national average of 76.3 per cent.
A more granular analysis can be obtained through a direct comparison of average changes in turnout in constituencies which Liberals vacated, having fought at the last election. This can also be reversed by analysing average changes in turnout when Liberals re-entered constituencies previously vacated. After adjusting for changes in national turnout (see Appendices 3.1 and 3.2) we can thus infer ‘Liberal vacation’ and ‘Liberal re-entry’ turnout effects for each election. This analysis is shown in Figure 3.
The effect of Liberal withdrawals and re-entries on turnout, 1922–9
Note: The numbers given in brackets after the Liberal vacation and re-entry figures are the number of comparable examples. This difference arises due to unopposed returns, which naturally do not produce turnout figures. Note also that for the purposes of this analysis, Lloyd George and National Liberals in 1918 and 1922 are counted as Liberals.
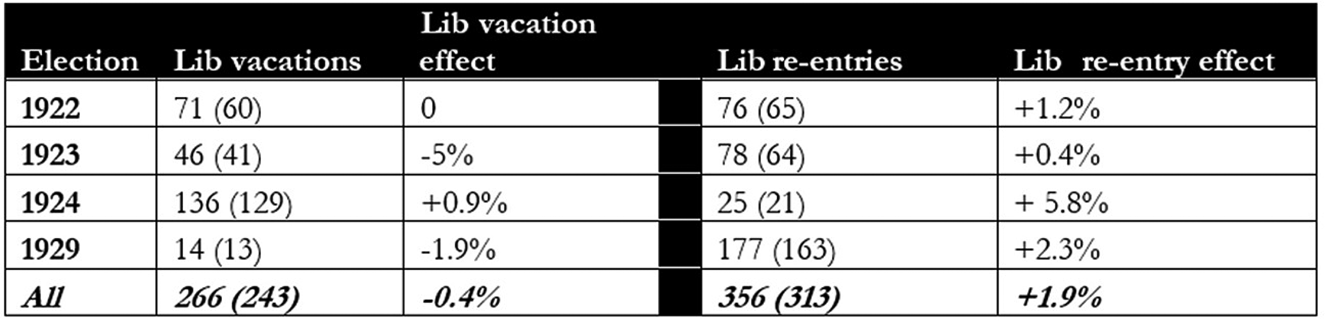
Figure 3 shows that, in the 243 comparable instances throughout the period where the Liberals vacated a constituency previously fought throughout the 1920s, turnout was depressed by just 0.4 of a percentage point. The only election where a significant number of Liberal voters with no candidate to vote for did appear to stay at home was in 1923, where in the forty-one comparable constituencies in which the party stood aside having fought in 1922, turnout fell by 5 percentage points. However, this fall seems quite insufficient to sustain Cook's estimation that ‘as many as half the erstwhile Liberals abstained’ when we consider the party had averaged 24.4 per cent of the vote in these seats in 1922.Footnote 54 The other two elections which saw a significant volume of Liberal vacations were in 1922 (which saw no effect on turnout compared to the national average movement from 1918) and particularly in 1924. In this election, the 136 Liberal vacations in fact served to boost turnout by 0.9 percentage points relative to the national picture.
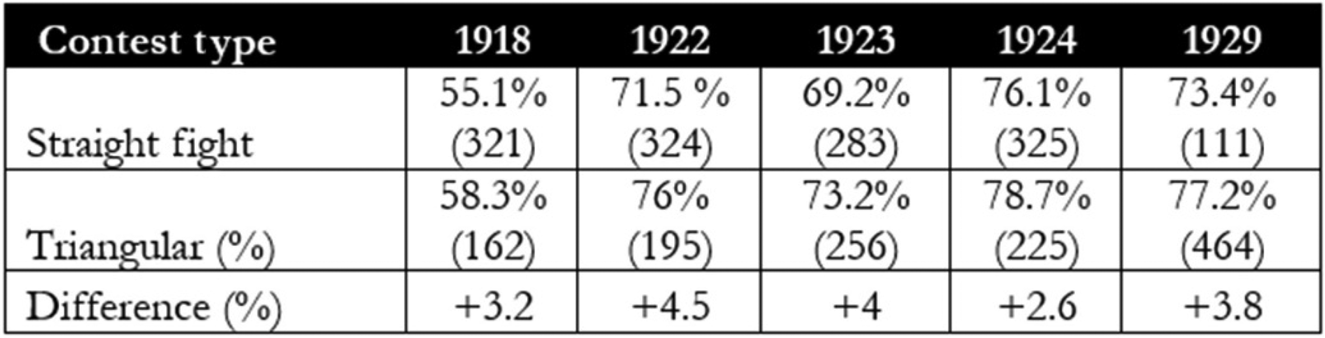
Studying re-entries as well as withdrawals is also interesting, albeit slightly less germane to the particular criticism of Lloyd George in 1924 (which naturally centres on his refusal to finance candidates to defend the existing frontier inherited from 1923 above his reluctance to fund candidates to carry the fight beyond it). However, analysing re-entries does produce slightly stronger evidence that a small portion of the electorate would vote Liberal but not for another party, with Figure 3 showing that in the 313 comparable seats the Liberals re-entered throughout the period, turnout increased by 1.9 percentage points more than might be expected given national changes. Much of this is due to the boost delivered by the 1929 election, when around half of the re-entries in the decade took place. Interestingly, throughout the 1920s, this data reveals that the average turnout boost associated with a Liberal re-entry was nearly five times as strong as the turnout drag associated with a Liberal withdrawal. This may – as the qualitative analysis below suggests for example with Bury St Edmunds in 1924 or Howdenshire in 1929 – have been a reflection of the novelty and excitement generated by a fresh Liberal challenge in an area previously written off. It is also likely to be a reflection of the fact that the vast majority of returning Liberal candidates in 1924 (and especially in 1929) found themselves locked in triangular contests, which produced average turnouts 3.6 percentage points higher than straight fights throughout the period.Footnote 55 In this context, the modest 1.9 percentage point re-entry effect may largely be accounted for by the switch from two- to three-cornered fights, thus somewhat undermining the argument that more candidates would have mobilized a significant number of Liberal stalwarts who would abstain without a candidate.
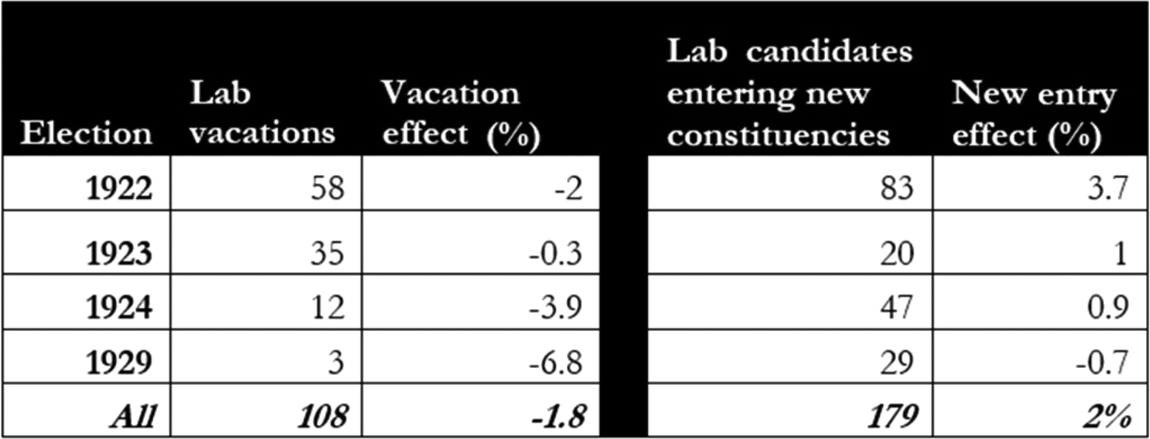
The absence of a significant section of the electorate that would either vote Liberal or not vote at all can also be contextualized by a comparison with Labour. Because this party vacated (and thus re-entered) far fewer seats throughout the period, it is necessary to configure analysis slightly differently. In Figure 4, we assess the effect of Labour vacations in the same way as for the Liberals, but instead of looking at re-entries, we analyse the effect on turnout that new Labour candidates had in constituencies where the party had not previously stood (at least since 1918). Once again, these readings are adjusted for national changes in turnout shown in Appendix 3.1. Turning first to Labour interventions in constituencies they had not previously fought, we find that the party putting candidates forwards boosted turnout by an average of 2 percentage points throughout the period, and by 3.7 percentage points in 1922 when Labour made their largest number of fresh interventions. These figures are roughly in line with Liberal re-entry effect observed in Figure 3. However, in the 108 constituencies vacated by Labour after having been fought in the previous election, turnout declined by an average of 1.8 percentage points. While by no means an overwhelming figure, this was still more than four times the equivalent decline associated with Liberal candidate withdrawals. It seems likely therefore that while this analysis clearly lends weight to the often-claimed thesis that voter loyalty to parties in this decade was very low, that there were nonetheless significantly more stalwart Labour voters who refused to back second-preference parties than there were Liberal voters.
The effect of Labour withdrawals and interventions in virgin territory on turnout, 1922–9

Overall, this section suggests that the much-maligned limpness of the Liberal electioneering effort had little effect on their performance in 1924, or their prospects of recovery in 1929. First, even a full slate of candidates in 1924 would have had very little capacity to win the Liberals – at best – any more than half a handful of extra seats. Secondly, this lack of candidates did negligible damage to the party's prospects when they re-entered constituencies in 1929. Finally, Liberal absence from the field led to very few Liberal voters abstaining. We can thus conclude that the penalty associated with what seemed to many contemporises and historians the cardinal electioneering error of leaving so many electors without the option of voting Liberal was not in fact – in psephological terms – such an error after all. In that regard, Lloyd George – whatever his true intentions actually were – can hardly be blamed for exacerbating his party's defeat through refusing to finance additional candidates when doing so would have had remarkably little effect on Liberal electoral fortunes.
IV
While psephology tells us a great deal about elections in this period, statistical analysis naturally represents only part of the story, and much can also be gleaned from studying contemporary interpretations of these political developments. While reading the writings and speeches of frontbench politicians and central organizers is a popular methodology – and widely employed in the historiography discussed above – there remains the question of how far historians of interwar elections should study campaigns at the constituency level. It is true that in the 1920s, elections were increasingly talked of as exercises in totting up so many millions of votes. For example, in the 1923 campaign, Lloyd George could sum up his party's bright prospects following its reunion by declaring that:
At the last election the Liberals polled more than 4,000,000 votes, while the Conservatives poll was only just over 5,000,000 votes. Nevertheless, the Conservatives had 330 members returned for their 5,000,000 odd votes, while the Liberals, with 4½ millions, had only 112 members returned…Now that the Liberals had come together, the old Party would again resume its position to fight the battle of the people.Footnote 56
This language is redolent of the familiar post-war world of uniform swings and centralized, national campaigns. However, elections in the 1920s were perhaps uniquely susceptible to transformation by local arrangements: where and when candidates stood, withdrew, formed pacts – and whether fights were straight or triangular – had enormous bearing on the outcome. Furthermore, we must also recognize the influence of the ‘linguistic turn’ on the electoral history of the period immediately prior to this, where historians have laid great stress on understanding the ‘politics of place’ and the importance of localized political discourses.Footnote 57 While the power of such local influences had clearly been weakened by the Great War and the ‘Fourth Reform Act’ in its wake, it is indisputable that constituency-level political actors in the 1920s were far from pawns being moved by party headquarters in London; local parties responded to national developments according to their own assessment of the situation. Considering the local dimension of elections seems particularly important in the case of the Liberals, who were arguably the most ideologically heterogeneous of the main parties, and also the most geographically fragmented in voting strength. Even Cook – whose book is a classic exercise in top-down aggregate methodology – describes the Liberal decline as ‘resembl[ing] the pictures of a kaleidoscope, changing from constituency to constituency, with all the complexity of a Seurat landscape’.Footnote 58 Given this, it seems surprising that the Liberal decline, especially in 1924, has seldom been analysed through the lens of a local or constituency study.Footnote 59
For the purposes of this article, an obvious group of constituency campaigns to investigate are those in the 136 seats where the Liberals withdrew candidates in 1924 having stood in 1923, particularly those where they had polled relatively well. Having conducted an extensive analysis of the local press in most of these seats, we find scant evidence that the lack of a candidate, or want of funding, may be behind many Liberal withdrawals.Footnote 60 The Kinross and West Perthshire constituency makes this point well. The seat had been Liberal up to 1923, when the Unionist candidate, the duchess of Atholl, gained it by a majority of just 150 votes over the Liberal in a straight fight. When parliament was dissolved in the first week of October 1924, the Liberals were widely expected to refight, notwithstanding a probable intervention by Labour. However, the Liberal candidate William Hope withdrew his candidature a few days before nominations closed, citing a speech given by Donald Maclean in Stirling which advised Liberals to avoid three-way contests that might benefit Labour. Hope explained that ‘since his adoption last March very little effort had been made by any of the prominent Liberals in the constituency to place the organization in such a condition as to enable a candidate to contest the seat with any reasonable prospect of success’.Footnote 61
The local (and uniformly anti-Labour) press undoubtedly interpreted these two themes – of the local Liberals’ desire to maintain an anti-socialist front, and of the party's organizational disarray – to be genuinely representative of the local political situation. One newspaper described the move as ‘sensible electioneering…members of the two older political parties in many places are awakening to the realities of the electoral position’; another reported that ‘the Liberals were caught napping’; while a third simply stated that ‘the Liberals were left in the lurch’ by their general unpreparedness.Footnote 62 There seems no reason to suspect that, amidst the copious reporting of rumours, speculation, unnamed sources, and party meetings of local Liberals, the local press here or anywhere else would hold fire in attributing local Liberal withdrawals to the action (or inaction) of central party leadership. There was no indication that headquarters issued an instruction to withdraw, or failed to provide money or electioneering resources. Even Maclean's advice did not compel anyone to do anything. Hope simply chose to withdraw, to the evident surprise of his constituency association.
This example highlights what seems to be an extremely pervasive phenomenon: the lack of Liberal self-confidence that they could manage respectable showings in three-cornered fights, or that they could galvanize the anti-socialist vote as effectively as the Conservatives. The Pontypridd division of Glamorganshire offers a good example of this. It was a constituency where the Conservatives had no history at all: it was won by Labour in 1923 in a straight fight against the Liberals by a slender majority of 2,998 votes. Given the popularity of anti-socialist pacts in 1924, the Liberals were seemingly far better placed than the Conservatives to challenge Labour again. But that was not what happened. As soon as the election was called, the Conservatives brought forward David Evans, a ‘Unionist working man’ with solid proletarian credentials. A Conservative local paper hoped ‘that a three-cornered fight will be avoided and that the Liberal support will be secured for the Unionist candidate…a number of prominent local Liberals favour support for the Unionist candidate on this occasion, the Conservatives having upon three occasions voted for the Liberal candidate’.Footnote 63 As at Kinross, blame was heaped on the shoddy local organization, with the Pontypridd Observer remarking that ‘propaganda work by the Liberal party in the Pontypridd division has not been as active as desired in the area since the last election…in the meantime the Conservatives, since the appointment of…the new agent, have maintained an aggressive policy of a long series of meetings’.Footnote 64
The noteworthy point here is the contrast between the two anti-socialist parties’ readiness to fight, and the Liberals’ willingness to take the blatant double standard at work here lying down. The Liberals’ decision to withdraw was applauded as ‘one that is highly creditable to them, and the local Unionist leaders fully appreciate the patriotic attitude which they have adopted’.Footnote 65 Yet simultaneously, Evans insisted that ‘he saw no reason why a Unionist working man should be sacrificed to suit the convenience of any other party. The Conservatives were determined to fight against all opposition, no matter from where it came.’Footnote 66 Again, it was the supposed Unionist organizational vigour, rather than lack of money, that was given by both sides to explain the surprising choice of a Conservative rather than a Liberal candidate. Ironically, when Labour went on to hold the seat comfortably, a Liberal newspaper lamented that
the Conservative organization was necessarily weak, in that it was built up at the eleventh hour, and the Liberals were no better prepared for the rush election. Mr David Evans was not a strong candidate…a view generally held amongst Liberals and Conservatives is that Mr. David Rees [the Liberal candidate in 1923] would have won.Footnote 67
Liberal timidity, even against the background of a strong performance in the 1923 election eleven months previously, was a widespread phenomenon. Particularly notable was the pervasiveness of the language of death and decline used to describe the state of Liberalism in 1924: not after, but before, the result of the election was known. The Scotsman described the Liberal decision to stand in Roxburgh and Selkirk (where they came second in 1923) as ‘dominated by ghosts, the wraiths of Liberal tradition, the shades of old-time shibboleths…it was the ghosts that cast the decision’.Footnote 68 ‘Moribund’ was also a popular adjective to describe the state of Liberalism. In Cheltenham, the local Liberal club was dismissed as ‘the high altar of moribund Liberalism’ in the locality by a Unionist newspaper.Footnote 69 A Sheffield newspaper, meanwhile, stated that ‘in a few areas, such as Devon and Cornwall, the hereditary attachment to Liberal traditions remains, but in others, Yorkshire for example, it is moribund’.Footnote 70 On similar lines was the Labour candidate in Shipley, who proudly quoted Stanley Baldwin's comment that ‘our great enemies in the future are not going to be Liberals who are moribund, but the Labour Party, which is very much alive’.Footnote 71 Even a sympathetic write-up in a West Country newspaper conceded that ‘the Liberal party enshrines a great tradition which has been of incalculable value in the development of English political life…at the present it appears to be politically moribund and intellectually barren’.Footnote 72 In Middlesbrough, once a Liberal fortress, it was also recognized that ‘Liberalism is a waning star.’Footnote 73 Indeed, even the Liberals themselves felt compelled to enter this rhetorical coroner's court: in a speech at Walsall, Lloyd George acknowledged that ‘Liberalism is attacked as an effete party. If not already dead, Liberalism is at least supposed to be moribund. Well, I can see no indication of it either in Walsall or in any other part of the country I have visited (cheers).’Footnote 74 Similarly, the candidate at Horncastle declared that ‘they have been saying that the Liberal party is dead…if that is so I should like to know when it died, the date of the inquest, and when the funeral takes place’.Footnote 75
The melancholy tone was, curiously, also evident in the handful of seats which ran against the national tide in 1924, and saw courageous (albeit unexpected) fresh Liberal interventions. In the Ashford division of Kent, a Liberal stood for the first time since 1910, but the candidate's talk was not of victory – simply that ‘Liberalism could never die. It permeated the policies of both the other political parties and it permeated the world.’Footnote 76 The same was true at Bury St Edmunds, where the chairman declared that ‘what I have always been confident of is that if the Liberal Party by any chance dies, Liberalism in Bury will never die’.Footnote 77 Indeed, the youth of their twenty-three-year-old candidate John Day was on several occasions cited as evidence of the long-term vitality of Liberalism, so much so that his Conservative opponent Walter Guinness sarcastically complimented the ‘young and energetic candidate with a great deal of youth [laughter]’.Footnote 78 The enthusiasm generated simply by proving Liberalism could still fill the town's meeting rooms and wage spirited campaigns was presented as sufficient reason to fight in itself.Footnote 79 At a third constituency where the Liberals were intervening afresh, East Grinstead, the local party chairman struck a more sombre note, commenting that ‘he believed the Liberal Party would always remain in existence and would never be absorbed into either of the other two parties…it would be a disastrous day if they became extinct or too weak’.Footnote 80 He went on to to declare that ‘it did not matter a jot what happened at the poll on Wednesday, for Liberalism in that Division was saved’ by presenting a candidate.Footnote 81 This introspection – whether couched in trenchant or melancholy terms – was perhaps symptomatic of what Michael Bentley has described as ‘the Liberal mind’: the growing feeling after 1914 that Liberalism was at odds with the modern world that the war brought to Britain.Footnote 82 While Bentley's diagnosis applied to the top of the party, a similar fatalistic worry over Liberalism's mortality was clearly also in evidence at the grassroots.
A final notable observation is that, most of the time, constituency Liberals did not seem to believe that withdrawing in 1924 (or in other interwar elections) would damage their future prospects of winning the seat. There were occasional expressions of anxiety: for example, in Moray and Nairn, the prospect of withdrawing from a traditional bastion of radicalism led party figures to fear ‘that it would be fatal to the further chances of Liberalism in the counties, if a candidate was not brought on the field at the present election’.Footnote 83 Similarly, Derby Liberals were reported as fearing that ‘they may live to regret’ an attempt to ‘place the Tories in office for a long time’.Footnote 84 However, such concerns of a ‘withdrawal penalty’ were in fact more atypical than typical. In Penrith and Cockermouth – a constituency where the Liberals had thrice come within 400 votes of victory – the candidate R. D. Denman withdrew, citing his opposition to his party leadership's decision to bring down MacDonald's government. A leading local Liberal reflected that ‘they saw all around in the local political world people who were very lightly tied to party politics…he believed that Liberalism would not suffer very seriously if they discarded their official Liberal position and got Mr. Denman to stand as an independent candidate’.Footnote 85 When Denman declined, the chairman remained content that while ‘they had not time now to enter into the present contest, but…he believed it would not be long before they would have a Liberal Member again’.Footnote 86 In 1929, in the numerous seats which the Liberals re-entered, there was similarly no sign of local parties downplaying expectations on account of their failure to stand five years previously. In the Howdenshire division of the East Riding of Yorkshire, for example, where the Liberals had not stood at a general election since 1918, they exuded confidence, with the candidate Edward Baker remarking that ‘for the first time in the history of Howdenshire the Liberals were, he thought, on the right road to victory’.Footnote 87 At Pontypridd, where the Liberals beat an ignominious retreat in 1924, their new candidate John Victor Evans told his supporters that ‘if they wanted to find evidence of robust, rising Liberalism they had only to look around…Liberalism was a positive gospel and a positive faith…let us by all means aim for victory, as we have evidence to believe in its possibility. Never has there been a time more promising.’Footnote 88 Finally at Penrith and Cockermouth, the head of the local Divisional Association told a meeting that they were on course ‘to bring back once more the grand, old principles of that party (applause). There was the same story everywhere – a wave of enthusiasm for these Liberal principles, which could not be withheld (applause). It would culminate, he believed, in the return of their party.’Footnote 89
Overall, there seems very little evidence from the constituencies that money or availability of candidates lay behind any of the eyebrow-raising withdrawals. Given the widespread local diagnosis of Liberal prospects even before polling day in 1924, it is thus perhaps unsurprising that so many Liberal constituency associations opted to withdraw from superficially promising positions. That these decisions were arrived at locally is significant because it suggests that the much-criticized 1924 campaign was a reflection of the constituency associations at the grassroots just as much as it was the central leadership. Many of them were also in despair, and many were also prepared to form up behind the Conservatives. Indeed, it is worth noting that the majority of the decisions on whether or not to stand – and the associated melancholic language of death and decay which they were often couched in – were made not only before the result of the election was known, but also before it was clear just how few candidates the Liberals were advancing nationwide. It is often overlooked that only ten days actually separated the dissolution on 9 October from the deadline for nominations on the 18th, allowing an unusually narrow window of opportunity to find additional candidates. Individual constituencies simply lacked the time to step back and evaluate the running tally of Liberal interventions across the country: they had to decide whether to fight based on their immediate reading of the political situation. In such circumstances, the capacity of central leadership to parachute last-minute candidates into constituencies without them is extremely easy to exaggerate. Indeed, of the seventy-five candidates who entered nominations at the last minute, the Liberals by no means lagged behind their rivals: they managed twenty-five, compared to Labour's thirty-three and the Conservatives’ seventeen.Footnote 90 The lack of Liberal candidates was a reflection of local associations not having them in place in advance of the unexpected dissolution (a vulnerability for which it is far harder to attach particular blame to Lloyd George) rather than a failure to finance last-minute interventions. The claim that many local associations wanted to fight, but were prevented from doing by lack of funds or unavailability of candidates, simply does not tally with the evidence. Even Cook – who while taking the general view that the party was crippled by its lack of candidates in 1924 – acknowledges ‘there was simply no will to fight even in some seats where ample funds existed’ and also cites (in a footnote) a statistic that perhaps should have received rather more attention: that the average Liberal in 1924 was not in fact impoverished relative to their opponents: the party's average expenditure per candidate was £764, compared to £841 for the Conservatives and just £442 for Labour.Footnote 91
V
Evidence from an extensive statistical analysis, and a study of the grassroots campaign, does not support the almost universal interpretation of historians and contemporaries that Lloyd George's reluctance to open his chequebook in 1924 exacerbated the decline of the Liberal party. Simply put, there is very little evidence that the Liberals could have achieved even a marginally better result in 1924 with even a full slate of candidates, very little evidence that these withdrawals harmed the party's prospects of recovery five years later in 1929, and very little evidence that the loyalty of stalwart Liberal voters was weakened by so often having no Liberal candidate to vote for. Indeed, far from representing (along perhaps with 1895) the prize exhibit in the party's electioneering chamber of horrors, 1924 emerges as an election where Liberal resources were targeted relatively effectively, thus fully justifying Lloyd George's much-derided attitude that more candidates would have delivered negligible benefit.
Electoral politics in the 1920s was extremely unstable: the Liberals were split in 1918 and 1922, the electorate was rapidly expanding, pacts were commonplace, and tactical withdrawals and re-entries customary. Lloyd George judged, probably correctly, that such circumstances afforded parties a historically unique liberty to withdraw candidates from seats they did not think they could win without paying any particular electoral price for doing so. In this regard, the Asquithian interpretation – accepted almost at face value by the majority of historians of the Liberal party and by biographers of Lloyd George – that the Welshman knowingly and deliberately led the party to ruin in 1924 is rendered highly questionable. If more candidates would have delivered negligible benefit, then the decision to conserve resources to spend on revitalizing Liberal organization after the election hardly deserves to be judged so harshly. Indeed, it might be further argued that the obsession of contemporaries (and historians) with the perpetual intrigue and smoke and mirrors of the Lloyd George Fund almost certainly overstates its actual electoral importance, and probably the power of money to influence elections more generally in this turbulent period. If a valid criticism is to be made of the Liberal electioneering effort in 1924, it arguably concerns ideology more than psephology: namely that the party's decision (made both nationally and locally) to concentrate resources almost exclusively on the anti-socialist rather than the anti-Conservative front effectively abandoned voters in the centre, alienated those on the left, and failed to compete meaningfully for those on the right.Footnote 92 Clearly, a decision on how to meet the long-term Labour challenge had to be made by the reunited Liberal party and 1924 brought this to a head: but the fateful judgement to jump to the right was one made by the Asquithians just as much as by the Lloyd Georgeites.
A second important conclusion of this article is that while the sheer national scale of the rout of 1924 was certainly not forecast by contemporaries, there was a widespread premonition in constituencies across the country that the life of the Liberal party was quite fundamentally in danger, and that a fuller electioneering effort was of peripheral importance in comparison. William Wedgwood Benn vividly recalled the scene of the central hall of the Commons on the evening of the fall of MacDonald's government – ‘packed till nearly midnight with people singing The Red Flag and God Save the King in competition’. As ‘the story of the suicide of the Liberal Party’, this did not seem so very far removed from the feeling in many constituencies across the country.Footnote 93 The 1923 election was waged on the quintessentially twentieth-century battlefield of Conservatism versus Socialism, while the 1924 election was pitched on the quintessentially nineteenth-century battlefield of Protection versus Free Trade. This is the more convincing explanation for the sudden Liberal collapse from 1923. While the split of 1916 and the coupon election of 1918 may have pushed the Liberals behind Labour as the principal opposition to the Conservatives, it was the result of the election of 1924, not 1923, which revealed their future: as a distant, not close, third party. The party's inability to stage a decisive recovery in the election of 1929 even in seemingly auspicious circumstances simply served to reiterate the dawn of a new political world that had been revealed five years previously.
STATISTICAL APPENDIX
This appendix contains aggregate statistics which are referred to throughout the article. The figures presented in the second columns under each party (‘national average’) are simply aggregate totals for the UK as recorded in F. W. S. Craig.Footnote 94 The figures presented in the first columns (‘per candidate’) are the average percentage poll per candidate, in constituencies contested by these parties, excluding Northern Ireland and universities, with uncontested seats counted as 100 per cent for the party returned. For simplicity, the eleven double-member boroughs are counted as one constituency rather than two. Because these statistics may also be of general interest for historians of interwar Britain, data in some tables is provided up to 1935.
Average party percentage vote share per candidate at general elections, 1918–35 (the number of constituencies contested appears in brackets after the percentage)

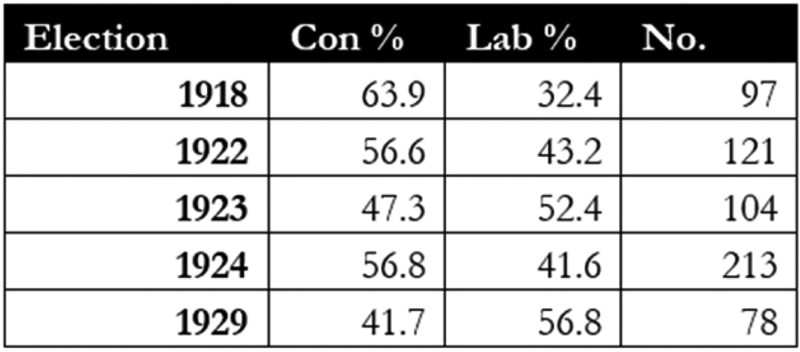
Average vote share per candidate in straight fights between Conservatives and Labour, 1918–29
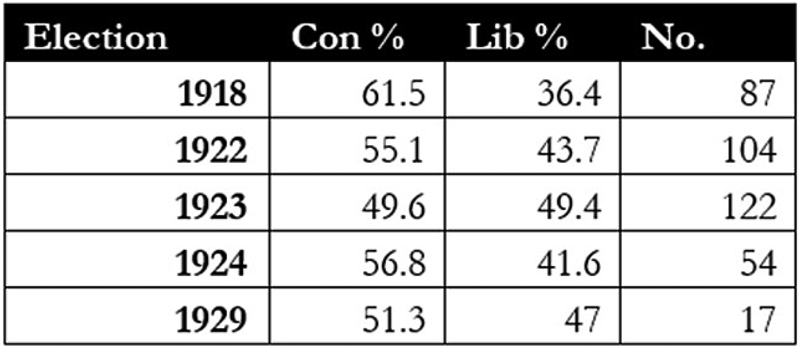
Note: Appendices 2.1, 2.2, and 2.3 include the comparatively rare occasions where an independent party intervened and scored less than 20 per cent. If they scored more than 20 per cent, the contest was excluded. This is why the sum of the percentage shares is not 100 per cent.

Average vote share per candidate in straight fights between Conservatives and Liberals, 1918–29

Average vote share per candidate in straight fights between Liberals and Labour, 1918–29

Average vote share per candidate in triangular contests featuring Conservatives, Liberals, and Labour, 1918–29

National turnout, 1918–29
Source: Figures taken from Craig, British electoral facts, pp. 81–2.

Average turnout in straight fights and triangular contests, 1918–29
Note: Straight fights are only included if they were between two of the three main parties (including Lloyd George and National Liberals). Triangular fights likewise are included only if they featured all three main parties. In a small number of instances, independent Conservatives, Liberal, and Labour were counted as constituting their respective parties.