


INTRODUCTION
Melted water infiltrating into deposited snow may be stopped by a special layer of snow, causing the snow immediately above it to be saturated with water. It is well known that larger and more rounded granular snow is formed in such a saturated layer. This snow has a characteristic of weak bonds and low strength, and frequently causes wet avalanches. Snow fallen on pond or lake may be immersed in water for several months or more. In this case, very large ice spheres up to several mm in diameter can develop (Fuzioka and others 1963).
Wakahama (1965, 1968, 1974) studied the metamorphism of snow saturated with water by the analysis of many thin sections. Colbeck (1974, 1976, 1980) considered grain growth of wet snow theoretically. Tusima (1978) studied the grain coarsening of snow particles saturated experimentally with pure water. Tusima and Raymond (1979) extended the study to impure water. Raymond and Tusima (1979) analyzed the grain coarsening as the process of growth and disappearance of grains caused by heat flow from relatively large grains to relatively small grains.
An immersed ice sphere of 1 mm diameter has a depression of the equilibrium temperature near 10-4°C because of surface curvature. We deal with growth under the ultra small supercooling.
METHODS OF EXPERIMENT
Figure 1 shows the apparatus schematically. The outer and inner stainless containers contain crushed ice and wet snow, respectively. The outer (0.8 m in diameter, 0.8 m long) has a drain pipe in the bottom. Polymethytmetacrylate containers are filled with 350 ml of deionized water or solutions of d-glucose, NaCl, HCl and dextran ((C6H1005)n, molecular weight 5 x 10⁵) were held one day at 0 C. Next, fresh or compact snow was mixed in with a glass rod. For some solutions greater than 0.1 mol/1, large vacuum flasks ( 4 1 and 6 1) were used. From these containers, a small amount of snow (0.5 ml) was scooped out at various times and spread in a single layer in shallow dishes and pressed down with a glass plate. This snow was photographed under a microscope. The sizes of particles were measured with a KG-2 analyzer. Usually, 500 particles were analyzed. Experiments were carried out in a cold room precisely controlled to 0.6°C.

RESULTS
Size distribution
Figure 2 shows photographs of snow at times of 1, 5, 10, 50 and 130 hrs after saturation with pure water. As time passed, the distribution range became wider and the average diameter shifted to larger size. Similar curves were obtained for solutions except for the position were located to smaller side depending on concentration.
Mean grain size
When the average diameter, ? (mm), was plotted against the cube root of time, a linear relation was obtained as shown in Figure 4:

where t is the time (hr), and α and ß are constants. For pure water, the values of α and ß are 0.16 and 0.08, and for glucose (0.1 mol/1) are 0.15 and 0.07, respectively. The relation of ? to time is also shown in Figure 5.
Average volume
The plot of average volume, v (mm5), to time, t (hr), gave a linear relation as shown in Figure 6:

Coefficient ρ is equal to the volume growth rate and the value is listed in Table 1. The average volume is given by the ratio of number of particles, N, to total ice volume, VQ, Suppose the total ice mass was conserved, the growth rate of volume is given by:


The increase of v means the decrease of ice particles, N. It is seen N decreased in proportion to time, except for smaller range than 10 hrs (Figure 7). 56 particles at 1 hr decreased to 19 after 5 hr, 12 after 10 hr and 1.6 after 100 hr per unit ice mass, 1 mg.
Grain coarsening in kerosene
In order to prohibit mass transfer through liquid, and estimate the role of mass transfer through the ice bonds, snow was immersed in kerosene at 0°C. In this case, snow was not disaggregated. No grain coarsening was visible and the irregularities of snow particles were kept after 100 hrs (Figure 8) and 200 hrs.
Master curve of grain coarsening
Each curve in Figure 5 could be made to coincide with a  -t curve of pure water by shifting in size and time (Figure 9). This suggests that the same mechanism controls the grain growth in the solutions and pure water.
DISCUSSION
Any snow particles have to be their equilibrium temperature at interface between particles and water or solution. In general, snow is an aggregation of ice particles and includes small particles as well as large ones. Therefore, it is considered that each particle is located in any temperature field. Equilibrium temperature for some particles will be higher than circumstance one and for others will be inverse. Former particles grow and later ones melt and disappear. The temperature field will change at every moment in the process of grain coarsening, which involves growth, disappearance, and decreasing numbers of grains.


Consider the growth (or melting) of snow particle placed in the solution of concentration S. We suppose the solution is surrounded by an isothermal wall, at the molar depression temperature - ρS, Heat flow through any spherical surface, q, is given by:

where r is the radius of spherical surface, κ the thermal conductivity of the solution. The temperature T is:

where T° - 273 K, ρ l the density of ice, r the particle radius, L the latent heat of fusion, and σLS the interfacial tension. Because the growth rate of ice particles depends on inflow heat, Equation 4 becomes:
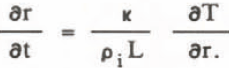


Equation to diffusion of solute is written:
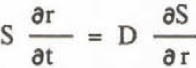
where D is the diffusion coefficient. From Equations 5, 6, and 7,

where B is the coefficient of r-2. The growth rate of volume is given by
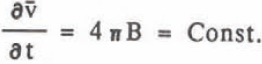
This agrees with the experimental result that the average volume growth rate was constant. The value B is equal to p in Equation 2 and the comparison of these values agree very well as seen in Table II. Integration of Equation 8 gives the relation diameter 0 and time t, which corresponds to Equation 1,

From Equations 5 and 6, we can get the following relation to growth rate and temperature,

From Equations I and 5, we get an experimental relation,

These agreements are very good. Figure 10 shows Equation 12 in comparison with the growth rates of James (l967), Hilling and Turnbull (1956), and Turnbull (1958) (or see Fletcher: 114-115). The tendency of curve is reasonable. It is necessary to notice some particles grow and others melt or disappear in the process of coarsening. Therefore, Equation 12 is not a strict relationship, but may give some information on the growth rate with slight supercooling.

CONCLUSIONS
Grain coarsening of snow particles immersed in pure and impure water are measured. Remarkable grain coarsening was observed. The average diameter increased with cube root of time and average volume increased with time. The higher concentration and the lower diffusion of solute controlled the growth rate. No grain coarsening observed in kerosene. Grain coarsening is considered as the process of the growth of relatively large particles and disappear relatively small particles which caused by temperature difference between each particles.



