INTRODUCTION
The last glacial maximum in Australasia has been recognised as being distinct from the global last glacial maximum (LGM; Clark et al., Reference Clark, Dyke, Shakun, Carlson, Clark, Wohlfarth, Mitrovica, Hostetler and McCabe2009) in its duration and structure. It occurred over a period of ca. 29–18 ka, which has been referred to for the Aotearoa/New Zealand (NZ) region as the extended LGM (eLGM; Newnham et al., Reference Newnham, Lowe, Giles and Alloway2007) or the last glacial coldest period (LGCP; Alloway et al., Reference Alloway, Lowe, Barrell, Newnham, Almond, Augustinus and Bertler2007). This interval encompassed considerable millennial-scale variability unaligned with that of the Northern Hemisphere (Rasmussen et al., Reference Rasmussen, Bigler, Blockley, Blunier, Buchardt, Clausen and Cvijanovic2014). The origin of climate events within the LGCP and the last glacial–interglacial transition have been the focus of considerable attention (Alloway et al., Reference Alloway, Lowe, Barrell, Newnham, Almond, Augustinus and Bertler2007), and more recently Barrell et al. (Reference Barrell, Almond, Vandergoes, Lowe and Newnham2013) codified and defined climate events within a New Zealand Climate Event Stratigraphy (NZ-CES). The NZ-CES, constructed as a composite stratotype, was not intended to be a universal characterisation of climatic variability within the wider NZ sector of the Southern Hemisphere (SH); instead, its purpose was to use the highest-resolution records with the clearest climatic interpretation and the best dating precision to establish a benchmark against which other records could be compared. Interregional or broader-scale contrasts in the expression and timing of climatic perturbations (events) can then illuminate drivers at synoptic and hemispheric scales (Lorrey et al., Reference Lorrey, Fowler and Salinger2007, Reference Lorrey, Fauchereau, Stanton, Chappell, Phipps, Mackintosh, Renwick, Goodwin and Fowler2014). Thus, proxy climate records at similar (millennial-scale) resolution in regions with distinct climatic responses to prevailing synoptic conditions are important complements to the NZ-CES.
The NZ-CES was constructed from three pollen records, the record defining eLGM events coming from Galway Tarn in South Westland on the west coast of South Island (Vandergoes et al., Reference Vandergoes, Newnham, Denton, Blaauw and Barrell2013b; Fig. 1A). The records were interpreted essentially in terms of temperature; however, in the maritime, midlatitude setting of NZ, land temperatures are closely related to dominant atmospheric circulation (Basher and Thompson, Reference Basher and Thompson1996; Mullan, Reference Mullan1998), particularly the dominance of zonal versus meridional circulation. For example, when the latter is dominated by southerly to southwesterly flows, cold air advected from higher latitudes cools NZ. Analysis of instrumental and palaeoclimatic records also suggests wind-motivated advection of ocean heat as a first- or second-order control on NZ land temperature (Barrows et al., Reference Barrows, Juggins, De Deckker, Calvo and Pelejero2007a; Doughty et al., Reference Doughty, Schaefer, Putnam, Denton, Kaplan, Barrell, Andersen, Kelley, Finkel and Schwartz2015; Mackintosh et al., Reference Mackintosh, Anderson, Lorrey, Renwick, Frei and Dean2017). The importance of zonal circulation over NZ, essentially the SH westerly winds, in regard to NZ climate and behaviour of NZ and other SH glaciers has also been stressed (Shulmeister et al., Reference Shulmeister, Goodwin, Renwick, Harle, Armand, McGlone and Cook2004; Fitzharris et al., Reference Fitzharris, Clare and Renwick2007). Despite the importance of wind in NZ's palaeoclimate, we have few relatively direct proxies at a resolution that might allow interregional comparison. Furthermore, what records we have assume a stationary relationship between wind direction and strength and rainfall (e.g., Whittaker et al., Reference Whittaker, Hendy and Hellstrom2011).
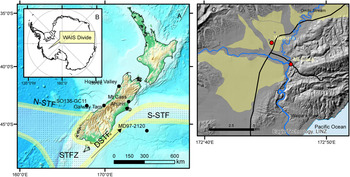
(color online) Location diagram showing: (A) Aotearoa/New Zealand landmass and oceanographic setting (bathymetric data from ESRI [Esri, GEBCO, DeLorme, NaturalVue], https://elevation.arcgis.com/arcgis/rest/services/WorldElevation/TopoBathy/ImageServer); S-STF, Southern subtropical front; N-STF, Northern subtropical front; STFZ, subtropical frontal zone; DSTF, dynamic subtropical front (positions from Bostock et al., Reference Bostock, Hayward, Neil, Sabaa and Scott2015) and sites mentioned in the text; (B) location of ice core WDC06 at West Antarctic Ice Sheet (WAIS) Divide; and (C) Waipara township and the Mt. Cass site with Waipara River and Omihi Stream shown within their MIS 2 aggradation plains (Forsyth et al., Reference Forsyth, Barrell and Jongens2008).

Aeolian deposits such as loess offer potential for inferences of the dynamics of the wind regime and other aspects of palaeoclimate and environment at a range of time scales (e.g., An and Porter, Reference An and Porter1997; Vandenberghe et al., Reference Vandenberghe, Zhisheng, Nugteren, Huayu and Van Huissteden1997; Lu and An, Reference Lu and An1998; Ding et al., Reference Ding, Yu, Yang, Sun, Xiong and Liu2001; Nugteren and Vandenberghe, Reference Nugteren and Vandenberghe2004). The South Island of NZ has widespread loess deposits (Schmidt et al., Reference Schmidt, Almond, Basher, Carrick, Hewitt, Lynn and Webb2005) found in close association with Pleistocene glacial landforms; however, loess-derived climate proxies have been limited by poor chronology. Unlike the North Island of NZ, the South Island has few tephra isochrons in the loess (Eden et al., Reference Eden, Froggatt and McIntosh1992); radiocarbon datable material is scarce and prone to contamination with modern carbon (Goh et al., Reference Goh, Molloy and Rafter1977, Reference Goh, Tonkin and Rafter1978; Hammond et al., Reference Hammond, Goh, Tonkin and Manning1991); and luminescence dating has produced ages of low accuracy and precision (Berger et al., Reference Berger, Almond and Pillans2001a, Reference Berger, Pillans and Tonkin2001b, Reference Berger, Pillans, Bruce and McIntosh2002; Almond et al., Reference Almond, Shanhun, Rieser and Shulmeister2007).
In this contribution we present a loess-derived palaeoclimatic and palaeoenvironmental record from the east coast of South Island for the eLGM. The loess at our study site is unusual in a NZ context, in that the local geology affords the dominantly quartzofeldspathic mineralogy a calcareous component and high pH. By contrast, the bulk of NZ loess outside the volcanic regions of North Island is dominantly quartzofeldspathic but lacks CaCO3 and is acidic. The alkalinity (high pH) of the loess at our site has preserved terrestrial gastropod shells and eggshell. These subfossil materials are reliable targets for radiocarbon dating, from which we have developed a high-precision chronology of loess deposition for the eLGM, and they have allowed us to infer aspects of paleoenvironment. Moreover, we adopt the rare practice in loess stratigraphic studies of considering a catenary sequence of loess in order to understand the effects of erosion and deposition on the proxy record. We compare our record against the NZ-CES to consider contrasts in climatic signals east and west of the main divide of South Island and draw conclusions about potential hemispheric and interhemispheric controls on eLGM climate.
STUDY SITE AND METHODS
The loess section we studied (43.077°S, 172.784°E) is near Mt. Cass to the east of the township of Waipara in North Canterbury, South Island (Fig. 1A and C). Mean annual rainfall and temperature at Waipara are 627 mm and 12°C, respectively (National Institute of Water and Atmospheric Sciences, n.d.). The loess sits atop a dissected fluvial valley fill uplifted along the axis of the active Black Anticline. The Black Anticline is one of a series of folds in a NE-SW trending range generated by oblique tectonic convergence in the southern part of the Marlborough Fault Zone associated with the Pacific and Australian plate boundary (Barnes, Reference Barnes1994). The range is cored with a Mesozoic greywacke sandstone but overlain by a Cenozoic marine sequence including sandstones, mudstones, conglomerates, marls, and limestone (Forsyth et al., Reference Forsyth, Barrell and Jongens2008). The loess is most likely derived from valley fills in the Waipara syncline to the west deposited by the Waipara River and its tributary Omihi Stream (Fig. 1C). The Omihi Stream valley fill is dominantly fine sediment (sand or finer) derived from erosion of the Cenozoic cover rock sequence and includes detrital carbonate, which is dissolved and reprecipitated to form secondary carbonate in surface soils (Tonkin et al., Reference Tonkin, Webb, Almond, Creasy, Harrison, Hassall and Smith2015). By contrast the Waipara River fill is dominated by quartzofeldspathic Mesozoic greywacke gravels and sands derived from the eastern front range of the Southern Alps.
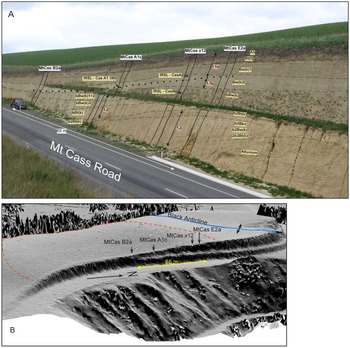
The section we examined is exposed along 65 m of the western side of Mt. Cass Road where it cuts across a small hillslope hollow formed in the loess (Fig. 2). To the east of the road, there is a steep hillslope into an unnamed stream. We described the soil stratigraphy of four vertical profiles along the section using the methodology of Schoeneberger et al. (Reference Schoeneberger, Wysocki, Benham and Broderson2002) and Milne et al. (Reference Milne, Clayden, Singleton and Wilson1995), and then logged the stratigraphy along the whole section by interpolation. We carried out detailed descriptions and sampling down two vertical sections: one aligned with the shoulder of the broad spur forming the northern margin of the hollow (MtCas E2a), and the second on the hillslope descending from the northern spur into the hollow floor (MtCas A1c).
Mount Cass loess exposure. (A) Soil stratigraphy, infrared-stimulated luminescence (IRSL) sampling locations, and section locations; (B) 1 m LiDAR-derived hillshade model showing section locations, the Black Anticline, and hillslope hollow catchment boundary (dashed red line). See Table 1 for sample identifiers. (For interpretation of the reference to color in this figure legend, the reader is referred to the web version of this article.)

To complement the soil stratigraphy, we logged the position of a tephra isochron revealed by cryptotephra analysis. To locate cryptotephra occurrences, we sampled four profiles in 2 to 10 cm increments and then carried out microscopic counting of volcanic glass grains in small subsamples using an exotic-grain spiking procedure to normalise sample mass counted. The method is explained in detail in Walther et al. (Reference Walther, Roering, Almond and Hughes2009). Briefly, a subsample of a depth increment of loess was cleaned of organic carbon, iron oxides, and carbonate by treatment with H2O2, citrate-dithionite, and HCl, respectively. It was then wet sieved to yield a 63–250 μm fraction, and then the dry mass was spiked at 5% with no. 10 or no. 8 Ballotini impact beads, which have a manufacturer-specified number of beads per mass. By counting the number of beads and glass grains in an aliquot immersed in clove oil in a well on a microscope slide, we calculated glass grains per mass of loess. We then converted gravimetric concentrations to volumetric using bulk density data. Uncertainty in manufacturer specification of beads per mass was not considered important, because the spike grains were used largely to quantify relative not absolute differences in glass grain concentrations.
To confirm the identity of the cryptotephra, we conducted electron microprobe analyses on glass grains from just below and just above the glass grain concentration peak at profile MtCas A1c with the use of a Cameca SX 100 device at the University of Manchester. Multiple glass grain analyses were carried out until we had a total of >15 individual analyses for which element totals summed to >93%. Analyses of the Aokautere Ash member of Kawakawa-Oruauni tephra formation at its type section at Aokautere in North Island (Cowie, Reference Cowie1964) were performed under the same operating conditions as a basis for comparison.
We sampled the whole of the northernmost profile (MtCas E2a) at 2–2.5 cm increments via continuous block sampling for particle size analyses. Grain-size composition was determined using the Mie method. Samples were pretreated with 1 M HCl and H2O2 to remove CaCO3 and organic matter, respectively. For a more detailed description of the pretreatment process see Konert and Vandenberghe (Reference Konert and Vandenberghe1997). All samples were measured for 42 size intervals between 0.0001 and 0.5 mm using a Laser Particle Size Analyzer type Easy Sizer 2.0 and Fritsch sieves at the Geoarchaeological and Paleoecological Lab of the Department of Geology and Paleontology, University of Szeged, Hungary. Grain-size classes and mean grain size were determined in accordance with the Wentworth scale of grain-size distribution. However, for the clay fraction, the upper boundary of 4.6 μm was considered in accordance with the general practice used in laser particle size analysis (Vandenberghe et al., Reference Vandenberghe, Huijzer, Mücher and Laan1998). A Malvern Mastersizer2000 at the University of Manchester was used for grain size analysis for part of the profile MtCas A1c to the south near the axis of the hollow used. Samples were disaggregated in a Stuart Mini Orbital shaker at 300 rpm for 3 hours. Each increment was subsampled into three replicates analyzed three times each. Grain-size statistics (mean grain size) were calculated in GRADISTAT v. 8 software (Blott and Pye, Reference Blott and Pye2001).
Subfossil gastropods, eggshell, and bones were distributed along the section in concentrated zones. We logged the position of the subfossil material and submitted samples of eggshell and gastropods for radiocarbon dating. In situ samples were collected at 4 cm intervals parallel with those for grain size in the northernmost spur profile (MtCas E2a) from equal volumes of 5 L. These were dispersed in water and wet sieved through a 0.5 mm mesh. After sieving, mollusc shells and moa eggshells were dried, sorted, and identified under a stereo dissecting microscope at magnifications of 6×–50×. The malacological collection of the Te Papa Tongarewa National Museum of New Zealand, Wellington, was consulted for accurate taxonomic identification and environmental affinities of gastropods.
Fifteen individual subfossils from the two logged profiles were used to construct age–depth models. Eight other gastropods were collected and submitted from elsewhere to appraise the spread of ages of the fauna. Samples from MtCas A1c were submitted to the Natural Environment Research Council radiocarbon laboratory at Kilbride in Scotland, while samples from MtCas E2a were processed at the Direct-AMS laboratory in Seattle, Washington, USA. Details of sample preparation are provided in the Supplementary Material.
Age–depth models were constructed in Bacon (Blaauw and Christen, Reference Blaauw and Christen2011), which implements a Bayesian statistical approach using gamma distributions as prior information on accumulation rates. All calibration of ages to calendar years used the SHCal 13 calibration curve (Hogg et al., Reference Hogg, Hua, Blackwell, Niu, Buck, Guilderson, Heaton, Palmer, Reimer and Reimer2013). Details of model setup are provided in the Supplementary Material.
As a supplement to the radiocarbon ages we collected three samples for luminescence dating. One sample was taken from a profile MtCas A1c and two from MtCas x12 on the shoulder of the spur (Fig. 2). All samples were in unequivocal stratigraphic position relative to the Kawakawa tephra emplacement horizon. Luminescence dating was carried out at the Victoria University of Wellington (NZ) Luminescence Dating Facility and employed the multiple aliquot additive dose protocol. For a full description of methods see the supplementary materials.
RESULTS
Stratigraphy
The ground surface of the 65-m-long section descended from the spur on the northern margin of the hillslope hollow into the hollow axis to the south (Fig. 2). The single-benched section exposed 6–10 m of loess and, beneath the northern spur, the underlying sandy alluvium. Soil stratigraphic and loess unit boundaries were generally conformable with the ground surface, although the relief on deeper buried unit contacts was greater than on the surface. The loess comprised three sheets (L1–L3), the upper of which was divided into two subsheets L1a (upper) and L1b (lower). L1 comprised the clay-rich surface soil (0 –~1.3 m, Haplustalf; Soil Survey Staff, 2014) and pale (2.5Y 6/4, light yellowish-brown) poorly structured loess with common pedogenic carbonate in the form of ped coatings and fine rhizomorphs. The loess sheet was notable for a ca. 1.5-m-thick pale, massive silt loam unit (Bw(k)2) in which peaks in volcanic glass grain concentrations occurred. Our grain-size analysis showed the loess to be relatively poorly sorted, varying between 15 and 45 μm, with a mode in the medium to coarse silt. The boundary between loess sheets L1a and L1b was defined at the glass grain peak.
Peak glass grain distributions ranged from 2.3 × 10⁴ to 9 × 10⁴ grains/cm3 (Fig. 3). Generally, the sections where counting was at higher resolution revealed larger glass grain peaks. At section MtCas E2a (4 cm resolution), the distribution had a peak concentration of 4.6 × 10⁴ gr/cm3 at 2.80 m below ground level (BGL) and a heavy tail at greater depth to 3.30 m BGL. Above the peak, concentrations reached near 0 within a 0.3 m interval (i.e., at 2.50 m BGL). The peak occurred within 10 cm of the top of the Bw(k)2 horizon. At section MtCas x12, the 10 cm resolution counting revealed a maximum concentration of 2.3 × 10⁴ gr/cm3 at 3.55 m BGL but a broad zone of high concentration (>1.4 × 10⁴ gr/cm3) for 0.4 m above to 3.15 m BGL. This zone occurred 0.15 to 0.55 m below the top of the Bw(k)2 horizon. Farther to the south at MtCas A1c, 2.5 cm resolution counting showed a peak of 9.0 × 10⁴ gr/cm3 at 3.90 m BGL and a more symmetrical distribution of glass grains. Grains were distributed over an interval of 3.50–4.40 m BGL. At MtCas B2a, glass grains were not counted in detail, but inspection showed the greatest concentration occurred at 3.90 m BGL. At these two sections, the glass grain peak occurred nearer the lower boundary of the Bw(k)2 horizon. Electron microprobe elemental data showed glass composition indistinguishable from the Aokautere Ash member of the Kawakawa Tephra Formation (Supplementary Table S1).
(color online) Soil stratigraphy and cryptotephra glass grain concentration for analysed sections.

A thin zone of charcoal concentration was identified in the upper part of L1a: at 1.75 m BGL to the south in MtCas A1c and at 1.5 m depth to the north in MtCas E2a, both within the horizon beneath the Bt horizon of the surface soil.
The subdivision of L1 into units L1a and L1b was done largely on the observation of very little subfossil material below the datum of Kawakawa tephra. L1b included the lower part of the massive and pale Bw(k)2 horizon and below that a unit (Bw(k)3) that weathered cavernously and was finer textured and better structured (weak medium blocky). The Bw(k)3 unit graded diffusely into a yellower buried soil with strong structure and abundant pedogenic carbonate that marked the top of loess sheet L2.
Loess sheet L2 was much more strongly pedogenically altered than L1 above, being browner, more clayey, and better structured. Pedogenic carbonate was common and formed platy concretions along the boundaries of prisms in the bBw(k)3 horizon at 7.5 m BGL in MtCas A1c. The base of loess sheet L2 lay at about road level in the south of the section where it was about 2.5 m thick. The loess sheet thinned up section to the north.
The upper boundary of loess sheet L3 was marked by a prominent, brown, clay-rich Bt horizon (b2Bt(k)) underlain by distinctive, vertically oriented platy nodules up to 5 cm thick (b2Bkn horizon). The loess sheet was dominantly of clayey texture and well structured. The base of L3 was below road level in the south but rose to lie above pedogenically altered (2b3Bt(k)) alluvium in the north.
Subfossil material
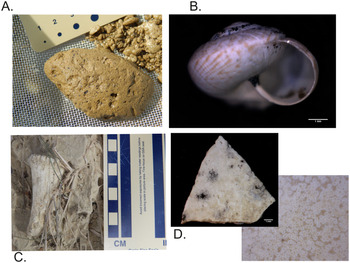
Loess sheet L1a was also notable for two concentrations of subfossil remains (Fig. 4). Along the whole section, a lower zone (SFZ 2) up to 1.5 m thick above Kawakawa tephra had the highest concentrations of bird bones, eggshell fragments, and gastropods. This zone of concentration was largely in the upper part of the Bw(k)2 horizon (3–4 m BGL) (Fig. 5). The eggshell and bird bones (some up to 30 mm in diameter) are very likely to be from moa (Dinornithiformes) (Holdaway, R., personal communication, 2012), although smaller bones may represent other birds. A stratigraphically higher zone (SFZ 1) of concentration (ca. 1 m thick) occurred at the southern end of the exposure largely within the Bw(k)1 horizon (1.5–2.5 m BGL).
(color online) Subfossil material from SFZ 2 in the Mt. Cass loess exposure. (A) Charcoal (Bwk horizon); (B) gastropod, Thalassohelix propinqua (Hutton 1882); (C) bird bone; (D) eggshell

(color online) Variation of loess sheet thickness, subfossil distributions, and inferred ages for isochrons along the Mt. Cass exposure. See Table 1 for sample identifiers.

All gastropods are representatives of the endemic Charopidae family. Taxonomic diversity was extremely low, with only two species present. A comparison of our specimens with the type specimens in the collection of the Te Papa Museum in Wellington revealed the presence of one known and another so far unnamed and undescribed taxon (Thallasohelix sp.). The dominant taxon Thallasohelix propinqua (Hutton 1882) is a common element of the modern molluscan fauna of Northern Canterbury reported from Motunau Island in the south through Amberley, Waipara, and the valley of Omihi Stream to areas reaching as far north as Kaikoura. However, no subfossil occurrences have been reported so far. It is a dry-tolerant taxon with a fairly ubiquitous habitat distribution. The taxon was reported from open-grassland habitats with tussocks and stands of Muhlenbeckia (Meissn., 1840), Leptospermum (J. R. et G. Forst., 1776) scrub, and bush and mixed forests. Members of the taxon occupy areas from sea level to altitudes of 750 m and even 1500 m above sea level. We noted that the specimens we collected were much smaller than the museum archetypes, possibly indicating the LGM molluscs were at their margin of tolerance. A third taxon whose representatives were retrieved from surface collections during later campaigns corresponds to the European invasive form Prietocella barbara (Linnaeus 1758). These were left out of the interpretations.
The calibrated radiocarbon ages of subfossil material spanned a range of 21,300 to 25,100 cal yr BP (Table 1). At the southern end of the section, the lower samples from MtCas B2a and MtCas A1c corresponded with the lower zone of subfossil concentration; ages ranged narrowly between 23,600 and 25,100 cal yr BP. At the northern end, in section MtCas E2a, ages spanned 21,300 to 24,000 cal yr BP and stratigraphically appear to have included both SFZ 1 and SFZ 2. A combined probability density function (pdf) of all radiocarbon ages (Fig. 6) created in Oxcal (online v. 4.3; Bronk Ramsey, Reference Bronk Ramsey2009) using the SHCal13 calibration curve showed the greatest probability of subfossil occurrence in the 25.3 to 23.3 cal ka BP range, with a secondary abundance peak in the 22.5 to 21.2 cal ka BP period, and ostensibly a window of absence in the range 23.5 to 22.5 cal ka BP. The individual ages comprising the older and younger peaks in the pdf correspond, respectively, to SFZ 2 and SFZ 1 (Fig. 5).
(color online) Relative abundances of eggshell and gastropods in subfossil zones (SFZs) 1 and 2, and probability density of ages of gastropods and moa eggshells. Also shown are climate events (NZce) of the NZ Climate Event Stratigraphy (Barrell et al., Reference Barrell, Almond, Vandergoes, Lowe and Newnham2013), and mean loess grain size.

Radiocarbon ages. Note, all gastropods were of the species Thalassohelix propinqua, and all eggshell, based on its robustness, was presumed to be from moa.

a Asterisks (*) denote dates used in age–depth model.
b Calibrated with SHCal13 (Hogg et al., Reference Hogg, Hua, Blackwell, Niu, Buck, Guilderson, Heaton, Palmer, Reimer and Reimer2013).
Chronology
Ages from the two sections at the southern end (MtCas B2a and MtCas A1c), representing the footslope to hollow floor, were combined using the glass grain peak to tie the two sections together. All ages occurred in stratigraphic order except that of sample CG063 in MtCas A1c. This sample produced the youngest age and yet was the deepest sample. We interpret this age as a stratigraphic outlier, the gastropod shell perhaps having been bioturbated downward. The tails in glass grain distributions extending up to 0.5 m below horizons of peak concentration support vigorous downward soil mixing. We speculate on the basis of a strong vermiform character in much of the loess that the mixing is caused by earthworms.
Within uncertainty, the ages of the topmost dated samples from the southern end (MtCas B2a: 21,500 and 21,400 cal yr BP) and the northern end (MtCas E2a: 21,300 cal yr BP) overlap (Table 1). At the shoulder site (MtCas E2a), the sample just below the Bt horizon is underlain by a charcoal-bearing layer (1.7 m BGL). There is a charcoal-bearing layer in the footslope site of MtCas A1c in a similar stratigraphic position and depth (1.5 m BGL). Thus, a similar age for them can be assumed (Fig. 5). Likewise, the eggshell samples found at a depth of 2.78 m BGL at the shoulder site MtCas E2a also yielded 14C ages (24,000 and 23,650 cal yr BP) similar to that of the gastropod shell found at a depth of 3.04 m BGL at the footslope site of MtCas A1c (24,000 cal yr BP). These two horizons are clearly isochronous along the entire exposure, similar to the one marked by peak accumulations of the Kawakawa tephra. The pedostratigraphic boundaries seem to follow the isochrons in the top ca. 3 m of the exposure. Conversely, the isochron marked by Kawakawa tephra varies in its relative position below the Bw(k)1/Bw(k)2 boundary, thus demonstrating a degree of independence of depositional and pedological stratigraphy
The age–depth model at MtCas A1c (Supplementary Figs. S1–S3) shows linear sediment accumulation from 24.6 to 23.8 cal ka BP at about 4.5 mm/yr. At the shoulder site MtCas E2a, sediment accumulation during the 25–24 ka time interval was effectively nil, but from 24 to 21.5 cal ka BP, sedimentation rate was around 1.2 mm/yr.
The single infrared-stimulated luminescence (IRSL) age from sample CAS-L-012 at 3.90 m BGL (the Kawakawa tephra datum) in MtCas A1c afforded an age of 21.5 ± 1.9 ka (Fig. 5). At section MtCas x12, sample CasA from 0.40 m above the tephra datum (3.10 m BGL) gave an age of 21.2 ± 1.7 ka, while sample CasB from 0.75 m below the tephra (4.25 m BGL), in loess unit L2, gave an age of 22.2 ± 1.3 ka (see Supplementary Tables S2 and S3 for details). Although there is good correspondence between the ages at or just above the tephra datum in the two sections, both ages underestimate the age of Kawakawa tephra by about 4 ka, which is at the very upper 2σ confidence limit. The sample from 0.75 m below the tephra isochron (CasB) is undoubtedly an age underestimate.
DISCUSSION
The loess at Mt. Cass comprises three loess sheets marked by soils formed into their upper boundaries, totalling about 10 m in thickness. Loess sheet L1 most likely represents the eLGM, while the underlying loess sheets L2 and L3 probably accumulated earlier in the last glacial cycle. As yet we have no ages to refine that inference any further. Our chronology of accumulation of loess sheet L1a spans the period 25.4 cal ka BP (Kawakawa tephra isochron) to 21 cal ka BP and is largely based on radiocarbon ages of subfossil gastropods and (moa) eggshell preserved in the high pH conditions. Ages from these materials were precise, stratigraphically plausible, and consistent with the currently accepted age of Kawakawa tephra. Small herbivorous gastropods are known to yield reliable ages for dating deposits of the past 40 ka with minimal error on the scale of perhaps a couple of hundred years (Sümegi and Hertelendi, Reference Sümegi and Hertelendi1997; Pigati et al., Reference Pigati, Quade, Shahanan and Haynes2004, Reference Pigati, Rech and Nekola2010, Reference Pigati, McGeehin, Muhs and Bettis2013; Rech et al., Reference Rech, Pigati, Lehmann, McGimpsey, Grimley and Nekola2011; Xu et al., Reference Xu, Gu, Han, Hao, Lu, Wang, Wu and Peng2011; Újvári et al., Reference Újvári, Molnár, Novothny, Páll-Gergely, Kovács and Várhegyi2014; Dong et al., Reference Dong, Cheng and Eiler2020). Moa eggshell also remains a closed system with respect to carbon over millennial time scales, making it ideal for radiocarbon dating (Higham, Reference Higham1994; Magee et al., Reference Magee, Miller, Spooner, Questiaux, McCulloch and Clark2009; Oskam et al., Reference Oskam, Haile, McLay, Rigby, Allentoft, Olsen, Bengtsson, Miller, Schwenninger and Jacomb2010, Reference Oskam, Jacomb, Allentoft, Walter, Scofield, Haile, Holdaway and Bunce2011). The small terrestrial gastropods we dated have not been the subject of any study of carbon exchange or reservoir effects, but by analogy with Northern Hemisphere fauna and the consistency with the moa eggshell ages, we have confidence in the chronology they have produced.
Our attempt to use IRSL to support our chronology encountered problems similar to those faced by other workers using luminescence methods in NZ loess (Almond, Reference Almond1996; Almond et al., Reference Almond, Moar and Lian2001, Reference Almond, Shanhun, Rieser and Shulmeister2007; Berger et al., Reference Berger, Almond and Pillans2001a). Our IRSL ages are not consistent with the radiocarbon chronology or the stratigraphic position of Kawakawa tephra. Grapes et al. (Reference Grapes, Rieser and Wang2010) documented systematic underestimation of the age of Kawakawa tephra (at that time accepted to be 27 cal ka BP) by luminescence dating in a number of sites where the tephra was macroscopic. However, they considered this underestimation to be evidence of an inaccurate age for the tephra. Since that time, the accepted best age of the tephra has decreased to 25.4 cal ka BP (Vandergoes et al., Reference Vandergoes, Hogg, Lowe, Newnham, Denton, Southon and Barrell2013a), but the ages cited by Grapes and colleagues are still underestimates, regardless of whether they came from above or below the tephra datum. Our current work corroborates the currently accepted age of Kawakawa tephra and confirms IRSL ages as underestimates. Similar to the experience Almond et al. (Reference Almond, Shanhun, Rieser and Shulmeister2007) had in dating loess by the same technique at Ahuriri, also in Canterbury (Fig. 1), IRSL ages underestimate loess depositional age by ~20% or more. We have no explanation for this problem, but its resolution remains a research priority.
Apparent rates of loess accumulation vary along the section and in time. The fastest accumulation (4.5 mm/yr) occurred in the footslope position soon after the deposition of Kawakawa tephra. At the hillslope shoulder, a hiatus in deposition occurred from the time of Kawakawa tephra through to about 24 cal ka BP. A stratigraphically discrete concentration of subfossil material (SFZ 2) in this time interval leads us to infer that this was a period of relatively high precipitation that led to high primary productivity, a rich fauna, but also overland flow erosion. We do not expect the variation in subfossil abundance to be an artefact of differential preservation because pH remains constant and uniformly high (>8.6) through the zone of sampling (Supplementary Fig. S4). The sedimentation rates in the footslope are at the very upper limit of accumulation rates internationally (Bettis et al., Reference Bettis, Muhs, Roberts and Wintle2003) for primary loess deposition and most likely represent coupled aeolian and colluvial deposition. The distributions of volcanic glass grains provide further evidence for an unconformity at the shoulder site. There, the distribution of grains is positively skewed (heavy tail at greater depths), whereas off the shoulder and into the footslope, the distributions become negatively skewed, and peak concentrations are greater. Our findings reinforce the need for careful consideration of landscape context when interpreting deposition (mass accumulation) rates of loess and loess grain size in terms of palaeoclimate (see Újvári et al., Reference Újvári, Kok, Varga and Kovács2016).
An estimate of primary loess accumulation rate can be gained from the shoulder section, where colluviation would be absent. Here, from 24 cal ka BP onwards, primary aeolian accumulation resumed at a rate of around 1 mm/yr, which is high by NZ standards. Eden and Hammond (Reference Eden and Hammond2003) report depths of Kawakawa tephra in loess of the North and South Islands in the range 1–2.5 m and accumulation rates generally less than 0.2 mm/yr. Thus, we conclude that our Mt. Cass site was proximal to the loess source, which was probably the aggrading fans of the Waipara River and its tributary Omihi Stream, no more than 1 km away at their closest, to the northwest (Fig. 1C). Accordingly, we expect changes in loess character (e.g., grain size) to reflect, at least in part, variations in westerly winds.
With respect to existing understandings of NZ climatic variation through the eLGM, the 25.4–24.0 cal ka BP humid period we infer overlaps but lasts longer than Otira Interstadial D (NZce-9; 25.4–24.5 cal ka BP) of the NZ-CES (Barrell et al., Reference Barrell, Almond, Vandergoes, Lowe and Newnham2013). Gastropod taxa preserved from this period (SFZ 2) have peak abundance and are larger than younger specimens in SFZ 1, which together with the common eggshell fragments and bones suggests a relatively luxuriant environment. Pollen and phytolith data from Howard Valley in northwestern South Island also indicate an amelioration of conditions following the deposition of the Kawakawa tephra, with a slight decrease in grass-tussock species accompanied by an increase in Nothofagus (Blume, 1850) and broad-leaved tree taxa in an alpine tussock grassland environment (Callard et al., Reference Callard, Newnham, Vandergoes, Alloway and Smith2013). Mean grain size from the colluvial MtCas A1c site declined over this period, indicating a fining of the aeolian sediment remobilised from higher in the hillslope hollow. Reestablishment of aeolian deposition at the shoulder site at 24 cal ka BP was of a similar (fine-grained) nature. At the same time, glaciers in South Island had retreated from their terminal moraines, which had stabilised sufficiently to allow Kawakawa tephra to accumulate as a macroscopic or cryptic layer (Suggate and Almond, Reference Suggate and Almond2005; Barrows et al., Reference Barrows, Almond, Rose, Fifield, Mills and Tims2013) and for soils to form. Cosmogenic nuclide exposure ages (Barrows et al., Reference Barrows, Almond, Rose, Fifield, Mills and Tims2013; Strand et al., Reference Strand, Schaefer, Putnam, Denton, Barrell, Koffman and Schwartz2019) put the culmination of that advance at ca. 26.5 ka east and west of the Southern Alps (Fig. 7). Such a retreat of glaciers immediately before 25.4 cal ka BP can only be attributed to warming, because invoking a decrease of precipitation would be contrary to our and other evidence of increased precipitation (Whittaker et al., Reference Whittaker, Hendy and Hellstrom2011; Williams et al., Reference Williams, McGlone, Neil and Zhao2015).
(color online) Palaeotemperature proxies aligned with the NZ Climate Event Stratigraphy (NZce; Barrell et al., Reference Barrell, Almond, Vandergoes, Lowe and Newnham2013), and the global last glacial maximum (Clark et al., Reference Clark, Dyke, Shakun, Carlson, Clark, Wohlfarth, Mitrovica, Hostetler and McCabe2009). From left to right: δ18O record from coastal Antarctic core WDC06 from the West Antarctic Ice Sheet Divide ice-coring project on the WD2014 time scale (Sigl et al., Reference Sigl, Fudge, Winstrup, Cole-Dai, Ferris, McConnell, Taylor, Welten, Woodruff and Adolphi2016) (the location of Kawakawa tephra is from Dunbar et al. [Reference Dunbar, Iverson, Van Eaton, Sigl, Alloway, Kurbatov, Mastin, McConnell and Wilson2017]); Chatham Rise alkenone sea-surface temperature record from core MD97-2120 (Pahnke and Sachs, Reference Pahnke and Sachs2006) on a time scale from Pahnke and Zahn (Reference Pahnke and Zahn2005), modified by us using the Vandergoes et al. (Reference Vandergoes, Hogg, Lowe, Newnham, Denton, Southon and Barrell2013a) age for Kawakawa tephra; the timings of glacial advances in New Zealand based on Darvill et al. (Reference Darvill, Bentley, Stokes and Shulmeister2016) and Strand et al. (Reference Strand, Schaefer, Putnam, Denton, Barrell, Koffman and Schwartz2019); the δ18O record from the NGRIP Greenland ice core (NGRIP Members, 2004) on the GIC05 time scale (Andersen et al., Reference Andersen, Svensson, Johnsen, Rasmussen, Bigler, Röthlisberger, Ruth, Siggaard-Andersen, Steffensen and Dahl-Jensen2006; Svensson et al., Reference Svensson, Andersen, Bigler, Clausen, Dahl-Jensen, Davies, Johnsen, Muscheler, Rasmussen and Röthlisberger2006); note that DO/GI corresponds to Greenland interstades; GS, Greenland stades (Rasmussen et al., Reference Rasmussen, Bigler, Blockley, Blunier, Buchardt, Clausen and Cvijanovic2014); H represents Heinrich events; Heinrich stade 2 (HS2) timing from Strand et al. (Reference Strand, Schaefer, Putnam, Denton, Barrell, Koffman and Schwartz2019). eLGM, extended LGM (Newnham et al., Reference Newnham, Lowe, Giles and Alloway2007) LGCP, last glacial coldest period (Alloway et al., Reference Alloway, Lowe, Barrell, Newnham, Almond, Augustinus and Bertler2007).

From 24 cal ka BP onwards, the climatic cooling into Otira glaciation stadial C (NZce-8) on the west coast of South Island was accompanied east of the Southern Alps by (1) drying, as inferred from a reduction of gastropod size; (2) accumulation of coarser-grained loess; and (3) cooling, as indicated by a culmination of a glacial advance (Fig. 7) in the Ohau catchment in the McKenzie Basin at 22.5 ± 0.7 ka (Putnam et al., Reference Putnam, Schaefer, Denton, Barrell, Birkel, Andersen, Kaplan, Finkel, Schwartz and Doughty2013). This glacial advance culmination aligns with the beginning of Otira glaciation interstade B (NZce-7), a time of relatively coarse-grained but variable loess deposition and conditions again more favourable to gastropods. A local minimum in grain size and a maximum in gastropod abundance occurs at 21.4 cal ka BP, near the end of the interstade (21.7 ± 0.3 ka; Barrell et al., Reference Barrell, Almond, Vandergoes, Lowe and Newnham2013). A culmination of glacial advances both east and west of the Southern Alps at 21 ka (Barrows et al., Reference Barrows, Almond, Rose, Fifield, Mills and Tims2013; Strand et al., Reference Strand, Schaefer, Putnam, Denton, Barrell, Koffman and Schwartz2019) suggest this interstade remained relatively cold, perhaps with high-frequency changes in climate. Above the 21 cal ka BP datum, the loess was strongly modified by pedogenesis associated with the surface soil. The loess became much more clay rich, although mean grain size continued to increase. We are reluctant to infer much about changes in grain size above this datum because of the known limitations of laser-based sizing methods for determining the clay fraction. An underestimate of the clay fraction by laser diffraction methods (Konert and Vandenberghe, Reference Konert and Vandenberghe1997; Yang et al., Reference Yang, Wang, Wendroth, Liu, Cheng, Huang and Shi2019) would result in erroneous increases in silt and sand proportions, and hence biased estimates of mean grain size. We found no subfossil remains in the surface soil (0–1.5 m depth), probably because the calcareous materials had been dissolved in the stronger leaching environment in which this soil formed. In NZ conditions, mean annual rainfalls of less than 500 mm are generally necessary for pedogenic carbonate to accumulate (Hewitt, Reference Hewitt2010), and therefore rainfalls above this must create leaching conditions too corrosive to allow allocthonous calcareous material to persist. We radiocarbon-dated pedogenic carbonate (data not shown) and found the youngest material was ca. 16 cal ka BP, suggesting rainfall increased above the 500 mm threshold sometime after that. A comparison with the current mean annual rainfall suggests a reduction in precipitation in the LGM and late glacial of at least 20%.
In general, our record of the eLGM from Mt. Cass together with the NZ-CES indicates interstades were characterised by relative warmth, wetness, and perhaps less vigorous westerlies, in contrast to the drier, colder, and invigorated westerlies of the stades. Barrows et al. (Reference Barrows, Juggins, De Deckker, Calvo and Pelejero2007a) and Doughty et al. (Reference Doughty, Schaefer, Putnam, Denton, Kaplan, Barrell, Andersen, Kelley, Finkel and Schwartz2015) argue for a causal link between Southern Ocean sea-surface temperature (SST), terrestrial temperatures, and glacial advances. The presence of Kawakawa tephra at Mt. Cass and in key records from the Southern Ocean and Antarctica allows us to consider these links, and drivers of millennial-scale climatic changes with high precision and without fear of miscorrelation (Fig. 7).
According to the NZ-CES, warming into Otira glaciation interstadial D began at the time of Kawakawa tephra, and our record suggests an increase in humidity and perhaps reduced westerly wind activity. Alkenone-derived SSTs at core site MD97-2120 (Pahnke et al., Reference Pahnke, Zahn, Elderfield and Schulz2003) on the Chatham Rise, east of South Island, increased slightly earlier, such that Kawakawa tephra fell not more than 200 yr after a peak SST of about 13°C (although this may be an overestimate; see Bostock et al., Reference Bostock, Hayward, Neil, Sabaa and Scott2015). At this time, the atmosphere around coastal Antarctica, as judged from the δ18O record of the WDC06 core at WAIS Divide (WAIS Divide Project Members, 2015; Fig. 1B) was undergoing a stepwise warming from a minimum at about 26 ka. All this took place while Greenland was experiencing stadial conditions. After Kawakawa tephra, SSTs at MD97-2120 (Fig. 7) slowly declined at first and then rapidly after 24 ka to a minimum at 23.5 ka in the Otira glaciation stade C. Meanwhile, coastal Antarctic temperatures rose to a peak during Antarctic Isotope Maximum (AIM) 2 (WAIS Divide Project Members, 2015). We contend that this pattern is consistent with the variant of the bipolar seesaw mechanism of Toggweiler and Lea (Reference Toggweiler and Lea2010) that addresses millennial-scale climate events. They hypothesise that a suppressed Atlantic Meridional Overturning Circulation (AMOC) during Northern Hemisphere stades drives the Intertropical Convergence Zone into the SH, thus spinning up and shifting the SH westerlies southward. This has the effect of enhancing overturning in the polar Southern Ocean and reducing heat transport north. Upon reinvigoration of the AMOC, heat transport northwards strengthens and Antarctica cools. Evidence of this mechanism operating close to NZ is given by De Deckker et al. (Reference De Deckker, Moros, Perner and Jansen2012). They document close coupling between Heinrich stades in the North Atlantic and ocean warming south of Australia. The coupling operates by means of poleward shifts of the subtropical front (STF) during Heinrich stades, which switch on advection of heat by the Leeuwin Current flowing south from the Indo-Pacific Warm Pool and then westwards along the Australian continent.
Currently, marine core site MD97-2120 sits south of the STF, and the front here is essentially pinned bathymetrically. West of South Island, the front is free to move, and during glacial times it migrated up to 3°–5 ° north (Kohfeld et al., Reference Kohfeld, Graham, De Boer, Sime, Wolff, Le Quéré and Bopp2013). Bostock et al. (Reference Bostock, Hayward, Neil, Sabaa and Scott2015) concluded that in the period 25–21 ka, the Southern–STF (S-STF: the nondynamical zone of strong SST and salinity contrast) was sufficiently far north that it was discontinuous across South Island and there was no leakage of Tasman Sea water to the east. Under these conditions MD97-2120 should record low SSTs. However, the SST peak (up to 13°C) at 25.4 to 24 ka suggests otherwise. We posit that the warming of the land and ocean, increase in rainfall and decrease of westerly wind activity over this time was related to northern South Island being surrounded by subtropical water grading into waters of the subtropical frontal zone (STFZ) (Fig. 1) in central South Island. Bostock et al. (Reference Bostock, Hayward, Neil, Sabaa and Scott2015) located the S-STF where it met western South Island in the period 25–21 ka on the basis of SSTs from marine cores SO136-GC11 (Barrows et al., Reference Barrows, Lehman, Fifield and De Deckker2007b) and MD06-2986 (Hayward et al., Reference Hayward, Sabaa, Kolodziej, Crundwell, Steph, Scott, Neil, Bostock, Carter and Grenfell2012; Fig. 1). Bostock et al. (Reference Bostock, Hayward, Neil, Sabaa and Scott2015) asserted that low SSTs over this interval imply the core sites lay beneath sub-Antarctic waters (SAW; Fig. 1). However, closer inspection of the high-resolution SO136-GC11 record shows (alkenone) SSTs from 26–24 ka being around 12°C, after which cooling was precipitous. An SST of 12°C is consistent with Bostock et al.'s criterion for water of the STFZ (Fig. 1). The MD06-2986 record is much lower resolution, but suggests SSTs at 25–24 ka closer to 11°C. We argue SSTs from both of these records are more characteristic of STFZ water than SAW. Accordingly, the STF position at 25–24 ka was more likely akin to that shown by Bostock et al. (Reference Bostock, Hayward, Neil, Sabaa and Scott2015) for the early deglaciation, when some water from the STFZ leaked via the dynamic STF (Fig. 1) onto the Campbell Plateau, as suggested by Hayward et al. (Reference Hayward, Sabaa, Kolodziej, Crundwell, Steph, Scott, Neil, Bostock, Carter and Grenfell2012) for the LGM. Such a configuration could account for the SST peak at site MD97-2120 over this time interval, while northern and central South Island were being warmed and wetted by heat and moisture advected by the westerlies from the relatively warm Tasman Sea.
We propose that a southward shift of the STF at 25–24 ka was a response to Heinrich stade 2 (Fig. 7), when AMOC was suppressed and SH westerlies moved south. Strand et al. (Reference Strand, Schaefer, Putnam, Denton, Barrell, Koffman and Schwartz2019) argued on the basis of short lag times between culminations of glacial advances and succeeding Heinrich stades (HS) for an underlying Heinrich “pulsebeat” to South Island glaciation, at least during HS1 and the Younger Dryas. We suggest HS2 promoted analogous climatic and glacial responses through a mechanism operating via the atmosphere (SH westerlies) and the ocean (position of the STF). The subsequent cooling of the land and the ocean east and west of South Island at 24 ka reflects the northward migration of the STF documented by Bostock et al. (Reference Bostock, Hayward, Neil, Sabaa and Scott2015). At the same time, coastal Antarctica warmed (AIM2), indicating greater thermal isolation (less heat export), perhaps as a result of intensified westerlies. The origin of the climatic variability in the period 24–21 ka that resulted in two glacial advances on eastern South Island (culminating at 22.5 and 21 ka) and the intervening interstade represented by our gastropod zone SFZ 1 and Otira interstade B of the NZ-CES remains uncertain. We note this time interval corresponded to uniformly low SSTs in the Tasman Sea west of central South Island (Barrows et al., Reference Barrows, Lehman, Fifield and De Deckker2007b), and hence a mechanism involving migration of the STF cannot be invoked.
CONCLUSIONS
We derive a record of precipitation and aspects of wind regime for the eLGM based on subfossil gastropods, bird eggshell, and loess grain size in eastern South Island. The structure and timing of climatic variation is closely aligned with the NZ-CES, despite the latter being from western South Island and based on pollen. Our proxies suggest interstadial events beginning at 25.4 cal ka BP and 22.6 cal ka BP may be of slightly longer duration than as defined in the NZ-CES, but uncertainties in the definition of the event boundaries and the interpretation of proxies’ responses to climatic changes do not allow us to consider any leads or lags. Our chronology, based on radiocarbon ages of gastropods and eggshell, is precise and is consistent with the currently accepted age of Kawakawa tephra. By contrast IRSL dating produced imprecise underestimates (>20%). Detailed stratigraphic tracing of isochrons suggests the presence of unconformities in the loess and a diachronous character to some pedostratigraphic boundaries; both findings suggest caution in interpreting loess pedostratigraphy from single sections.
An interstade beginning close to the time of Kawakawa tephra (25.4–24.0 cal ka BP) was characterised by humidity, high primary productivity, and less vigorous westerlies at our site on the east of South Island. Elsewhere on South Island and in the ocean to the east and west, it was relatively warm and glaciers in the Southern Alps had retreated. The subsequent stadial event (24.0–22.6 cal ka BP) saw aridity, reduction in primary productivity, likely reinvigorated westerlies, declining SSTs (>3°C) east and west of South Island, and advancing glaciers.
The pattern of climatic responses in coastal Antarctica, the South Island of NZ, and the North Atlantic we see over part of the eLGM may be explainable in terms of a bipolar seesaw mechanism. We suggest that suppression of AMOC in Heinrich stade 2, drove SH westerly winds south and with them the STF, which surrounded central South Island in warmer ocean water (Otira interstade D). Heinrich event 2 at ca. 24 ka brought about a near shutdown of AMOC, coastal Antarctica warmed abruptly, and the STF shifted north, which cooled South Island (Otira glaciation stade C).
ACKNOWLEDGMENTS
We thank the following for facilitating this work: Tom Gardner for making IRSL ages CasA and CasB available to us, and similarly Uwe Rieser for IRSL age Cas A1-390; the Royal Arch Centennial Fund for operational funding; the Natural Environmental Research Council Radiocarbon Facility, and in particular Charlotte Bryant, for radiocarbon dating under project allocation number 1535.0311; Jon Fellowes (University of Manchester) for assistance with the electron microprobe analyses; and the European Union and the State of Hungary, co-financed by the European Regional Development and the Ministry of Human Capacities, Hungary Grant 20391-3/2018/FEKUSTRAT for support for SG and PS. We are also grateful for the reviews by Alan Palmer and Patrick De Deckker and input from the editors (Derek Booth and Jamie Shulmeister), which improved the article.
SUPPLEMENTARY MATERIAL
The supplementary material for this article can be found at https://doi.org/10.1017/qua.2020.95