Introduction
Metal matrix composites (MMCs), in comprise of the metal matrix and the second-phase reinforcement fillers, have been widely studied for aerospace, defense, and automobile applications attribute to their superior mechanical properties including high hardness, low coefficient of thermal expansion, high yield strength, and creep resistance in high temperature environments [Reference Mortensen and Llorca1]. Comparing with the commonly used steels or aluminum alloy matrix composites, titanium-based MMC possesses higher specific strength, corrosion resistance, toughness, and operating temperature [Reference Seagle and Knittel2, Reference Kondoh, Threrujirapapong, Imai, Umeda and Fugetsu3, Reference Munir, Kingshott and Wen4], thereby attracts much attention in recent years. At the same time, among various previously reported reinforcement fillers, graphene has been considered as an ideal nanomaterial filler for MMCs due to its superior thermal conductivity [Reference Balandin, Ghosh, Bao, Calizo, Teweldebrhan, Miao and Lau5], high electrical conductivity [Reference Novoselov, Geim, Morozov, Jiang, Zhang, Dubonos, Grigorieva and Firsov6], as well as high Young’s modulus [Reference Lee, Wei, Kysar and Hone7] and tensile strength [Reference Lee, Wei, Li, Carpick, Kysar and Hone8]. In this perspective, it is of enormous technical interests to develop the graphene–reinforced titanium (Ti–Gr) nanocomposites for manufacturing high-performance structural materials.
To review prior works, graphene-reinforced composites have been extensively investigated ranging from polymer matrix composites [Reference Markandan, Chin and Tan9, Reference Potts, Dreyer, Bielawski and Ruoff10] and ceramic matrix composites [Reference Markandan, Chin and Tan9, Reference Singh, Joung, Zhai, Das, Khondaker and Seal11] to MMCs (e.g., aluminum [Reference Bastwros, Kim, Zhu, Zhang, Wang, Tang and Wang12, Reference Pérez-Bustamante, Bolaños-Morales, Bonilla-Martínez, Estrada-Guel and Martínez-Sánchez13, Reference Li, Xiong, Wang, Yan, Yang, He, Chen, Wang, Zhang and Dai14], copper [Reference Koltsova, Nasibulina, Anoshkin, Mishin, Kauppinen, Tolochko and Nasibulin15, Reference Hwang, Yoon, Jin, Lee, Kim, Hong and Jeon16, Reference Kim, Lee and Han17, Reference Tang, Yang, Wang and Li18], nickel [Reference Kuang, Xu, Liu, Hu and Wu19, Reference Zhaodi, Nan, Khurram, Yang, Shaoxing, Bin and Luo20, Reference Hu, Tong, Lin, Nian, Shao, Hu, Saei, Jin and Cheng21], magnesium [Reference Chen, Konishi, Fehrenbacher, Ma, Xu, Choi, Xu, Pfefferkorn and Li22, Reference Rashad, Pan, Tang, Lu, Asif, Hussain, She, Gou and Mao23, Reference Rashad, Pan, Asif and Tang24, Reference Rashad, Pan, Tang, Asif and Aamir25, Reference Rashad, Pan, Hu, Asif, Hussain and She26, Reference Rashad, Pan, Lin and Asif27], and iron [Reference Lin, Richard Liu and Cheng28] based metal composites). Though the existing efforts demonstrated that graphene successfully enhanced the mechanical, thermal, and electrical properties of the nanocomposites, very few studies on Ti–Gr nanocomposites have been carried out due to the high chemical activity of the titanium. In other words, the titanium would be prone to chemically react with graphene, thus hindering the fabrication of high-performance Ti–Gr nanocomposites. To resolve this issue, low-temperature or fast-heating based manufacturing methods may be used to minimize the unwanted chemical reaction through thermal dynamic or thermal kinetic mechanisms. For instance, Jagannadham et al. fabricated the Ti–Gr composites on polished Ti substrates through a two-step deposition method [Reference Jagannadham29]. Yang et al. reported the fabrication of Ti–Gr composites by microwave melting [Reference Yang, Huang, Wang, Shang, Huang and Zhang30]. And our group previously reported the single layer graphene oxide (SLGO) reinforced Ti matrix composites coating by laser sintering [Reference Hu, Tong, Nian, Xu, Saei, Chen, Chen, Zhang, Guo and Xu31].
In our previous study [Reference Hu, Tong, Nian, Xu, Saei, Chen, Chen, Zhang, Guo and Xu31], we have successfully fabricated a single layer coating of Ti–Gr nanocomposite through laser sintering, and we proved the rapid heating and cooling during laser sintering process helps to integrate graphene into metal matrix without severe structural damage to graphene. Herein, this study investigates the fabrication of the bulk Ti–Gr nanocomposites with millimeter thickness through a layer-by-layer manner with Ti–Gr mixture powder bed. By using this selective laser sintering/melting process, we are able to control the laser beam movement and the sample shape through a computer-controlled laser scanning path. Multiple characterizations, including scanning electron microscopy (SEM), energy dispersive spectroscopy (EDS), X-ray diffraction (XRD), X-ray photoelectron spectroscopy (XPS), and Raman spectroscopy, were used to reveal the microstructure and micromorphology of the as-prepared nanocomposite, especially the interface between the metal matrix and graphene nanofillers. Mechanical testing has been carried out to study the incorporation effect of graphene on the strength of the bulk Ti–Gr nanocomposites after the multilayer laser melting.
Results and discussion
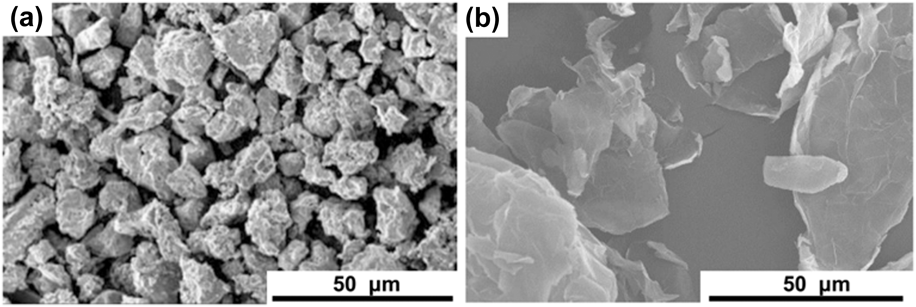
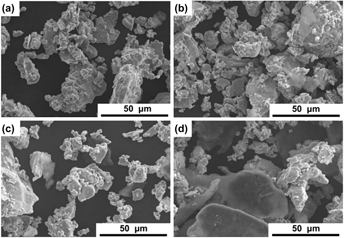
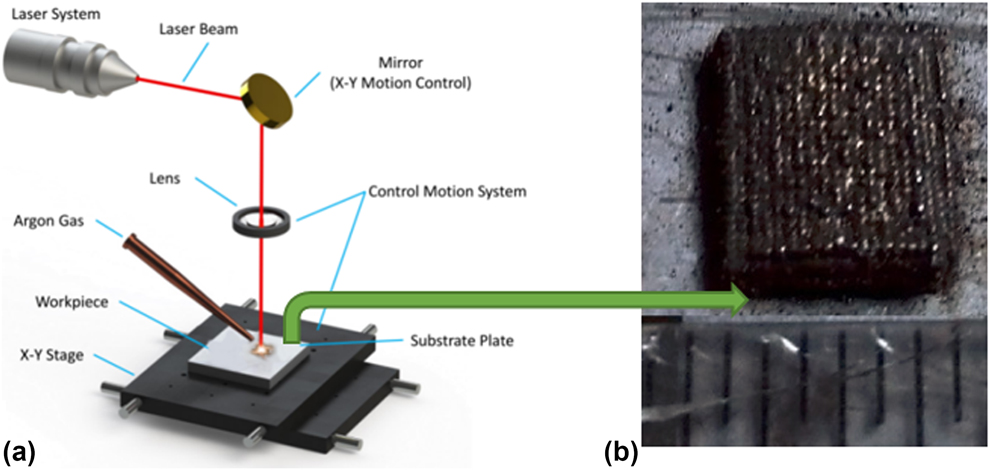
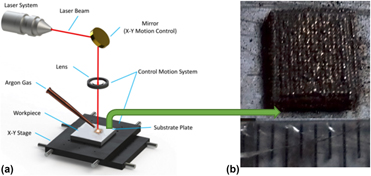
Figures 1(a) and 1(b) show the morphologies of the raw materials used in this study, Ti powders with an average diameter of ∼25 μm, and multilayer graphene nanoplatelets with an average lateral size of ∼50 μm. After planetary ball milling, four Ti–Gr powders with different mixing ratios were prepared: Ti–0.5 wt% Gr, Ti–1 wt% Gr, Ti–2.5 wt% Gr, and Ti–5 wt% Gr. As shown in Figs. 2(a)–2(d), an increasing number of graphene nanoplatelets show in the samples from 0.5 wt% to 5 wt%, while the morphologies of the titanium powders exhibit no obvious change. Figure 3 demonstrates the schematic of the laser melting process. A SD-MD300 Nd:YAG millisecond pulse laser system was used to perform the laser melting process. During processing, the titanium powder within the laser projected area became a molten pool. At the same time, a continuous argon gas is pumping out to protect the processing location from oxidation to nitrification. The sample is moved by a numerical controlled x–y stage so that the laser spot can scan all the surface area.
SEM images of (a) Ti powder and (b) graphene nanoplatelets.

SEM images of (a) Ti–0.5 wt% Gr powder, (b) Ti–1 wt% Gr powder, (c) Ti–2.5 wt% Gr powder, and (d) Ti–5 wt% Gr powder.

(a) Schematic of the selective laser melting setup and (b) final sample.

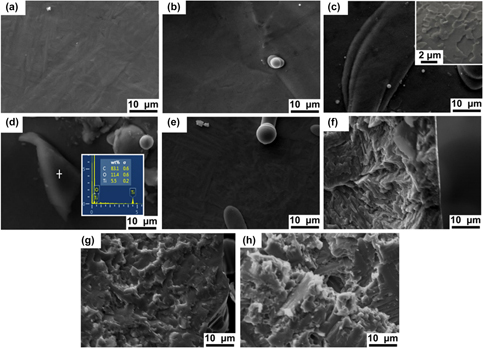
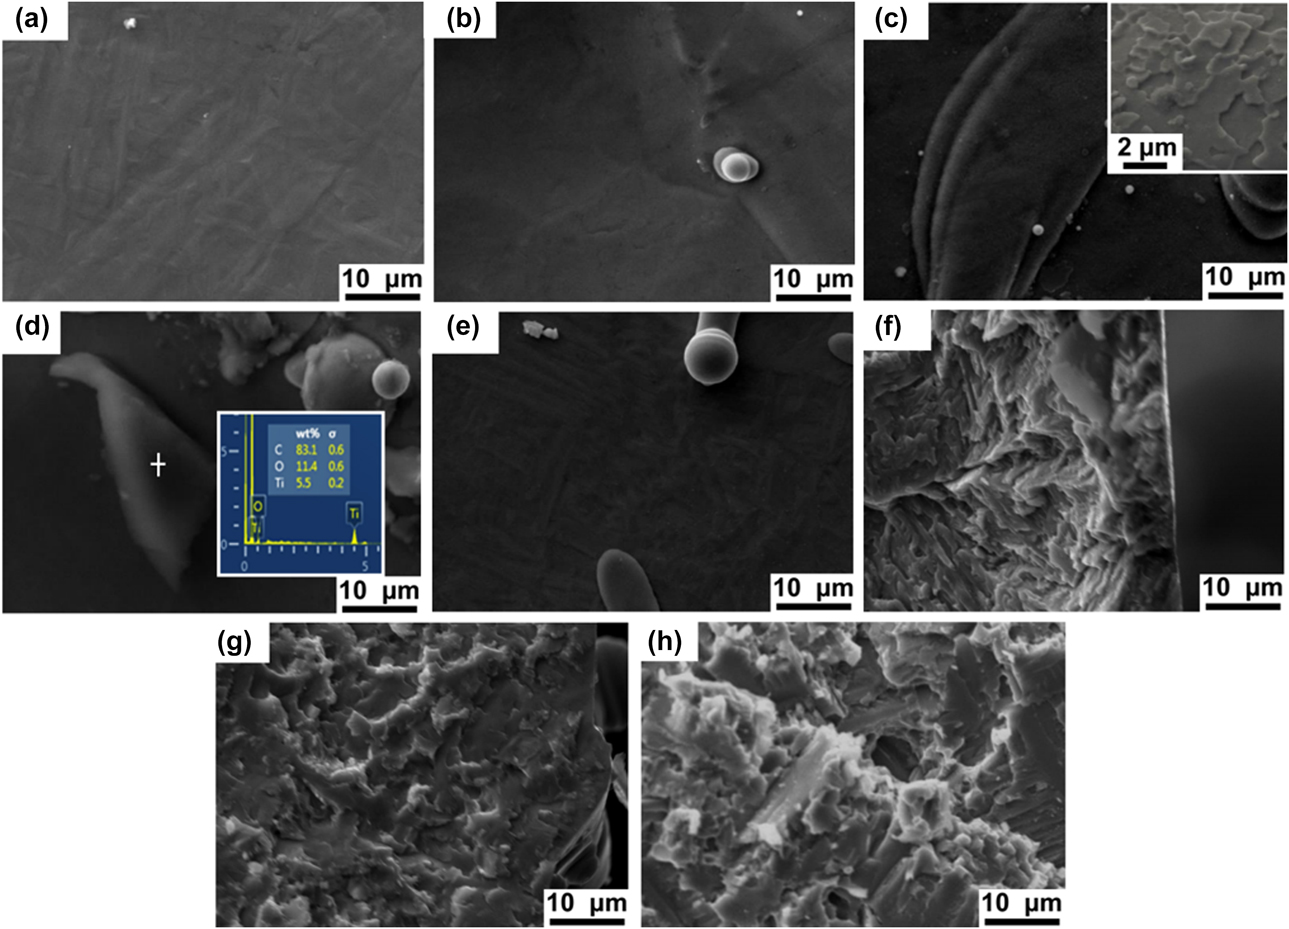
Figures 4(a)–4(e) show the surface morphologies of the laser-melted Ti–Gr nanocomposites with different weight ratios and pure Ti. The surface morphologies of Ti–Gr composite [Figs. 4(a)–4(d)] are similar to that of pure Ti [Fig. 4(e)]. The inset image in Fig. 4(c) illustrates that graphene nanoplatelets can be found on the surface of the 2.5 wt% Ti–Gr composites in a higher magnification. Figures 4(f)–4(h) show the cross-sectional SEM images of pure Ti, 0.5 wt% Ti–Gr, and 5 wt% Ti–Gr nanocomposites. Uniform dispersions of graphene nanoplatelets in Ti matrices can be observed in the Ti–Gr nanocomposites [Figs. 4(g) and 4(h)], which indicates that during the laser melting process, the Ti in the powder bed is entirely melted while the graphene stayed at solid state due to a much higher melting temperature. Such uniform dispersions of graphene reinforcements in the composites can be greatly beneficial to the mechanical behavior of the composites by providing high-hardness networks for blocking the movement of dislocations. This intriguing finding is contradictory with the common sense that the graphene flakes can easily agglomerate during laser melting process because of the surface energy difference with the molten metal. In fact, during laser processing, a convectional mass transfer within the molten pool could occur due to the gradient changes of the temperature and surface energy from the top to the bottom. The graphene nanoplatelets could be stirred by the turbulent flow in the molten pool and uniformly distributed under such condition. Then, the distribution of graphene nanoplatelets is stabilized, thanks to the fast cooling. In addition, the formation of carbide is also helpful, as the formed metal carbide increases the wettability of graphene and simultaneously anchors the graphene sheets.
SEM images of surface morphology of laser-melted (a) 0.5 wt% Ti–Gr, (b) 1 wt% Ti–Gr, (c) 2.5 wt% Ti–Gr, (d) 5 wt% Ti–Gr nanocomposites, and (e) pure Ti. Cross-sectional morphology of (f) pure Ti, (g) 0.5 wt% Ti–Gr, and (h) 5 wt% Ti–Gr nanocomposites. The inset image in (c) is the surface morphology of 2.5 wt% Ti–Gr nanocomposite.
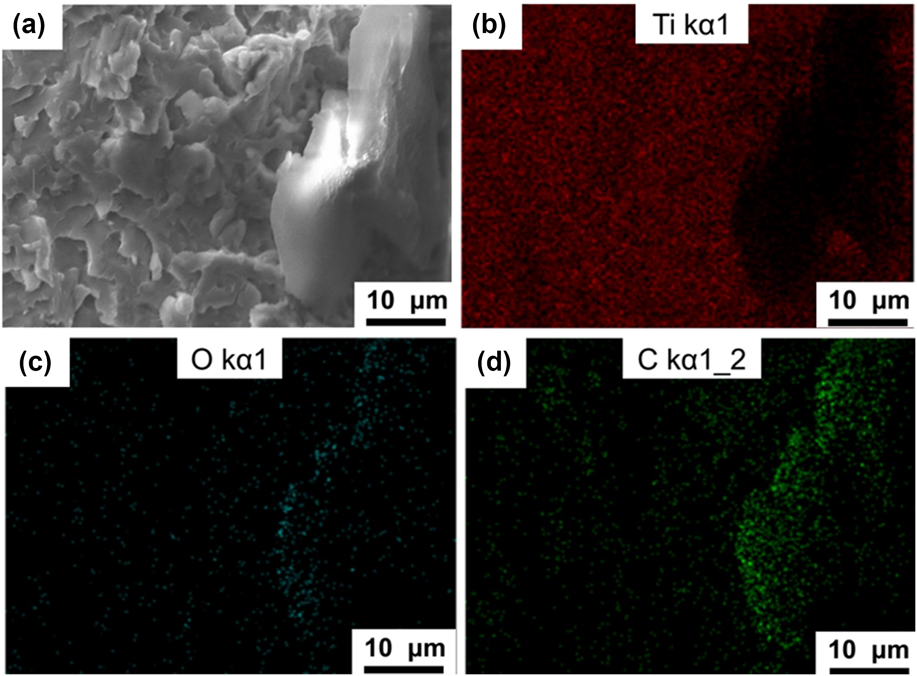
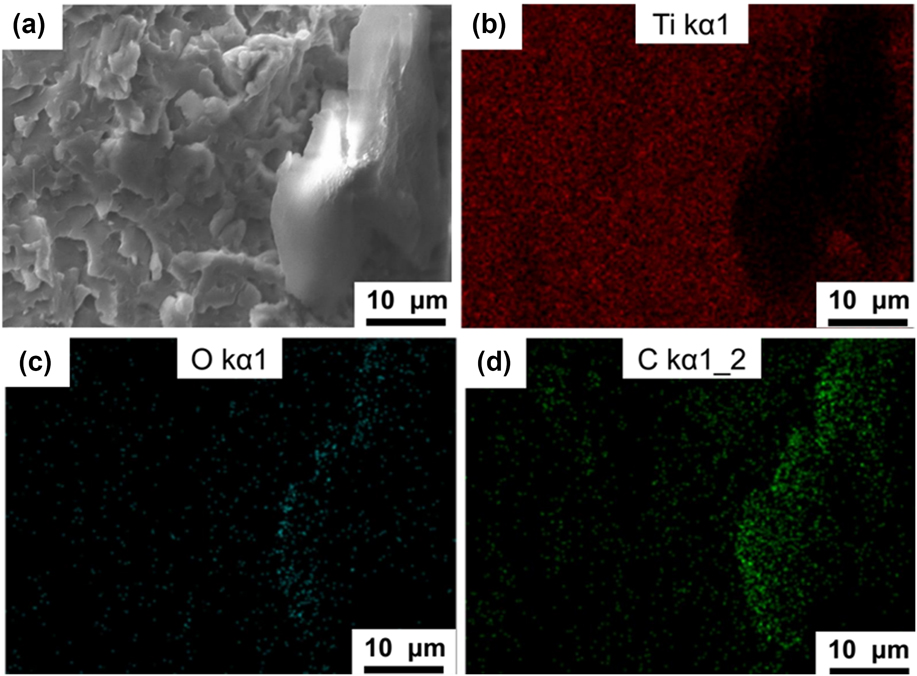
To investigate the composition of the nanocomposites, a series of spectroscopic characterizations were performed. Figures 5(a)–5(d) present the cross-sectional SEM image of the Ti–Gr nanocomposite and its corresponding EDS maps of titanium, oxygen, and carbon, respectively. The EDS map of titanium [Fig. 5(b)] indicates that an area in the titanium matrix is covered by another phase. This phase is corresponding to the highlight area in the EDS map of carbon [Fig. 5(d)], which is clearly the evidence of the graphene nanoplatelets. As shown in Fig. 5(c), low oxygen content is observed in the whole mapping area; however, the oxygen content in the graphene area is higher than that in the matrix area.
(a) Cross-sectional SEM image of Ti–Gr nanocomposites and its corresponding EDS maps of (b) titanium (red dots), (c) oxygen (blue dots), and (d) carbon (green dots).
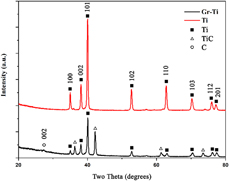
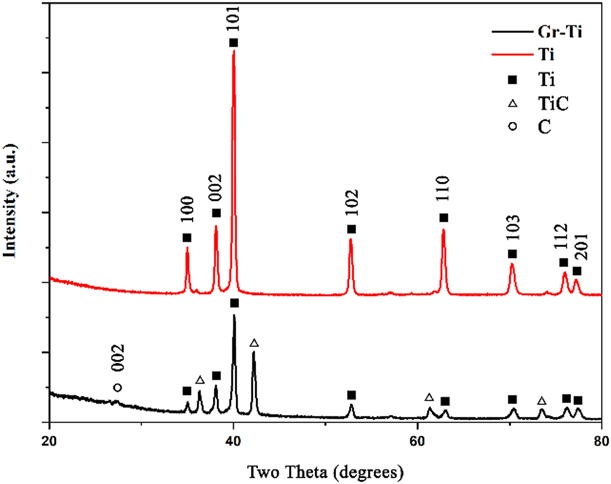
As shown in Fig. 6, the XRD patterns of the laser-melted Ti and Ti–Gr nanocomposites have the same set of peaks corresponding to Ti(100), (002), (101), (102), (110), (103), (112), and (201), respectively. The peaks of C and TiC emerge in the XRD pattern of Ti–Gr nanocomposite, which indicates that only a fraction of the graphene platelets was consumed by the chemical reaction between C and Ti. The small peak at the degree of 26.3° can be indexed into C(002). The TiC diffraction peaks are denoted by the symbol “+”. The appearance of TiC should be resulted by the reaction between the graphene and Ti matrix at the interfacial regions during the laser sintering process [Reference Lin, Richard Liu and Cheng28]. There is no oxygen-related peak observed in Fig. 6, which means that the oxides are sparsely distributed, or the low content of the oxides cannot give rise to any obvious diffraction peaks. This can be contributed by the effective protection of the Ar gas against oxidization during laser-melting process.
XRD patterns of laser-melted Ti (red line) and Ti–Gr nanocomposites (black line).
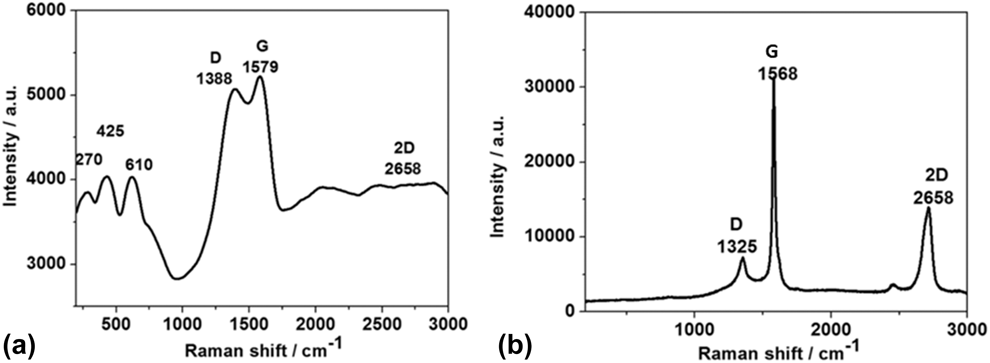
Raman spectroscopy was exploited to characterize and compare the laser-melted Ti–Gr nanocomposites and original graphene platelets. Figure 7(a) shows the Raman spectra of the laser-melted Ti–Gr nanocomposites. The significant peaks at ∼1388, ∼1579, and ∼2658 cm−1 are corresponding to the D peak, G peak, and 2D peak of graphene, respectively. In comparison to the Raman spectrum of the original graphene, as shown in Fig. 7(b), the differences are the peak positions and the intensity ratio of D peak and G peak (I D/I G). The positions of the graphene-related peaks shifted to lower values after laser melting. This phenomenon was also reported in other graphene-reinforced MMCs [Reference Pavithra, Sarada, Rajulapati, Rao and Sundararajan32]. The I D/I G ratio is often related to the defect status in graphene [Reference Ferrari33]. In the Raman spectrum of the Ti–Gr nanocomposite, the I D/I G value is much higher than that of the original graphene, suggesting the increased defects in graphene after laser processing. Moreover, the 2D peak of graphene is almost disappeared in the Raman spectrum of the Ti–Gr nanocomposite, indicating the existence of mostly multilayer graphene in the nanocomposite. Three TiC peaks are noticed in the Raman spectrum of the Ti–Gr nanocomposite [Fig. 7(a)] at ∼270, ∼425, and ∼610 cm−1 [Reference Lohse, Calka and Wexler34, Reference Karthiselva and Bakshi35]. This is consistent with the XRD results, by which it is demonstrated that the graphene sheets were successfully incorporated into the Ti matrix after the selective laser melting process.
Raman spectra of (a) laser-melted Ti–Gr nanocomposites and (b) original graphene.

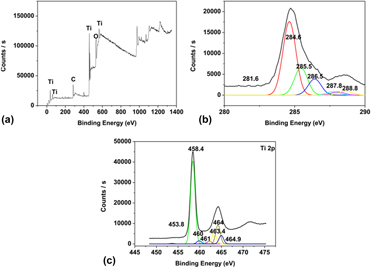
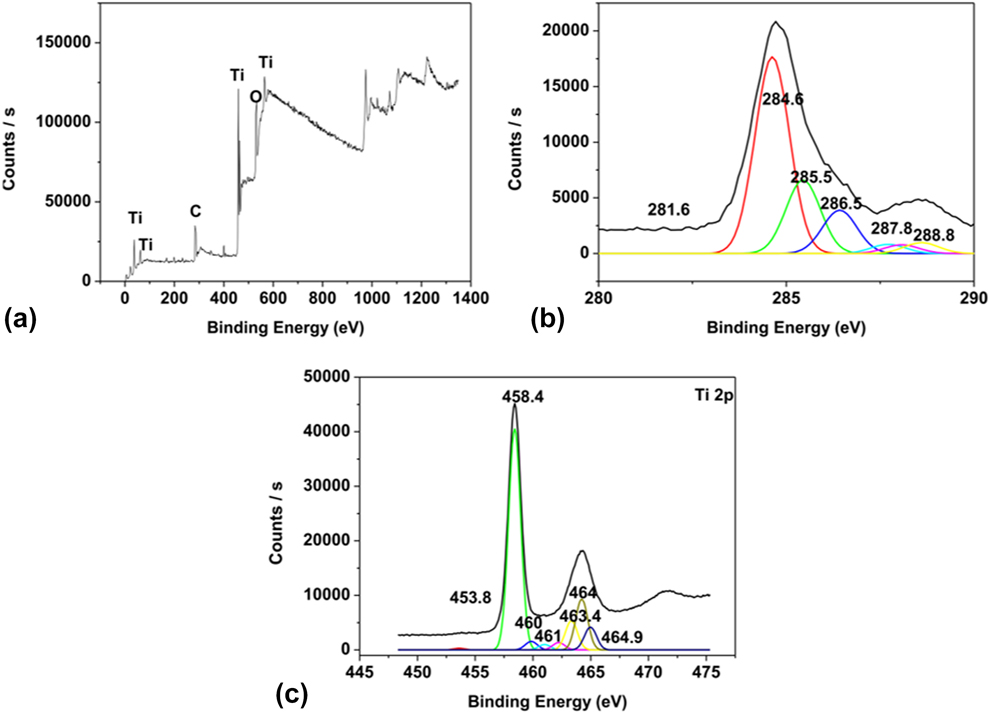
The constitutional compositions of the Ti–Gr nanocomposites were measured via the XPS, as shown in Fig. 8. The main elements of the composite, C and Ti, can be found in the spectrum [Fig. 8(a)] at ∼284 and ∼458.4 eV. The peaks at binding energy of 561 eV, 37 eV, and 62 eV are proved to be Ti 2s, Ti 3s, and Ti 2p 3/2, respectively. The peak at ∼531 eV is corresponding to O 1s, and it can be either from TiO2 or C=O. Figure 8(b) shows the peak fitting results of the C spectrum, showing a TiC peak at 281.6 eV, a C peak at 284.6 eV, a peak of –COO– groups at 288.8 eV, a peak of C sp 3 at 285.5 eV, a peak of C–O at 286.5 eV, and a peak of –C=O groups at 287.8 eV, respectively [Reference Li, Fan, Tan, Guo, Xiong, Su, Li and Zhang36]. In the peak fitting results of the Ti spectrum [Fig. 9(c)], there are peaks at 453.8, 458.4, 460, 461, and 464.2 eV. The peaks at 453.8 and 460 eV are corresponding to Ti 2p 3/2 and Ti 2p 1/2, respectively. The peaks at 458.4, 463.4, 464, and 464.9 eV are corresponding to Ti 2p 3/2 and Ti 2p 1/2 of TiO2. This is consistent with the existence of the oxygen peak at 531 eV, indicating a slight oxidation occurred on the surface of the nanocomposite during processing. The other peaks located at 460 and 461 eV are corresponding to Ti 2p 3/2 (TiC) and Ti 2p 1/2 (TiN), respectively. From the three XPS spectra, it is confirmed that the Ti–Gr nanocomposite has the following components, graphene, TiC, TiO2, and possibly TiN.
The XPS spectra of the Ti–Gr nanocomposites on the surface: (a) the whole survey XPS spectra, (b) carbon spectrum, and (c) Ti spectrum.
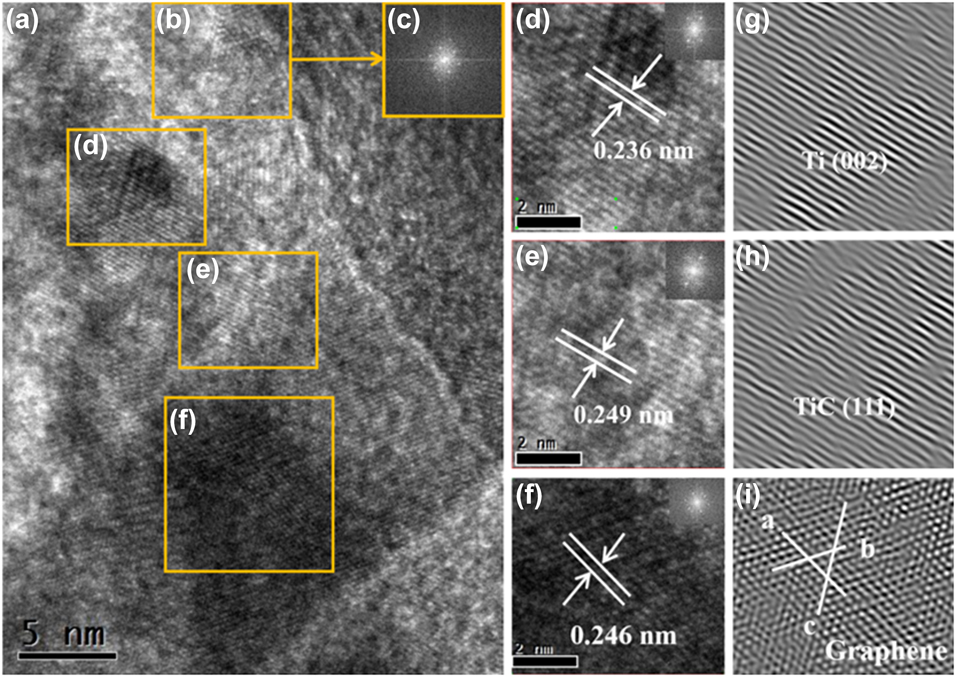
HRTEM images of Ti–Gr composites: (a) Ti, graphene, reaction products (TiC, TiO2), and their interface, (b) graphene area with (c) corresponding SAED patterns, (d) Ti area with SAED patterns, (e) TiC area with SAED patterns, (f) graphene area with SAED patterns, and (g–i) corresponding inverse fast Fourier transform images of (d–f).
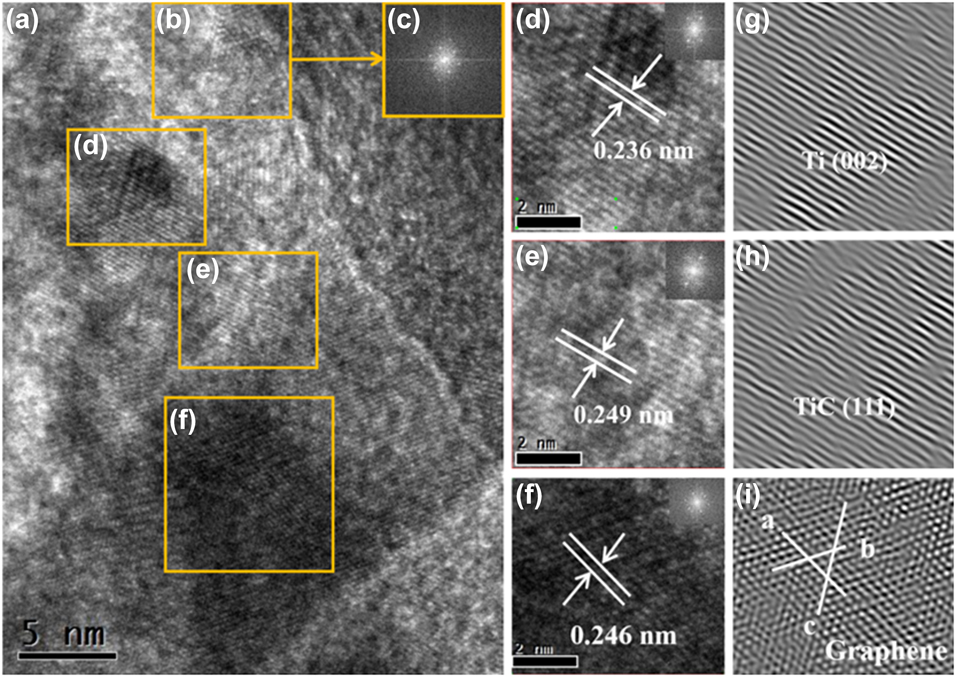
The microstructures and phase compositions of the Ti–Gr nanocomposites are investigated using TEM. Figure 9(a) shows the high-resolution transmission electron microscopy (HRTEM) image of a local region in the Ti–Gr composites that contains Ti (Area d), graphene (Area f), and TiC (Area e). Area b contains both graphene and Ti, which can be confirmed by the selected area electron diffraction (SAED) pattern of this area, as shown in the inset image c. Figures 9(d)–9(f) are the magnified HRTEM images of the regions of Ti, TiC, and graphene, respectively, and Figs. 9(g)–9(i) are the corresponding inverse fast Fourier transform (IFFT) images. In the region of Ti, as shown in Fig. 9(d), the lattice fringes of Ti(002) are observed with the lattice distance of 0.236 nm. Lattice fringes of TiC(111) emerge in Fig. 9(e) with the lattice distance of 0.249 nm. Graphene lattice fringes with the distance of 0.246 nm are exhibited in Figs. 9(f) and 9(i). The evidence of TiC forming in the interface between titanium and graphene agrees with the results from XRD, Raman, and XPS characterizations. It suggests that the chemical reaction between these two components took place during the laser processing. However, it is sure that graphene is only partially consumed by the chemical reaction, which can be attributed to the fast laser process that significantly reduces the reaction time comparing to the conventional casting process. Overall, the HRTEM images confirm the well-defined nanostructures consist of Ti, TiC, and graphene.
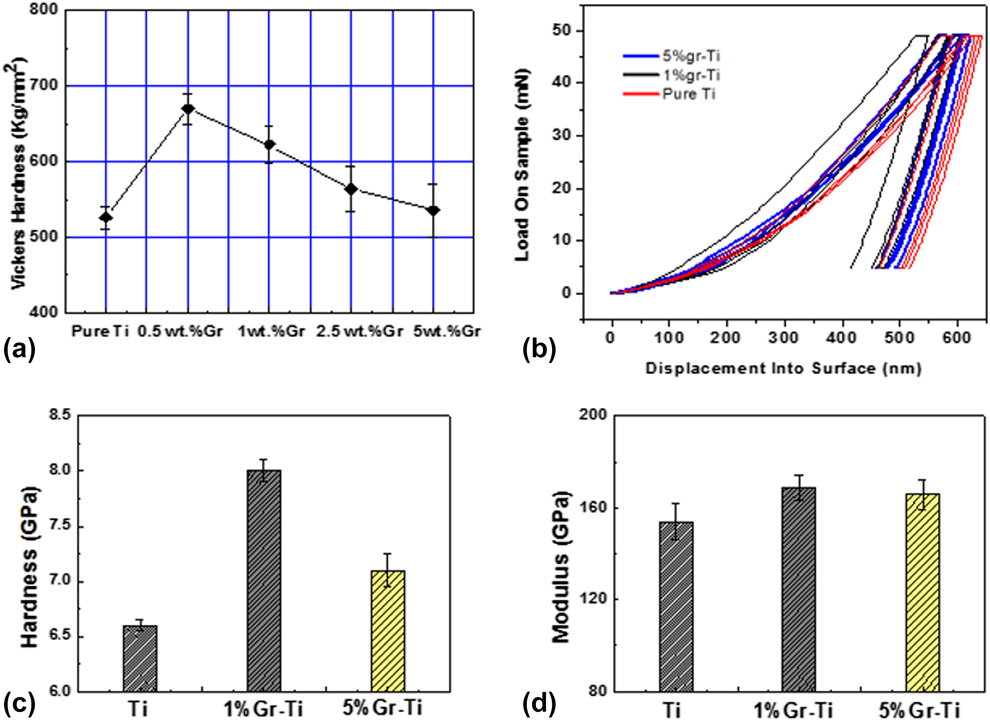
The hardness of the Ti matrix can be significantly improved by introduction of graphene nanofillers. The Vickers hardness testing results of the Ti–Gr nanocomposites and pure Ti are shown in Fig. 10(a). The hardness values of laser-melted 0.5 wt% Ti–Gr, 1 wt% Ti–Gr, 2.5 wt% Ti–Gr, and 5 wt% Ti–Gr are 669 HV, 623 HV, 564 HV, and 535 HV, respectively. The highest hardness of the Ti–Gr nanocomposite is more than 1.27 times higher than that of the pure Ti (526 HV). During the deformation, graphene sheets could carry the load transferred from matrix and pin the dislocation movement, which greatly reinforced the metal matrix.
(a) The Vickers hardness of laser-melted Ti and Ti–Gr composites, nano-mechanical properties of laser-melted Ti–Gr nanocomposites and Ti, (b) load–penetration depth curves, (c) hardness, and (d) modulus.
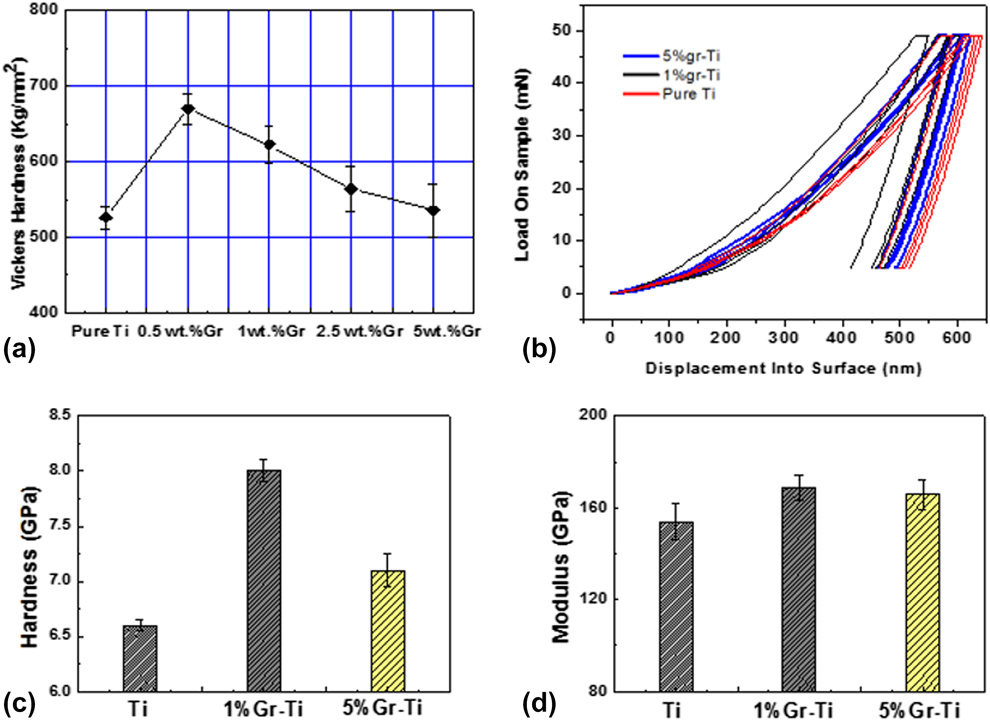
Nano-indentation was also carried out to characterize mechanical properties of the pure Ti, 1 wt%, and 5 wt% Ti–Gr composites. Figure 10(b) shows the load-penetration depth curves at the load of 50 mN during the nano-indentation testing. Under the same load, the Ti sample has the highest penetration depth from the surface, while the 1 wt% Ti–Gr sample has the lowest penetration depth. This result is consistent with the Vickers hardness tests, which indicates that due to the reinforcement of graphene sheets, the strength and hardness of the laser-melted Ti–Gr nanocomposites are higher than those of the laser-melted Ti. This can also be confirmed according to Fig. 10(c) showing a substantial improvement in hardness of the laser-melted Ti–Gr nanocomposites. The laser-melted Ti has an average hardness of 6.6 GPa, while the laser-melted Ti–Gr nanocomposites show an average hardness of 7.1 GPa (5 wt% Ti–Gr) and 8 GPa (1 wt% Ti–Gr), respectively. As shown in Fig. 10(d), the average modulus of the laser-melted Ti is about 153.9 GPa, and the average modulus of the laser-melted Ti–Gr is 165.7 GPa (5 wt% Ti–Gr) and 168.8 GPa (1 wt% Ti–Gr), respectively, indicating the modulus improvement is not as significant as that in hardness.
The Vickers hardness and nano-indentation testing results of the Ti–Gr nanocomposites with different graphene weight ratios show great improvements over the pure Ti, which could be mainly attributed to the robust microstructures and excellent mechanical properties of graphene and the in situ generated TiC. Several models can be used to estimate the property enhancement of the Ti–Gr composites. First, the mixing law can be implemented to calculate the theoretical modulus of a composite material as follows:
 $${E_{\rm{c}}} = {E_{\rm{m}}}{V_{\rm{m}}} + {E_{\rm{g}}}{V_{\rm{g}}}\quad ,$$
where E c, E m, and E g are the modulus of the Ti–Gr nanocomposites, Ti matrix, and graphene (1.0 TPa) [Reference Rafiee, Rafiee, Wang, Song, Yu and Koratkar37], respectively. The V m and V g are the volume ratios of Ti matrix and graphene. The measured modulus of the laser-melted Ti (153.9 GPa) is used as E m for calculation. According to the equation, the theoretical E c is 306 GPa.
Second, the strengthening mechanism of the Ti–Gr nanocomposites can explained by the modified Halpin–Tsai model [Reference Zhao, Zhang, Chen and Lu38], a mathematical model for the prediction of elastic modulus of composite materials based on the geometry and orientation of the filler, as well as the elastic properties of the filler and matrix. For simplification, the graphene sheets are treated as circle plates in calculation. According to the modified Halpin–Tsai model [Reference Hu, Tong, Lin, Nian, Shao, Hu, Saei, Jin and Cheng21] and the data given by the graphene supplier, the average radius r g is 50 μm and the average thickness h is 1.75 nm. For the 5 wt% Ti–Gr nanocomposites, the V g equals to ∼0.18. Substituting these parameters into Eq. (1), the theoretical E c is 247.9 GPa.
The calculated modulus values according to the two models above are evidently different with each other. The result from the mixing law is much higher than that from the Halpin–Tsai model. This could be resulted by the fact that the Halpin–Tsai model considers the spatial distribution and aspect ratio of reinforcements, which cannot be reflected in the mixing law. By comparing these two calculation models, we can conclude that the spatial distribution and aspect ratio of graphene fillers indeed affect the calculated modulus value. In this respect, we know that the composite modulus is not only determined by the volume fraction of graphene filler but also by the filler’s distribution, aspect ratio, defect level, etc. This explains why our actual measured modulus values of the Ti–Gr nanocomposites are evidently lower than the theoretically calculated results and that of SLGO-reinforced Ti matrix nanocomposites [Reference Hu, Tong, Nian, Xu, Saei, Chen, Chen, Zhang, Guo and Xu31]. This may be caused by the simplified assumptions for the theoretical calculations: the increased defects of graphene, the distribution state of graphene in the Ti matrix, and the intrinsic properties difference between single layer graphene and multilayer graphene. It has been reported that the increased defects of graphene after laser sintering would result in the loss of intrinsic stiffness of the graphene nanoplates (GNPs) [Reference Kim and Macosko39]. Nevertheless, in the Halpin–Tsai model, it is assumed that the graphene sheets are homogenously dispersed in the matrix, which would be too ideal for the real case. Graphene would inevitably be aggregated in somewhat. Moreover, the modulus value of the single layer graphene is used for calculation, instead of an actual measured value for the multilayer graphene that were used in this study. The number of graphene layers plays an important role in the mechanical property performance. This is consistent with the hardness test results of SLGO-reinforced Ti matrix composites [Reference Hu, Tong, Nian, Xu, Saei, Chen, Chen, Zhang, Guo and Xu31]. Seeing from another angle, this also implies that by well-controlling over the powder mixing and laser sintering process or using high-quality single layer graphene, further improvements of the mechanical properties of the Ti–Gr nanocomposites remain viable.
Finally, the in situ generated TiC is a high-quality reinforcement for the composites, which brings several advantages: (i) it can enhance the interface between graphene and titanium; (ii) the in situ generation process prevents introducing of impurities and helps in forming strong binding between the interface of graphene and Ti; (iii) the formation of TiC could help to increase dislocation density around it. This can be confirmed from the IFFT images in Fig. 9. And it was proved by many research works that the dislocation density has significant contribution to MMCs mechanical properties. However, the mechanical property of TiC is not as good as that of graphene, which also explains the difference between the experimental and calculated results.
Compared to the hardness and modulus results of the composites fabricated by the liquid solution method [Reference Hu, Tong, Nian, Xu, Saei, Chen, Chen, Zhang, Guo and Xu31, Reference Hu, Chen, Xu, Ma, Guo, Chen, Nian, Wang and Zhang40], the Ti–Gr composites via ball milling have better mechanical property. It maybe because there is no dispersion agent needed in ball milling process, which could bring impurities into the matrix. Furthermore, a better density can be achieved by compressing the mixture powder. Another reason could be the fast gas flow during processing that results in the quenching effect on the composites.
Conclusions
In this study, the bulk Ti–Gr nanocomposites with millimeter thickness were fabricated by selective laser melting the powder mixture of multilayer graphene platelets and titanium. The nanocomposites with various graphene weight ratios were prepared for comparison. The as-fabricated Ti–Gr nanocomposites contained the following phases: Ti, TiC, and graphene. A uniform dispersion of the graphene sheets in the nanocomposites was achieved after laser processing, and TiC was in situ generated at the interface between graphene and Ti matrix. Compared to the pure Ti counterpart, the hardness of the nanocomposites increased to 120% due to the reinforcements provided by the graphene and the in situ generated TiC. Modulus increases were also observed. Further improvements could be realized by a better control over the powder mixing and laser sintering process. The improved mechanical properties of the Ti–Gr nanocomposite exhibited a great potential of this material to be massively applied in a lot of fields such as aerospace, defense, and automobile industries.
Experiments
Materials
Raw materials are Ti powders (99.9%, average diameter ∼25 μm, Xi’an Baode Powder Metallurgy Co., Ltd., Xi'an, China) and multilayer graphene nanoplatelets (<5 layers, average diameter ∼50 μm, Nanjing Kefu Nanotech Inc., Nanjing, China), respectively. The titanium powder and graphene platelets were mixed by planetary ball milling (speed 300 r/min, 2 h, stainless steel ball, and diameter: 8 mm, stainless jar). Four Ti–Gr powders with different mixing ratios were prepared: Ti–0.5 wt% Gr, Ti–1 wt% Gr, Ti–2.5 wt% Gr, and Ti–5 wt% Gr. The resulted Gr–Ti powders and pure titanium powders were then utilized in selective laser melting.
Selective laser melting experiments
A SD-MD300 Nd:YAG millisecond pulse laser system (wave length 1064 nm, pulse duration 0.1–20 ms, max frequency 500 Hz, max average power 300 W, and spot diameter 0.2 mm) was used to perform the laser melting process at the frequency of 22 Hz, a pulse duration of 8 ms, a scanning speed of 3 mm/s, and a laser power of 150 W. The parameters were optimized by the previous study [Reference Hu, Tong, Nian, Xu, Saei, Chen, Chen, Zhang, Guo and Xu31] to ensure that the titanium powder can form a molten pool within the laser projected area. The samples were loaded on a numerical controlled x–y stage so that the laser spot can be moved to any area of the sample surface. An argon gas (Ar purity ≥99.99%, flow rate 20 L/min) was utilized to protect the samples from oxidation and nitrification during laser melting process.
Microstructure characterization
A Rigaku Ultima IV Multipurpose XRD system (Rigaku Beijing Corporation, Beijing, China) was utilized to characterize the nanocomposites using a Cu Kα source. A Hitachi S-4700 and Hitachi SU5000 Field emission SEM (Hitachi, Ltd., Tokyo, Japan) were used to study the surface morphology and cross-sectional microstructure. The Raman spectra were obtained by a HORIBA LabRAM HR800 Raman spectrometer (HORIBA Jobin Yvon, Piscataway, New Jersey). A 632.8 nm He–Ne laser focused by an Olympus 50× objective (MPLN50×, Olympus America, Center Valley, Pennsylvania, USA) was used as an excitation source. The instrument had a spectral uncertainty of 0.27 cm−1 and a peak fitting uncertainty of 0.02–0.07 cm−1. A thermo Scientific ESCALAB 250Xi XPS (Thermo Fisher Scientific, Waltham, MA, USA) was used to perform the XPS tests. A TenuPol-5 twin-jet electropolishing system (Struers Inc., Cleveland, OH, USA) was used to prepare TEM samples via twin-jet electropolishing methods. TEM images were obtained by the FEI Tecnai G-20 system (Field Electron and Ion Company, Hillsboro, Oregon, USA), which operated at 200 keV.
Mechanical property testing
The mechanical properties of the prepared Ti–Gr samples were measured by Agilent Nano indenter G200 (Keysight Technologies, Santa Rosa, CA, USA). The microhardness of samples was measured by HXD-1000TM/LCD (Shanghai optical instrument factory, Shanghai, China) microhardness instrument with 300 g load and 10 s holding time. Before the microhardness measurements, the sample surfaces were polished with a metallographic polishing machine by removing a very thin layer material. All the tests were carried out at room temperature.
Acknowledgments
The authors would like to thank Testing and Analysis Center of Soochow University for the XPS results. The authors also acknowledge the support from Arizona State University and National Science Foundation (CMMI-1826439).