Surgical site infections (SSIs) are among the most common healthcare-associated infections 1 – Reference Magill, Hellinger and Cohen 3 ; they represent an important cause of morbidity following surgeries.Reference Sandy-Hodgetts, Leslie, Lewin, Hendrie and Carville 4 , Reference de Lissovoy, Fraeman, Hutchins, Murphy, Song and Vaughn 5 SSIs result in increased use of antimicrobials,Reference Dohmen 6 increased lengths of hospital stay,Reference Leaper, van Goor and Reilly 7 , Reference Kirkland, Briggs, Trivette, Wilkinson and Sexton 8 and increased rates of mortality.Reference Kirkland, Briggs, Trivette, Wilkinson and Sexton 8 , Reference Astagneau, Rioux, Golliot and Brucker 9 They are also a leading cause of hospital readmission,Reference Kirkland, Briggs, Trivette, Wilkinson and Sexton 8 , Reference Ramkumar, Chu and Harris 10 , Reference Whitehouse, Friedman, Kirkland, Richardson and Sexton 11 and they contribute to excess healthcare costs.Reference Sandy-Hodgetts, Leslie, Lewin, Hendrie and Carville 4 , Reference de Lissovoy, Fraeman, Hutchins, Murphy, Song and Vaughn 5 , Reference Leaper, van Goor and Reilly 7 , Reference Whitehouse, Friedman, Kirkland, Richardson and Sexton 11
Reports of SSI rates typically vary from 2% to 5%,Reference Anderson, Podgorny and Berrios-Torres 2 but lower and higher rates have been reported.Reference Sandy-Hodgetts, Leslie, Lewin, Hendrie and Carville 4 , Reference de Lissovoy, Fraeman, Hutchins, Murphy, Song and Vaughn 5 SSI rates also vary across different procedures. Surgeries following trauma and some procedures (eg, colorectal surgeries) are much more likely to generate an SSI. 1 – Reference Magill, Hellinger and Cohen 3 , Reference Durkin, Dicks and Baker 12 At the patient level, risk factors for SSIs include smoking,Reference Beitsch and Balch 13 , Reference Harrop, Styliaras, Ooi, Radcliff, Vaccaro and Wu 14 diabetes,Reference Harrop, Styliaras, Ooi, Radcliff, Vaccaro and Wu 14 , Reference Lilienfeld, Vlahov, Tenney and McLaughlin 15 obesity,Reference Nystrom, Jonstam, Hojer and Ling 16 increasing age,Reference Harrop, Styliaras, Ooi, Radcliff, Vaccaro and Wu 14 , Reference Mishriki, Law and Jeffery 17 and poor nutrition.Reference Casey, Flinn, Yao, Fahey, Pawlowski and Bergan 18 In addition to individual and procedure-related risk factors for SSIs, environmental-level risk factors may also exist. At the institutional level, the volume of proceduresReference Meyer, Weitzel-Kage, Sohr and Gastmeier 19 , Reference Muilwijk, van den Hof and Wille 20 or institution sizeReference Hughes, Culver and White 21 may increase the SSI risk, and other environmental-level risk factors may also exist. For example, some studies have demonstrated an increased incidence of SSIs for surgeries performed during summer months.Reference Durkin, Dicks and Baker 12 , Reference Durkin, Dicks and Baker 22 – Reference Sagi, Cooper, Donahue, Marberry and Steverson 24
To date, most reports regarding the seasonality of SSIs are based on investigations in single centers, on specific procedures (eg, spinal surgeries), or in specific geographic regions. Furthermore, these specific investigations did not all use the proper time series methods for analyzing autocorrelated data, and they did not incorporate local weather patterns across large regions to determine how much of SSI seasonality can be explained by weather effects. The first objective of this study was to determine whether and to what extent the incidence of SSIs is seasonal, using a large, population-based, national sample of hospitalizations. The second objective was to determine the extent to which seasonality in the incidence of SSIs can be explained by local weather conditions.
METHODS
Data Extraction
All discharge data were extracted from the Nationwide Inpatient Sample (NIS), the largest all-payer database of hospital discharges in the United States. The database is maintained as part of the Healthcare Cost and Utilization Project (HCUP) by the Agency for Healthcare Research and Quality, and it contains data from a 20% stratified sample of nonfederal acute-care hospitals. Observational studies using deidentified data, such as this one, are deemed exempt by our institutional review board.
We identified every adult hospitalization with a primary diagnosis of SSI from January 1998 to November 2011. For case ascertainment, we used the International Classification of Diseases, Ninth Revision, Clinical Modification (ICD-9-CM) codes 998.51 and 998.59. To estimate a monthly SSI incidence series, we aggregated the number of primary SSI discharges by admission month and year. We applied discharge weights to account for yearly changes in the sampling design, and we applied additional weights to account for changes in the number of days per month.
The NIS does not include unique identifiers to allow the tracking of patients across visits, for example, to determine whether a surgery in one visit resulted in a readmission in a subsequent visit. Thus, we also extracted adult hospitalizations with a primary or secondary procedure likely to be associated with an SSI to estimate a population “at-risk” for SSIs. We used this series to ensure that any findings on the seasonality of SSI were not merely a reflection of a lower surgical volume concurrently or in the month prior. Hospitalizations were identified using Clinical Classification software (CCS) codes developed by HCUP. We included the following codes: 152 (knee arthroplasty), 153 (hip replacement, total and partial), 158 (spinal fusion), 147 (treatment of fracture or dislocation of lower extremity), 78 (colorectal resection), 75 (small bowel resection), 134 (cesarian section), 85 (inguinal and femoral hernia repair), 86 (another hernia repair), and 87 (exploratory laparotomy). To estimate this monthly surgery incidence series (ie, the at-risk series), we aggregated cases by admission month and year and applied discharge and days-per-month weights. Finally, we calculated the number of patients at risk for an SSI in a given month by taking an average of the number surgeries in that month and the number of surgeries in the prior month.
Time Series Analysis
The adjusted SSI incidence series was fit with a linear time trend and a collection of fixed effects (ie, indicator variables) that represent monthly mean deviations from the overall trend. The cyclic nature of the series was captured by the monthly fixed effects. We also explored adding a covariate to this model for the log of the at-risk series. To account for temporal correlation in the residuals, we investigated autoregressive structures of orders 1 through 4. We selected the order for each series based on the Bayesian information criterion (BIC) and upon inspection of the autocorrelation function and the partial autocorrelation function plots. In the regression equation, the coefficient for the peak month can be interpreted as the “average amplitude of seasonality” adjusted for the other covariates. Similar analyses were performed on the log-transformed series, which facilitated a percentage interpretation of model coefficients. An overall test for seasonality was computed using a likelihood ratio test on the 11 monthly fixed effects. All analyses were performed using R 3.1.2 and SAS 9.4 (SAS Institute, Cary, NC).
Subgroup Time Series Analysis
We performed subgroup analyses stratified by region (north, south, east, and west), gender, age (grouped by decade), institutional teaching status (teaching/nonteaching), and institutional location (urban/rural). For each subgroup, we calculated the average amplitude of seasonality and the annual trend on the log-transformed count series to allow for easy comparison. The autoregressive structures for all subgroups were individually selected based on BIC.
Weather Data
Hospitals in the study were geolocated using the Google Maps Geocoding application program interface and the American Hospital Association address.Reference Kahle and Wickham 25 Weather data were obtained from unedited local climatological data (1998–2004) and quality-controlled local climatological data (2005–2011). Both datasets were reported by the National Climatic Data Center of the National Oceanic and Atmospheric Administration.
Using each hospital’s longitude and latitude, we identified all weather stations within 100 km of the hospital, then we extracted the following monthly summary statistics from these stations: average temperature, minimum temperature, maximum temperature, total precipitation, average dew point, average wet bulb temperature, average heating degree days, average cooling degree days, resultant wind speed, and total monthly precipitation. The summary statistics for hospitals with multiple nearby stations were averaged across stations, whereas the summary statistics for hospitals with no nearby stations (1.9%) were imputed using k nearest neighbors (k=5) and the caret package in R.Reference Kuhn 26
Logistic Regression Models
We used logistic regression to estimate the odds of a hospital discharge having a primary diagnosis of SSI using 2 different models. Our first model is a “demographics-only model” that controls for the following patient-level covariates: age (grouped by decade), sex, primary payer, length of stay, Elixhauser comorbidity index (29 categories),Reference A. Elixhauser and Harris 27 admission month, and admission year. In addition, at the hospital level, our first model controls for region (ie, northeast, midwest, west, and south), longitude, and latitude. Our second model is a “weather model” that controls for the same covariates as the demographics model, and it adds the average monthly temperature (in 2.8°C [5°F] steps from <4.4°C [<40°F] to >32.2°C [>90°F]). The other weather covariates were very highly correlated with average monthly temperature in the model and were not included.
RESULTS
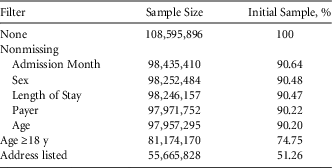
The NIS contains 108,595,896 hospitalizations from 4,532 hospitals over the course of our study (0.368% with a primary SSI). We observed 9,474,937 discharges with surgeries that could potentially lead to an SSI. In the time series models, we excluded 65,485 SSIs and 850,510 surgeries due to missing admission month or discharge weight. For our logistic regression models, the sample size was 55,665,828 (2,512 unique hospitals). Exclusion criteria are summarized in Table 1.
Sample Size

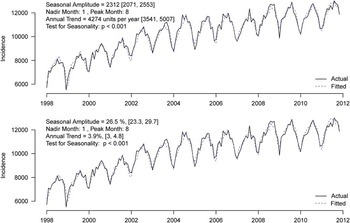
In Figure 1, we show the monthly incidence of SSI hospitalizations. The nadir month for SSIs was January and the peak month was August. After controlling for a linear time trend, the average seasonal increase (between January and August) was 2,312 infections (95% CI, 2,071–2,553). This corresponds to an increase of 26.5% (95% CI, 23.3%–29.7%). The overall test for seasonality was statistically significant (P<.001). Adjusting for seasonality, the number of SSIs increased by 4,274 cases per year (95% CI, 3,541–5,007), which corresponds to an increase of 3.9% per year (95% CI, 3.0%–4.8%). After adding the logged monthly series of SSI-prone surgeries into the model as a covariate, we first noted that the seasonality lessened slightly to 23.56% (95% CI, 20.6%–26.6%), and the trend became less prominent at 0.16% growth per year (95% CI, −0.52% to 0.85%). Using this model, we then estimated that a 25% reduction in the average number of at-risk surgeries in the months of August and July was associated with a decrease of ~1,690 SSI cases for the year (a decrease of 20.6% from the observed SSI rate).
Hospitalizations with a primary or a secondary diagnosis of a surgical-site infection: absolute-scale model (top) and relative-scale (log-transformed) model (bottom). We controlled for the error structure in each model using an AR(2) error structure.

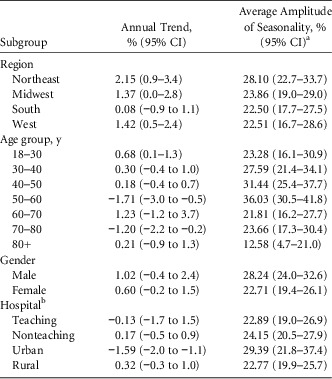
The annual trend and the average increase in the peak month for each subgroup considered are presented in Table 2. Seasonality and incidence were similar across all regions, age groups, genders, and hospital teaching categories. Seasonality was greatest among patients aged in their 40s and 50s. In addition, the seasonality of SSIs was very prominent for both teaching and nonteaching hospitals, and there was no significant difference between the 2 groups of hospitals: average amplitude of seasonality was 22.89% (95% CI, 19.0%–26.9%) for teaching hospitals and 24.15% (95% CI, 20.5%–27.9%) for nonteaching hospitals.
Subgroup Analysis of Surgical-Site Infection (SSI) Trends and Seasonality, Controlling for the Number of Surgeries in the Month of the SSI Admission and the Prior Month Within Each Subgroup

NOTE, CI, confidence interval.
a Average amplitude of seasonality is the percentage increase in SSI between the peak and nadir month.
b Not mutually exclusive categories in the Nationwide Inpatient Sample (NIS) dataset.
Weather Models
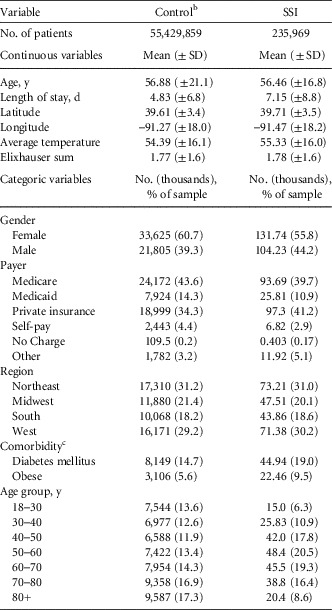
Descriptive statistics for our weather model are presented in Table 3. SSI cases were generally similar to the control group in terms of their mean age, sum of Elixhauser comorbidities, latitude, longitude, and region. However, cases had a higher mean length of stay (7.15 days vs 4.83 days), and they were admitted during a month with a slightly higher mean temperature than the control group (12.96°C [55.33°F] vs 12.43°C [54.39°F]). Additionally, although the mean age of cases was similar to that of the controls (56.88 years vs 56.46 years), the vast majority of cases were middle aged, while admissions for older ages were much more likely to be controls. SSI patients had higher rates of diabetes (19.0% vs 14.7%) and obesity (9.5% vs 5.6%) than the controls.
Descriptive Statistics for Variables of Interest in the Surgical-Site Infection (SSI) and Control GroupsFootnote a

a Mean and standard deviation for continuous variables (top) and number and percentage of patients for categorical variables (bottom).
b All variables were statistically significantly different between the SSI and control groups (all P<.001).
c There are 29 Elixhauser comorbidities, but only diabetes mellitus and obese are presented in this table.
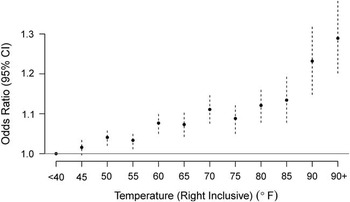
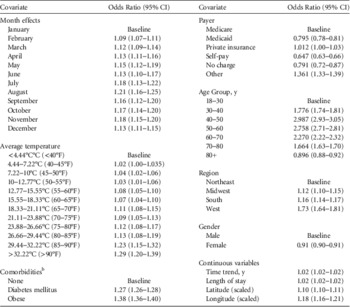
Results from the weather logistic regression model are presented in Table 4. Patients aged in their 40s were 199% more likely to be an SSI admission (95% CI, 193%–205%) than the baseline group of 18- to 30-year-old patients. However, admissions for older patients (80+) were 10.4% less likely to be SSI related (95% CI, 8.1%–12.5%). The weather model also indicated a significant time trend over the course of the study: the odds of an SSI admission grew by 2% per year (95% CI, 1.9%–2.1%). Higher rates of SSI admission were associated with diabetes, which had 26.9% higher odds (95% CI, 25.5%–28.3%), and obesity, which had 38.2% higher odds (95% CI, 36.3%–40.3%). Finally, the effect of temperature on the odds of SSI admission is presented in Figure 2. The odds of a primary SSI admission increase by roughly 2.1% per 2.8°C [5°F] increase in the average monthly temperature; all else held constant. Specifically, the highest temperature group, >32.2°C [>90°F], was associated with an increase in the odds of an SSI admission of 28.9% (95% CI, 20.2%–38.3%) when compared to temperatures <4.4°C [<40°F].
The effect of monthly average regional temperature on the odds of surgical-site infection primary admissions.

Logistic Regression Model ResultsFootnote a

a The outcome variable is SSI admission. Estimated odds ratios and associated confidence intervals are presented.
b All 29 Elixhauser comorbidities are included in the model as indicator variables, but only those for diabetes mellitus and obese are presented here.
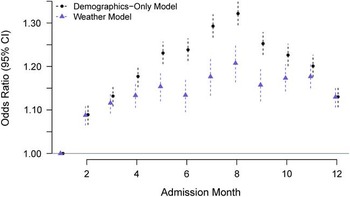
In the demographics-only model, the odds of an SSI discharge increased by 32.1% from January to August (95% CI, 29.5%–34.8%). However, when we controlled for the effects of temperature and demographics, the odds of an SSI discharge are only 20.7% higher in August (95% CI, 16.4%–25.3%) (Figure 3). By adding average monthly temperature to the model, we were able to explain approximately 35% of the change in the odds of an SSI discharge due to seasonality.
Monthly odds ratios for a primary surgical-site infection for both our demographics-only model and our weather model. Weather explains a portion of the seasonality in primary SSI admissions.

DISCUSSION
Our results show that SSIs are seasonal, with 26.5% more SSI-related hospital discharges in the peak month of August than in the nadir month of January. SSIs are seasonal for men, women, all age groups, and all geographic regions. By incorporating weather into our analysis, we have demonstrated that the average temperature in the month of a hospitalization is an important risk factor for SSIs and that higher temperatures are associated with higher odds of SSI. We observed a slight annual increase in the number of SSIs, though this became insignificant after controlling for the volume of procedures.
The incidence of many infections is seasonal.Reference Fisman 28 Respiratory infections peak during winter months and tick- and mosquito-borne infections peak during the summer. Less attention has been focused on the seasonality of healthcare-associated infections. However, reports show evidence of seasonality in the incidence of Clostridium difficile infections, with cases peaking during winter and spring,Reference Polgreen, Yang, Bohnett and Cavanaugh 29 – Reference Brown, Daneman, Arora, Moineddin and Fisman 31 and in the incidence of catheter-related bloodstream infections peaking during summer monthsReference Schwab, Gastmeier and Meyer 32 , Reference Al-Hasan, Lahr, Eckel-Passow and Baddour 33 along with urinary tract infectionsReference Anderson 34 , Reference Simmering, Tang, Cavanaugh, Polgreen and Polgreen 35 and cellulitis.Reference Peterson, Polgreen, Cavanaugh and Polgreen 36 A few reports of seasonal SSIs exist, but most of these were either in single centers over short time periods or were focused on a specific geographic region, and few incorporated weather data into their analysis. Nevertheless, previous findings are similar to ours. Kane et alReference Kane, Chen, Post, Radcliff, Orozco and Ong 23 found the highest incidence of SSIs following total joint arthroplasties in August, with the majority occurring during July–September. Both Durkin et alReference Durkin, Dicks and Baker 22 and Gruskay et alReference Gruskay, Smith and Kepler 37 found an increased rate of infection after elective spine surgery during the summer months. Assessing a more generalized group of patients who underwent various procedures, Durkin et alReference Durkin, Dicks and Baker 12 also reported a seasonal effect on SSI with summer months demonstrating higher SSI rates. Unlike prior studies, we included a large population: 20% of all hospital discharges over a long period of time and across different geographic regions. In addition to establishing statistical significance in the seasonality of primary admissions for SSI, our results also demonstrate the potential clinical significance of this seasonality. For example, in our multivariate model controlling for patient demographics, severity, and hospital location, the increase in odds of an SSI admission during an especially warm August relative to a cold January reaches a peak of 55.6%, double the effect of diabetes (26.9%). Our results also demonstrate the clinical impact of this seasonality. For example, a 25% reduction in surgical cases in the peak months is associated with a >20% reduction in SSIs. Thus, if some elective surgeries are moved from the very warm summer months to other months, we may be able to reduce both infections and healthcare costs.
The reason that SSIs peak in the summer is unclear. However, the incidence of other skin and soft-tissue infections have been reported to be seasonal.Reference Mermel, Machan and Parenteau 38 – Reference Leekha, Diekema and Perencevich 40 Elevated levels of bacteria may be found in certain anatomic locations with higher temperatures.Reference McBride, Duncan and Knox 41 Regardless of the specific mechanism, we believe that the seasonality of SSIs is, in large part, driven by weather conditions. In a logistic regression model of the incidence of SSIs, we explained approximately 35% of the seasonal variation by including average monthly temperature data. By including more granular data regarding the incidence of SSIs and weather, we may be able to explain an even larger amount of the seasonality.
Some reports suggest that surgical complications such as SSI could be due to a “July effect,” explained as staff turnover at teaching institutions.Reference Young, Ranji, Wachter, Lee, Niehaus and Auerbach 42 However, previous authors identified an increase in SSI in patients undergoing spine procedures during the summer months at a regional collection of nonteaching hospitals.Reference Durkin, Dicks and Baker 22 Similarly, we found no significant differences in the amplitude of seasonality of SSIs between teaching and nonteaching institutions. In addition, we added an interaction between hospital teaching status and month to our logistic regression model, and the result was nonsignificant (data not shown.) Thus, the August peak incidence of SSI we report is not likely to be attributable to trainees involved with surgical procedures. Finally, it is possible that the seasonal incidence of SSIs could be due to seasonal variations in surgical volume because most SSIs occur within 30 days of the surgery. However, in our time-series model, we controlled for the number surgeries performed in the current and prior months to adjust for surgical volume as a confounding factor in the seasonality of SSIs, yet the seasonality in the series was still highly significant.
Our results are subject to several limitations. First, our analyses were based on the month of the primary admission for SSI, not the procedure that precipitated the SSI. We cannot link admissions for SSIs to admissions for specific procedures because the NIS data do not provide a unique identifier to link patient visits across hospitalizations. Thus, our analysis considers all SSIs together, and we were unable to determine the SSI seasonality for different procedures. Secondary admissions for SSI are also seasonal (data not shown), and some secondary admissions may have occurred during the surgical admission. Second, we used administrative data, (eg, ICD-9 codes) to identify SSIs, and we were unable to do chart reviews. Our data do not include microbiology or medication-administration data. Comparisons of SSI codes to traditional forms of SSI highlight the limitations of using ICD-9 codes.Reference Stevenson, Khan and Dickman 43 However, the sensitivity and specificity of these codes have been reported as 84.1% and 97.3%, respectively.Reference Goto, Ohl, Schweizer and Perencevich 44 Third, we have only inpatient data, and some SSIs are treated in outpatient settings. Practice patterns for admitting patients with SSIs may differ during summer months (eg, due to vacation schedules). Fourth, we only consider weather data aggregated to a monthly level. Although we have more granular weather data, the NIS dataset only provides monthly data. More granular discharge data would allow us to estimate the contributions of weather patterns to the seasonality of SSIs more precisely. Finally, we found a small increase in SSI cases over time (2% per year) in contrast with reports of falling SSI rates.Reference Baker, Dicks and Durkin 45 , 46 However, we only considered inpatient SSIs making it difficult to compare our findings with other reports.
Despite these limitations, we have demonstrated that the incidence of hospitalizations for SSIs is seasonal and that the seasonality of SSIs can, at least in part, be explained by weather patterns. Our results suggest that further investigation is needed with more granular data including exact surgery dates and specific procedures. Such work will help determine whether shifting the timing of some surgeries away from peak SSI months can help reduce SSIs in patients with specific procedures.
ACKNOWLEDGMENTS
Financial support: L.A.P. received support from the National Heart, Lung and Blood Institute (grant no. K25 HL 122305). P.M.P. received support from the University of Iowa Health Ventures’ Signal Center for Health Innovation.
Potential conflicts of interest: All authors report no conflicts of interest relevant to this article.