Introduction
Local biodiversity depends on the availability of a resource and on the diverse ways species use this resource. Sharing a resource generates food networks and within each trophic level biodiversity is enhanced by behavioural differences that primarily concern the choice of resource. Even in necro-, sapro- and coprophagous species, the resource has subtle differences in maturation and size of particles (Holter, Reference Holter1982, Reference Holter2000). Dung and carcasses have a discontinuous distribution, which makes finding them unpredictable and this leads to many species feeding on the same resource. Above all, this resource is ephemeral, due to microorganism activity and autolysis processes. The important point for most species is to gain access to the food in a way that makes it inaccessible to other species (e.g. small carcasses buried by Nicrophorus beetles: Halffter et al., Reference Halffter, Anduaga and Huerta1982, Reference Halffter, Anduaga and Huerta1983). When the resource cannot be monopolized by a sole species, local coexistence is made easier by differences in trophic processes that reduce interactions between species.
Most dung beetles are attracted by fresh herbivore and omnivore dung, and almost all Scarabaeinae and Geotrupinae species (approximately two thirds of known dung beetles with ca. 5000 and 150 species, respectively) have developed complex nesting behaviours that enhance dung utilization, secure food supply for their offspring and offer them protection (Cambefort, Reference Cambefort, Hanski and Cambefort1991). The ephemeral nature of dung is accentuated in isolated places by a rapid hardening and drying process that makes it unusable in a short time for the great majority of species. The response of Scarabaeinae to these ecological pressures is to relocate a portion of the food as soon as possible (Halffter, Reference Halffter, Zunino, Bellés and Blas1991). The relocation may be horizontal, principally by rolling a ball (rollers), or vertically by burying a certain amount (tunnelers) (Zunino, Reference Zunino, Zunino, Bellés and Blas1991).
Doube (Reference Doube1990, Reference Doube, Hanski and Cambefort1991) proposed no less than seven functional groups to describe the different ways Scarabaeinae beetles use dung. The relocated food may be used either by the same individuals or by the individual's offspring. All these processes favour bisexual cooperation, which improves the efficiency of transport and excavation. Nesting avoids interactions between larvae, but digging a pedotrophic nest requires a huge investment in time and energy from the parents and, as a result, can cause a reduction of female fecundity. The balance between security for resources and energetic cost is underlined by the high thermal requirements of Scarabaeinae (Lobo et al., Reference Lobo, Lumaret and Jay-Robert2002) and Geotrupinae (Mena, Reference Mena2001a,Reference Menab) and the large spectrum of the diet of Geotrupinae (Hanski, Reference Hanski, Hanski and Cambefort1991).
Most of Aphodiinae species (ca. 1850 known species) have a non-nesting behaviour and oviposite inside a mass of dung. They, thus, have lower sensitivity to soil characteristics and less energetic requirements, which permits these beetles to be active under colder conditions, both at high latitude (Hanski, Reference Hanski, Hanski and Cambefort1991) and high elevation (Lumaret & Stiernet, Reference Lumaret, Stiernet, Hanski and Cambefort1991), where soil-diggers (Scarabaeinae and Geotrupinae) are rare or absent. Their dung-dwelling behaviour does not allow food storage, and the achievement of local populations only depends on the presence of dung and the preservation of this resource during all the time required for larval development (Gittings & Giller, Reference Gittings and Giller1999). Consequently, under warm and temperate climates dung-dwellers appear less competitive at first glance than nesting soil-diggers (Doube, Reference Doube1990, Reference Doube, Hanski and Cambefort1991; Krell et al., Reference Krell, Krell-Westerwalbesloh, Weiss, Eggleton and Lisenmair2003; Krell-Westerwalbesloh et al., Reference Krell-Westerwalbesloh, Krell and Lisenmair2004), and their local assemblages show observable phenological differences (Hanski, Reference Hanski, Hanski and Cambefort1991; Wassmer, Reference Wassmer1994; Palmer, Reference Palmer1995; Sowig, Reference Sowig1997). The conditions allowing their populations to develop in ecosystems where soil-diggers are dominant are, thus, questionable. If soil-diggers pre-empt most of the resources, dung-dwellers have no other way to reduce competition than to transfer their activity to other periods of the year when soil-diggers are rare (Hanski & Cambefort, Reference Cambefort, Hanski and Cambefort1991a; Krell-Westerwalbesloh et al., Reference Krell-Westerwalbesloh, Krell and Lisenmair2004). Consequently, the competitiveness of soil-diggers could be indirectly deduced from phenological segregation between and within them and dung-dwellers.
Lobo et al. (Reference Lobo, Lumaret and Jay-Robert2002) showed that locally in southern France the highest species richness of Scarabaeinae was primarily related to high winter temperatures, and they suggested that this parameter might favour species co-existence. Under this hypothesis, thermophilous soil-diggers do not benefit by high spring and summer temperatures but by mild winters, which extend their favourable period of activity. Consequently, in Mediterranean open habitats, the dynamics of dung-dwellers can be markedly affected by the long-lasting activity of competitively superior soil-diggers; and the coexistence of species could be based on a complex seasonal segregation within and between trophic guilds.
The purpose of the present paper is to quantify year-round temporal dynamics of two Mediterranean dung beetles assemblages. The study sites were chosen in two of the 12 faunistic regions for dung beetles in southern France identified by Lumaret (1978–Reference Lumaret1979). These two regions, namely the Garrigue and the Causse, experience very similar climatic and edaphic conditions and differ primarily in mean temperatures, which are ca. 3°C less on the Causse, which is 600 m higher in elevation. Both regions are characterized by a high species diversity (Lumaret & Kirk, Reference Lumaret, Kirk, Hanski and Cambefort1991) and the temperature differences between sites could induce shifts in the activity period within trophic guilds. The comparison between beetle assemblages, thus, offers a tractable study system to determine (i) the phenological dynamics related to the way of using dung and (ii) the nature of the constraints affecting the phenology of each guild.
Materials and methods
Location of sites
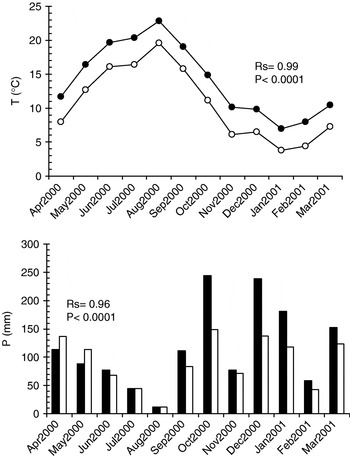
Sampled pastures were located in the Garrigue (low elevation site (LES), 250 m, 43°47′ N, 3°43′ E) and on the Larzac Causse (medium elevation site (MES), 800 m, 43°51′ N, 3°29′ E), 18 km apart. Both sites were on compact limestone with a humid Mediterranean climate with cold winter for LES and a perhumid Mediterranean climate with cold winter for MES. The annual mean temperature was 3.5°C higher at LES than at MES, and monthly temperatures of the two sites were highly correlated (maximum in August, minimum in January; fig. 1). The difference of mean annual temperatures between sites was a rough estimate of difference between two consecutive monthly temperatures (2.8 and 2.9 for LES and MES, respectively). Annual rainfall was higher at LES (difference ≈300 mm) and monthly precipitations in the two sites were highly correlated (maximum in October, minimum in August; fig. 1). Both sites were affected by one month of summer drought in August (sensuBagnouls & Gaussen, Reference Bagnouls and Gaussen1953).
Monthly temperatures and precipitations at the two sampled sites. LES, low elevation site (Garrigue); MES, medium elevation site (Causse); Rs, Spearman rank correlation between LES and MES data sets (–●–, LES (14.2°C mean); –○–, MES (10.7°C mean); ■, LES (1396.8 mm cumul.); □, MES (1098.3 mm cumul).

Sampling design
LES was sampled monthly from January 2000 to June 2001; MES was sampled monthly from April 2000 to June 2001. Four baited pitfall traps spaced 10 m apart were used in each site (2 ha meadows). In January 2000, one trap was destroyed by wild boars; and, in June 2000, five traps were used at LES. Pitfall traps remained at the same location throughout the sampling period. The pitfall design was the CSR model described by Veiga et al. (Reference Veiga, Lobo and Martín-Piera1989) and Lobo et al. (Reference Lobo, Martín-Piera and Veiga1988). Each trap consisted of a plastic basin 210 mm in diameter buried to its rim in the soil, containing a water-formalin-liquid soap mixture. Fresh cattle dung (800 g) was supported on a wire grid at the top of a bucket. Lobo et al. (Reference Lobo, Lumaret and Jay-Robert1998) demonstrated that, at both regional and local scales, the use of four pitfall traps allowed collection of most of the species present at a site. Cattle dung was preferred to sheep dung (cattle and sheep are the two dominant domestic ungulates in the studied area) for practical reasons (easier to collect and to store) and because Dormont et al. (Reference Dormont, Epinat and Lumaret2004) and Errouissi et al. (Reference Errouissi, Haloti, Jay-Robert, Janati-Idrissi and Lumaret2004) showed that the use of cattle dung improves the efficiency of baited traps under Mediterranean climatic conditions (more water content than in sheep pellets). The content of traps was collected after one week, and fresh dung baits were deposited three weeks later for a new sampling period. All specimens were identified to species at the laboratory (Nomenclature: http://www.faunaeur.org/). The beetles collected during each trapping period in a site were pooled and statistically treated as a single sample (i.e. assemblage).
Data analysis
Faunistic data-sets consisted of a matrix of 46 species from 18 monthly samples for LES and a matrix of 43 species from 15 monthly samples for MES. Species abundance data (average per trap) were log transformed and correspondence analysis (CA) was used to analyse the temporal distribution of species. CA and derived statistics allowed us to characterize the temporal activity of adult beetles (season, length, etc.) and to analyse co-occurrence patterns. This could not be done with null model analyses focusing only on coexistence studies (Lomolino, Reference Lomolino2000).
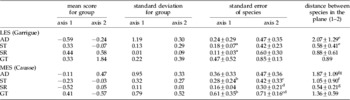
The distribution of species among ecological groups (Aphodiinae dwellers (AD), Geotrupinae tunnelers (GT), Scarabaeinae tunnelers (ST), Scarabaeinae rollers (SR)) was used afterwards to characterize the temporal activity of each group. Four derived statistics were obtained from the results of CA:
(i) The mean score, for each ecological group, for the first two axes 1 and 2 of CA, respectively:
(1)with ni=abundance of species i; xi=score of the species i on the corresponding axis; n=total abundance of species belonging to the same ecological group. The use of weighted average is in accordance with the ‘invariance principle’ inherent in CA; the resulting score is what the ecological group would have if inserted in the analysis in a passive fashion as the sum of its species abundance.
(ii) The standard deviation of the scores for each ecological group (dung-dwellers (AD); soil-diggers (GT, ST and SR)) along axes 1 and 2, respectively:
(2)with ni=abundance of the species i; n=total abundance of species belonging to the same ecological group; xi=score of the species i on the corresponding axis; X=mean score of the ecological group (equation 1). The standard deviation is an estimate of the ecological tolerance of each ecological group (Chessel et al., Reference Chessel, Lebreton and Prodon1982).(iii) Along axes 1 and 2, respectively, the distance between species inside the same ecological group and the distance between species belonging to different groups were estimates of the ecological differences between species.
(iv) The standard error of the scores for each species along axes 1 and 2, respectively:
(3)with ni=abundance of the species in the sample i; n=total abundance of the species; xi=coordinate of the sample i; x=coordinate of the species. The standard error was an estimate of the ecological range occupied by the species (Chessel et al., Reference Chessel, Lebreton and Prodon1982).



Comparisons between functions of scores (distances between species, standard error of species) were done by Mann-Whitney non-parametric test. All statistical analyses were performed with Statistica 6 (Stat Soft, 2001).
Results
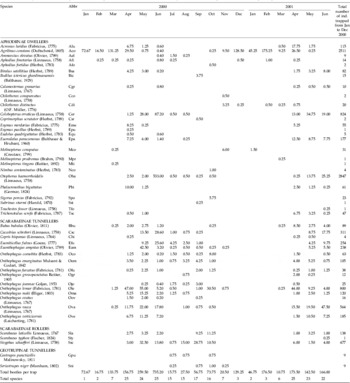
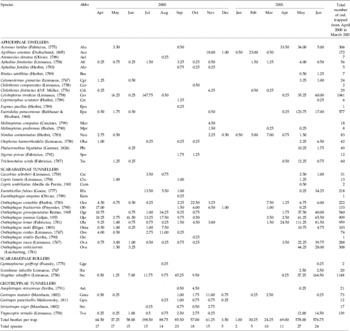
At the Low Elevation Site (LES), 10,319 beetles were trapped (46 species): 26 Aphodiinae dung-dwellers and 20 soil-diggers: 15 Scarabaeinae tunnellers, 3 Scarabaeinae rollers and 2 Geotrupinae tunnellers (table 1). At the Medium Elevation Site (MES), 7737 beetles were trapped (43 species): 20 Aphodiinae dung-dwellers and 23 soil-diggers: 15 Scarabaeinae tunnellers, 3 Scarabaeinae rollers and 5 Geotrupinae tunnellers (table 2).
Monthly variation of dung beetle assemblages at the Low Elevation Site (January 2000 to June 2001 period); mean value per trap.

Monthly variation of dung beetle assemblages at the Medium Elevation Site (April 2000 to June 2001 period); mean value per trap.

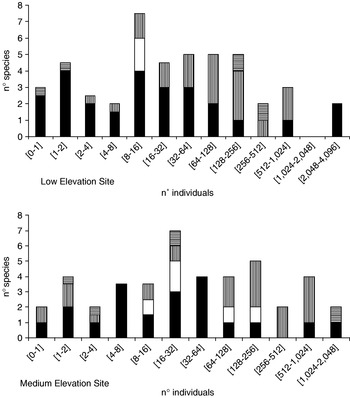
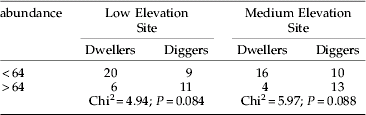
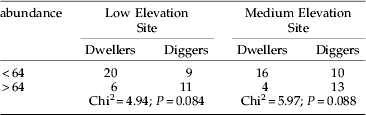
At both sites, the diversity of dung-dwellers and soil-diggers (both tunnellers and rollers) were of the same order (26 vs. 20 for LES; 20 vs. 23 for MES, respectively), and the rarity was slightly higher for dung-dwellers than for soil-diggers (fig. 2; table 3). We considered rare a species with no more than 64 individuals trapped during the study (approximately one specimen per trap on average). All Aphodiinae species sampled at MES were observed at LES and all Geotrupinae sampled at LES were observed at MES. Four Scarabaeinae tunnellers and one roller were sampled at each site exclusively.
Distribution of species abundance in ecological groups designed with the Preston method (Preston, Reference Preston1948, Reference Preston1962; Lobo & Favila, Reference Lobo and Favila1999) in low elevation (Garrigue) and medium elevation sites (Causse) ( , Scarabaeinae rollers;
 , Scarabaeinae tunnellers; □, Geotrupinae tunnellers; ■, Aphodiinae dwellers).

Distribution of rare (<64 specimens) and abundant (>64 specimens) species according to ecological groups at both sites (64 is the inter-class limit, see fig. 2, approximating one specimen per trap).
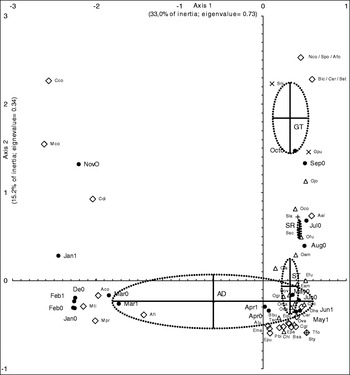
At LES, the mean number of beetles per trap was never below ten all through the sampling period, and the species number was above ten during the April–October period (table 1). Species number was significantly correlated with temperature (r Spearman=0.70; P=0.001), without correlation with precipitations (r Spearman=0.13; P=0.61). Axes (1–2) of CA gathered 48% of total inertia and axis 1 represented twice more inertia (33.0%) than axis 2 (15.2%; fig. 3). Two main periods appeared: December to Marsh and April to August. The first period was characterized by low diversity and the abundance of the dung-dweller Agrilinus constans. The second period corresponded to the activity of most species (especially Scarabaeinae). During the intermediate period from September to November, the assemblages were shifted in the upper part of the plane (1–2) and different Aphodiinae species were noticed in each of these months.
Plot of species sampled at LES on axes 1–2 of correspondence analysis. For each ecological group (Aphodiinae dwellers (AD), Scarabaeinae tunnellers (ST), Scarabaeinae rollers (SR) and Geotrupinae tunnellers (GT)) the barycentre and the standard deviation along axes are represented by an ellipse (the barycentre is the centre of the ellipse, the standard deviation for axis 1 is the axis of the ellipse that is parallel to axis 1, the SD for axis 2 is the axis of the ellipse parallel to axis 2). See table 1 for species name abbreviations (◊, Aphodiinae dwellers (AD); △, Scarabaeinae tunnellers (ST); +, Scarabaeinae rollers (SR); ×, Geotrupinae tunnellers (GT); ●, Month/Year).

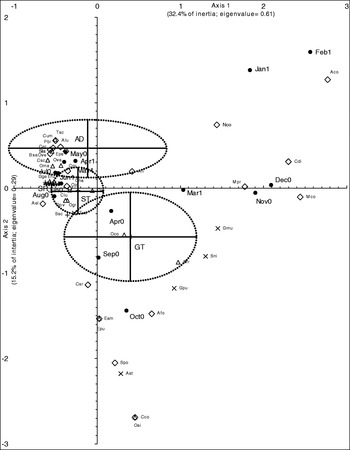
At MES, the number of species was under ten during the December–February period and the mean number of beetles trapped per trap was less than five in December and January (3.5 and 1, respectively; table 2). Species number was significantly correlated with temperature (r Spearman=0.56; P=0.03), without correlation with precipitations (r Spearman=0.03; P=0.91). Only one homogeneous faunistic period was underlined by CA (April–August period; fig. 4) with a good replication from one year to the next. During this period, the species number ranged between 11 and 27, with always more than 37 beetles per trap on average. Ten out of 15 Scarabaeinae tunnellers presented their highest abundance during this period. Then, from September to Marsh, several assemblages with few different species (mainly Aphodiinae and Geotrupinae) followed one another.
Plot of species sampled at MES on axes 1–2 of correspondence analysis. For each ecological group (Aphodiinae dwellers (AD), Scarabaeinae tunnellers (ST), Scarabaeinae rollers (SR), Geotrupinae tunnellers (GT)) the barycentre and the standard deviation along axes are represented by an ellipse (the barycentre is the centre of the ellipse, the standard deviation for axis 1 is the axis of the ellipse that is parallel to axis 1, the SD for axis 2 is the axis of the ellipse parallel to axis 2). See table 2 for species name abbreviations (◊, Aphodiinae dwellers (AD); △, Scarabaeinae tunnellers (ST); +, Scarabaeinae rollers (SR); ×, Geotrupinae tunnellers (GT); ●, Month/Year).

Dwellers (AD) were active nearly all year round with some differences between sites (later at MES; tables 1 and 2; figs 3 and 4). Consequently, their whole range of activity (estimated by the standard deviation of the group; table 4) was the highest compared with other beetles. At LES, the optimal activity period of Aphodiids extended from late winter to early summer, with their highest diversity from April to June. The species turnover was maximal from August to December (four species per month, 15 species in total appeared and disappeared during this period) and winter assemblages consisted almost exclusively of Agrilinus constans. At MES, the optimal activity period of Aphodiids was short (May–June). Summer was still unfavourable, except for Colobopterus erraticus, which was very abundant in July. Autumn was characterized by a high species turnover (4.8 species per month, 16 species sampled in total from August to December), and winter represented a more constraining season than at lower site. Few beetles were active in December and January (⩽1.5 insects per trap) and Agrilinus constans never reached numbers observed in the Garrigue.
Soil-diggers showed shorter periods of activity than dung-dwellers. Scarabaeinae tunnellers were mainly active in spring (later at MES), Scarabaeinae rollers in summer (with the shortest period of activity among guilds) and Geotrupinae tunnellers in early autumn. At both sites, the highest population density of the three most abundant species (54% and 39% of trapped beetles at LES and MES, respectively) was observed in May or June. In the Garrigue site (LES), more than 390 specimens (≥10 species) were sampled in May and June, but no captures were made in winter (December–February). In the Causse site (MES), the situation was similar; both diversity and abundance were high during the period May–July and in September (9–14 species; up to 300 beetles trap−1), and no captures were made in the January–February period.
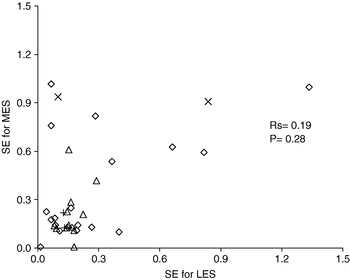
Unlike values of standard deviations, which are an estimate of the ecological tolerance of each ecological group, the standard error (SE) of species belonging to the different groups did not show any noteworthy difference, indicating that species from different groups had roughly similar lengths of activity (table 4). Only for MES, did the SE (which is an estimate of the ecological range occupied by the species) for Geotrupinae appear slightly higher than that for Scarabaeinae. No significant difference appeared between SE of species calculated along axis 1 at LES and MES, either for dung-dwellers (Wilcoxon-Mann-Whitney test=192, P=0.13) or for soil-diggers (Wilcoxon-Mann-Whitney test=179, P=0.21). No significant correlation appeared between SE measured at each site and the 35 common species; and, among these species, none was characterized by a high SE value at LES and a low SE value at MES (fig. 5). However, five species showed higher SE values at MES: Aphodius foetidus, Melinopterus prodromus and Nimbus contaminatus, which were very rare in the Garrigue (only active during one month and less than one specimen per trap); Onthophagus coenobita and Geotrupes puncticollis, which were regularly trapped in the Garrigue and did show an enlarged period of activity on the Causse.
Correlation between standard errors (SE) along axis 1 calculated at LES and MES for species sampled in both sites. Rs, Spearman rank correlation between LES and MES data sets (◊, Aphodiinae dwellers; △, Scarabaeinae tunnellers; +, Scarabaeinae rollers; ×, Geotrupinae tunnellers).

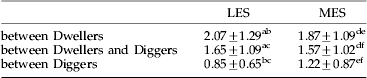
According to their ecological group, the estimated distances between species showed contrasting values. This particularly concerned Aphodiinae dung-dwellers, with high distance values in the CA plane (1–2), which were opposed to soil-diggers species (both Scarabaeinae and Geotrupinae), considered as a whole (tables 4 and 5). The distance values between dung-dweller species were higher for Garrigue site (LES) than for Causse site (MES) (Wilcoxon-Mann-Whitney test=27,062; P=0.019), but no difference was significant for soil-diggers of both sites (Wilcoxon-Mann-Whitney test=4966; P=0.26). The distances values between species at both sites were positively correlated (n=390, Rs=0.55, P<0.0001 for dung-dwellers; n=105, Rs=0.43, P<0.0001 for soil-diggers).
Position and scattering of the four ecological groups: Aphodiinae dwellers (AD), Scarabaeinae tunnellers (ST), Scarabaeinae rollers (SR) and Geotrupinae tunnellers (GT) in the plane (1–2) of CA for sampled sites LES and MES (details in the text).

Significant differences between values with Wilcoxon-Mann-Whitney test: a, b, c, d, g: P<0.05; e, f: P<0.0001.
Distance between species in the plane (1–2) of CA.
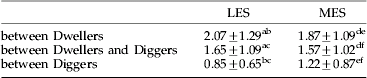
Significant differences between values with Wilcoxon-Mann-Whitney test: a, b, c, e: P<0.0001; d, f: P<0.001.
Discussion
The pool of dung beetle species in southern Europe is one of the most equitably divided between soil-diggers (mainly Scarabaeinae) and dung-dwellers (Hanski & Cambefort, Reference Cambefort, Hanski and Cambefort1991b; Lumaret & Kirk, Reference Lumaret, Kirk, Hanski and Cambefort1991; Lobo & Davis, Reference Lobo and Davis1999). Scarabaeinae are thermophilous, declining in abundance towards the north; and, in southern regions, they constitute the bulk of assemblages. Heterogeneity of climatic and edaphic conditions generates several patterns in their diversity (Lumaret & Kirk, Reference Lumaret, Kirk, Hanski and Cambefort1991), with a high rate of species turnover across habitats; the regional biodiversity of dung-dwellers is based on their sensitivity to environmental conditions (especially microclimatic conditions often controlled by the vegetation structure), whereas Scarabaeinae fauna is more homogeneous among habitats and well adapted to open and warm habitats (Lobo et al., Reference Lobo, Sanmartín and Martín-Piera1997; Lobo & Martín-Piera, Reference Lobo and Martín-Piera1999).
With a species/specimens ratio higher than 0.004 for each site, the present inventory proved to be efficient (Wassmer, Reference Wassmer1994; Galante et al., Reference Galante, Mena and Lumbreras1995; Finn et al., Reference Finn, Gittings and Giller1998 and references therein; Errouissi et al., Reference Errouissi, Haloti, Jay-Robert, Janati-Idrissi and Lumaret2004). The sampled species corresponded to 65% and 72% of the dung beetle faunas of the Garrigue and the Causse, respectively (Lumaret & Kirk, Reference Lumaret and Kirk1987). Over 75% of Aphodiinae species trapped at each site did not exceed one specimen per trap on average, while scarce species reached only 45% of the pool of soil-diggers (fig. 2). The occurrence of rare dung beetle species was certainly due to flows between different surrounding habitats. The extent of this phenomenon for Aphodiinae reflects the high sensitivity of this group to environmental heterogeneity (Lobo et al., Reference Lobo, Sanmartín and Martín-Piera1997; Lobo & Martín-Piera, Reference Lobo and Martín-Piera1999) and underlines once again the fact that the maintenance of Aphodiinae diversity requires the preservation of heterogeneity and connectivity among habitats, both at local and regional scales.
The 26 Aphodiinae species collected during the survey represented 48% of all dung beetles trapped, but only 28% of the French Aphodiinae fauna (Lumaret, Reference Lumaret1990; Lumaret et al., Reference Lumaret, Lobo and Jay-Robert1996; Bordat, Reference Bordat1999). Active Aphodiids were observed all year round at both sites. At low elevation (Garrigue site), summer drought with rapid desiccation of droppings prevented most dung-dwellers from breeding (Lumaret, Reference Lumaret, Roy, Aronson and di Castri1995). At higher elevation (Causse site), summer was still unfavourable, but winter represented a more constraining season. For most Aphodiinae species that are characterized by the free-ranging lifestyle of larvae inside the dung pats, frost and drought are limiting factors for larval development because in both cases water in dung pats becomes scarce, which prevents most species from feeding and being active (Landin, Reference Landin1961; Holter, Reference Holter2000). The drastic shortening of the main period of activity of Aphodiinae species observed at MES was well characterized by the standard deviation (SD) calculated for subfamilies; the SD ratio between Aphodiinae and Geotrupinae along the axis 1 of CA reached 5.4 for LES (1.19 vs. 0.22, respectively) but only 1.2 for MES (0.95 vs. 0.75, respectively). This shorter period of activity, which corresponds to reduced activity of beetles during the cold period, was related to a marked impoverishment of Aphodiinae fauna; six out of the 26 species observed in the Garrigue site were absent from the Causse site. Among these six species, five are thermophilous and active from spring to autumn (Lumaret, Reference Lumaret1990). Their absence at higher elevation is probably due to low temperature. The shorter period of activity was also related to reduced temporal segregation between species, which suggests that phenological requirements are not fixed and that plasticity could enhance the local diversity of Aphodiinae (Hanski, Reference Hanski, Hanski and Cambefort1991). On the other hand, no shortening in the activity period of Aphodiinae species (expressed by species SE) was observed because most species are univoltine (Landin, Reference Landin1961; Holter, Reference Holter1982), and the length of adult activity (from emergence to death) was related to their individual life history traits.
The summer activity of dung-dwellers was significantly lower at both sites (LES and MES) than observed in more temperate areas in Europe (Wassmer, Reference Wassmer1994; Gittings & Giller, Reference Gittings and Giller1997; Finn et al., Reference Finn, Gittings and Giller1999) and in mountains (Lumaret & Stiernet, Reference Lumaret, Stiernet, Hanski and Cambefort1991). Summer drought appears very restrictive, and one can assume that it could have affected the diversity of Aphodiinae in the French Mediterranean area (Lobo et al., Reference Lobo, Jay-Robert and Lumaret2004). Indeed, the main Aphodiinae hotspots forecasted by models in France are located under oceanic climate, which ensures optimal conditions for a truly all-year-round activity of these beetles (both mild winters and quite humid summers; Lobo et al., Reference Lobo, Jay-Robert and Lumaret2004).
Both spatial and temporal distribution of soil-diggers (Scarabaeinae and Geotrupinae) largely differed from that of dung-dwellers. While the fauna of dung-dwellers on the Causse appeared as a subset of the Garrigue fauna, almost half of the soil-diggers were observed at only one site (13 out of 28). The increase in elevation was accompanied by a slight increase of the soil-digger richness (20 species at LES vs. 23 species at MES). Geotrupid species were markedly more numerous at MES (5 species; ⩽14.5 beetles trap−1) than LES (2 species; ⩽1 beetle trap−1), and neither Geotrupes puncticollis nor Sericotrupes niger showed a high population level at LES (the Garrigue habitat is unfavourable to deep burrowing beetles, due to compact and dry soils). Both sites showed similar diversity in Scarabaeinae (18 species both rollers and tunnelers), with five species of their own. The 23 trapped species in the two sites represent more than 50% of the total fauna of Scarabaeinae (41 species) in France (Corsica excluded) (Lumaret, Reference Lumaret1990). The high dissimilarity between the two sites revealed the faunistic heterogeneity of southern France at regional scale (Lumaret 1978–Reference Lumaret1979) and may partly explain the high species richness of the Mediterranean region (Lobo et al., Reference Lobo, Lumaret and Jay-Robert2002). The geographical heterogeneity of this region, related to differences in climatic and edaphic conditions, may compensate the low Scarabaeinae species turnover among habitats (Lobo et al., Reference Lobo, Sanmartín and Martín-Piera1997; Lobo & Martín-Piera, Reference Lobo and Martín-Piera1999).
Neither Geotrupinae nor Scarabaeinae species were active all year round, each group showing a distinctive pattern of activity. Geotrupinae were mainly active in autumn, a period when most species reproduced. These large-bodied and long-lifetime beetles have a long maturation feeding period (Cambefort & Hanski, Reference Cambefort, Hanski, Hanski and Cambefort1991). Consequently, and in spite of their low abundance in traps, they showed the longest adult activity periods both in Garrigue and Causse sites (estimated by SE). Scarabaeinae showed an uneven monthly abundance. At both elevations, the optimal period of adults corresponded to late spring to early summer, with several new emergences of some species in autumn. Lumaret & Kirk (Reference Lumaret and Kirk1987, Reference Lumaret, Kirk, Hanski and Cambefort1991) showed that, for most species, the first peak of massive activity corresponded to the oviposition period. The second peak (in autumn after the first strong rains) corresponded to the new generation of beetles, most species overwintering as adults. During spring and summer, Scarabaeinae regularly dominated dung beetle assemblages at both sites (sometimes >90% of beetles). Their number was linked in part to subtle differences in the vertical use of the soil under dung pats, which facilitate the temporal coexistence of species. At both sites, the main soil-diggers active together showed different nesting requirements. Sisyphus schaefferi avoided the competition for space underneath pats when rolling away a dung ball. Tunnelers showed differences in the depth of their pedotrophic nest. At LES, Onthophagus lemur used the 4–12 cm level, whereas O. vacca at the same period nested at the 8–16 cm depth (Lumaret, Reference Lumaret1983, Reference Lumaret, Roy, Aronson and di Castri1995). At MES, O. joannae used the 2–9 cm level, permitting coexistence with O. lemur (Lumaret, unpublished).
Many soil-digger species overcame summer drought and several Scarabaeinae were active in August in the Causse site. Burying prevents desiccation of dung and allows more regular supplying both for adults and larvae. Winter was more drastic but, paradoxically, the break of this cold period was shorter at the Causse site than in the Garrigue site (1 vs. 7 months for Geotrupinae; 2 vs. 3 months for Scarabaeinae tunnellers). This extension of the adult activity period cannot be related to an extension in the activity period of species themselves nor high temporal differences between species. At both sites, soil-diggers showed a noticeable synchronism related to their physiological constraints. Geotrupinae were constrained by the length of their activity period (eight months for the two main species on the Causse) while Scarabaeinae showed a noteworthy strong similarity in their temporal distribution (Lumaret, Reference Lumaret1990; Wassmer, Reference Wassmer1994; Sowig, Reference Sowig1997). In each subfamily, the extension of the activity period of beetles in the colder site (Causse) was actually due to the occurrence of cold resistant species.
The monthly abundance of dung-dwellers and soil-diggers were not negatively correlated (Rs=0.51, P=0.03; Rs=0.28, P=0.31 at LES and MES, respectively), and at both sites Scarabaeinae and Aphodiinae showed highest diversity during the April–June period. At this period the number of coexisting dung-dwellers (e.g. 13 species in April at LES; 11 species in May at MES) was higher than observed values in northern Europe where soil-diggers were scarce and edaphic constraints (soil humidity) lower (Hanski, Reference Hanski, Hanski and Cambefort1991; Wassmer, Reference Wassmer1994; Wassmer, Reference Wassmer1995; Gittings & Giller, Reference Gittings and Giller1997; Finn et al., Reference Finn, Gittings and Giller1998, Reference Finn, Gittings and Giller1999). In addition, we showed that the phenological differences within Aphodiinae were always significantly higher than the seasonal differences between dung-dwellers and soil-diggers. This Aphodiinae time spacing, previously reported in central Europe (Wassmer, Reference Wassmer1994) and the Balearic Islands (Palmer, Reference Palmer1995), may be related to the highly variable moisture conditions experienced by Aphodiinae larvae in droppings (Landin, Reference Landin1961; Lumaret, Reference Lumaret1989, Reference Lumaret, Roy, Aronson and di Castri1995). This time spacing could also be induced by the diversification of the subfamily under a seasonal climate. Whatever the case, it constitutes a phylogenetically inherited character indicative that ecological interactions between guilds seemingly do not induce, at least under sub-Mediterranean conditions, a complete structuring of dung beetle assemblages similar to that observed in Afrotropical regions (Krell-Westerwalbesloh et al., Reference Krell-Westerwalbesloh, Krell and Lisenmair2004). The biological characteristics of soil-diggers (mostly small Onthophagus species) and the complexity of environmental conditions may not allow the establishment of competitive hierarchies among dung beetle guilds. Hence, in contrast to tropical regions (Krell-Westerwalbesloh et al., Reference Krell-Westerwalbesloh, Krell and Lisenmair2004), the different guilds show independent temporal dynamics.
Acknowledgements
We are very grateful to John Thompson (UMR 5175 Centre d'Écologie Fonctionnelle et Évolutive, Montpellier, France) who revised the English version of the manuscript.