Introduction
Studies of chewing lice (Phthiraptera: Amblycera, Ischnocera) on feral pigeons (Columba livia Gmelin, Aves: Columbidae) and woodpeckers (Aves: Picidae) have shown species-specific levels of average abundance and also specific levels of stability in their population parameters, even when different species inhabit the same host, subject to the same year-to-year fluctuations in environmental conditions (Galloway and Lamb Reference Galloway and Lamb2014; Lamb and Galloway Reference Lamb and Galloway2018). The 10 species studied so far have relatively stable populations, measured as temporal population variability (PV, Heath Reference Heath2006), with PV = 0.51 ± 0.03 (standard error) on a scale of 0–1 (Galloway and Lamb Reference Galloway and Lamb2014, Reference Galloway and Lamb2015b; Lamb and Galloway Reference Lamb and Galloway2018). In comparison, populations of other taxa of insects exhibit higher levels of temporal PV: aphids (Hemiptera: Aphididae) – 0.70 ± 0.05, n = 5 (Lamb and MacKay Reference Lamb and MacKay2010; Lamb et al. Reference Lamb, MacKay and Alyokhin2011, Reference Lamb, MacKay and Wool2012); beetles (Coleoptera) – 0.64 ± 0.03, n = 14 (Lamb and Boivin Reference Lamb and Boivin2017a; Lamb et al. Reference Lamb, Bannerman and Costamagna2019); and flies (Diptera) – 0.57 ± 0.04 (Lamb and Boivin Reference Lamb and Boivin2017a, Reference Lamb and Boivin2017b). Chewing lice on owls (Aves: Strigiformes) exhibit differences in their population processes from lice studied previously: a weak relationship between abundance and host mass and no seasonal pattern of abundance (Lamb and Galloway Reference Lamb and Galloway2019). Furthermore, analyses of infestation parameters of chewing lice on owls suggest that populations of some species have higher levels of variability than observed for lice on other hosts (Galloway and Lamb Reference Galloway and Lamb2015a, Reference Galloway and Lamb2017; Lamb and Galloway Reference Lamb and Galloway2016, Reference Lamb and Galloway2019). The dynamics of louse populations on owls might challenge the generalisation that chewing lice have more stable populations than other insect taxa.
To assess whether or not population stability for chewing lice on owls is higher than for other hosts, we here describe the dynamics of louse populations on great horned owl (Bubo virginianus (Gmelin), Aves: Strigidae) over 22 years (1994–2015). Three species of lice occur on the owls: Kurodaia magna Emerson (Phthiraptera: Amblycera: Menoponidae), Strigiphilus oculatus (Rudow), and Strigiphilus syrnii (Packard) (Phthiraptera: Ischnocera: Philopteridae) (Galloway and Lamb Reference Galloway and Lamb2019). A large sample of great horned owls (n = 262) was available for this study, a small proportion of which had extremely high louse populations. We compare data for great horned owls to those for lice studied previously on other taxa of hosts, to determine whether the populations of lice on great horned owls do indeed show lower levels of stability than other populations of chewing lice.
Materials and methods
Great horned owls were salvaged from Manitoba Sustainable Development (previously Manitoba Conservation), and rehabilitation hospitals at the Wildlife Haven (Manitoba Wildlife Rehabilitation Organization, Ⓘle des Chênes, Manitoba, Canada) and Prairie Wildlife Rehabilitation Centre (Winnipeg and St. Adolphe, Manitoba, Canada). Great horned owls were processed as described in detail by Galloway and Lamb (Reference Galloway and Lamb2014, Reference Galloway and Lamb2016, Reference Galloway and Lamb2019). Juvenile and adult great horned owls were both considered because they have similar numbers of lice and are often difficult to distinguish (Lamb and Galloway Reference Lamb and Galloway2019), but the few chicks that were sampled had no lice and were excluded. Lice were collected by washing birds twice in warm soapy water and once in clean water (Mironov and Galloway Reference Mironov and Galloway2002). The washing method removes nearly the entire population of lice infesting the host, except the majority of eggs (Clayton and Drown Reference Clayton and Drown2001; T.D.G., personal observation). Voucher specimens of lice were slide-mounted (Richards Reference Richards1964) or preserved in 70% or 95% ethanol, and deposited in the J.B. Wallis/R.E. Roughley Museum of Entomology, Department of Entomology, University of Manitoba (Winnipeg, Manitoba, Canada).
The following data were recorded for each individual bird: host species, collection date, numbers of adult females and males, and number of nymphs for each louse species (Galloway and Lamb Reference Galloway and Lamb2019). Hosts were acquired over 22 years, 1994–2015 (only one bird was collected in 2000 and this year was excluded from the time series). These data were used to estimate mean annual values of population parameters: abundance – number of lice per bird; prevalence – the proportion of birds infested; mean intensity – the mean number of lice on infested birds (Rósza et al. Reference Rósza, Reiczigel and Majoros2000); sex ratio – the ratio of males to females; the ratio of nymphs to females as an index of reproductive success (Galloway and Lamb Reference Galloway and Lamb2019). Standard errors are provided to allow ready comparison among means, as these means are averages of means and therefore normally distributed.
Relationships among annual fluctuations in parameters of abundance for different louse species were assessed by Pearson’s product-moment correlations (SYSTAT Software 2009). Trends in the population parameters for each louse species were assessed by linear regression of annual estimates against year (SYSTAT Software 2009). The regression coefficients from these analyses were used to quantify one aspect of population stability, with the degree of instability increasing with the size of the coefficient defining the slope. Persistence, the proportion of years a louse species was detected in the population, was considered a second aspect of population stability. A third aspect of stability was temporal variability, of annual abundance, mean intensity and prevalence, quantified by the metric PV (Heath Reference Heath2006). Population variability was calculated as a mean of the absolute values of differences for all pairs of annual estimates, where each difference was divided by the larger estimate for each pair (Heath Reference Heath2006). The result was a proportion from 0 to 1; a low value characterises low PV and high stability. This metric is particularly suitable for comparisons among species, because PV is measured on the same scale, regardless of mean abundance, and there is no assumption that estimates of population parameters are distributed normally.
Although 262 great horned owls were available to investigate louse populations, given the length of the study, 22 years, and the vagaries of host collection, some years had relatively few hosts to provide precise estimates of population parameters. This source of sampling error might affect estimates of correlation and regression coefficients as well as PV. An effect of low sample size was observed previously for PV (Galloway and Lamb Reference Galloway and Lamb2015b). To assess the effects of sampling error resulting from variation in sample size, PV values were estimated for prevalence and mean intensity by drawing samples of birds (5, 10, 15, 20, 25, and 30) at random from the population of collected birds (n = 262). The process was repeated 21 times for each sample size, to mimic the length of the actual time series. The resulting values for PV estimated the effect of host sample size on the combined variation from year-to-year variation and from sampling error.
The relative importance of sampling error for estimates of temporal variation in mean intensity was investigated further, by partitioning variance in intensity by one-way analysis of variance, into a component attributable to year and the residual sampling error. Intensity was not normally distributed for either louse species and so was log-transformed. The analysis was conducted on the whole sample of birds and all years, and also on a reduced sample, excluding birds with extreme numbers of lice (more than twice the mean intensity) and years with 1–3 birds. The investigation of the contribution of sampling error to annual variation was complicated by the aggregated distribution of louse abundance among birds. The level of aggregation was assessed and measured using the index of discrepancy, D (Poulin Reference Poulin1993), calculated using QPweb (Reiczigel et al. Reference Reiczigel, Marozzi, Fábián and Rózsa2019).
Results
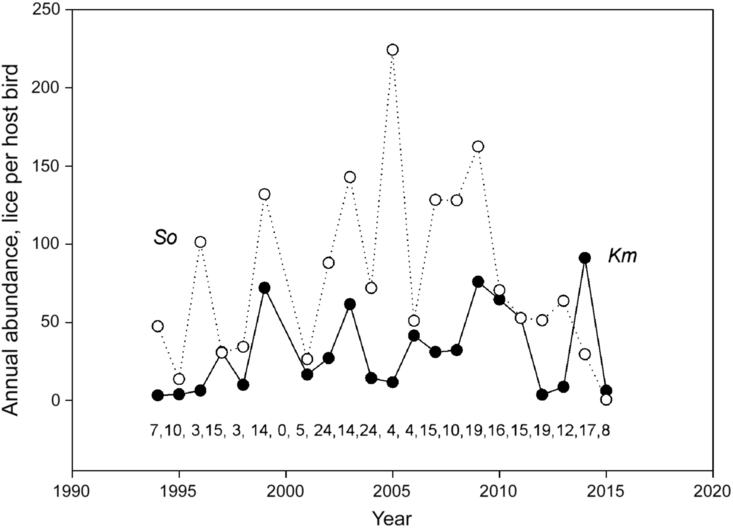
From 1994 to 2015, Strigiphilus oculatus (128 ± 32 lice per host bird per year, n = 21, ± standard error) was about twice as abundant as K. magna (67 ± 29) (Fig. 1). A third species, S. syrnii, occurred too infrequently to be considered further (found on five of 262 birds over four years during the study). The patterns of annual change in abundance of the lice were partitioned into prevalence and mean intensity (recall that abundance = prevalence × mean intensity). The overall difference in abundance between species was due primarily to prevalence, which was almost twice as high for S. oculatus (0.871 ± 0.033) as for K. magna (0.473 ± 0.038), whereas mean intensity was only 12% higher for the former (156 ± 38) than the latter (139 ± 58). In contrast, year-to-year changes in abundance for both species were due primarily to annual fluctuations in mean intensity, with little contribution from annual variation in prevalence (Table 1).
Annual mean abundance of two louse species infesting great horned owls over 22 years. The numbers of hosts collected each year are given above the x-axis. Seven of 262 birds with more than 1000 lice were deleted from mean annual abundance to better reveal annual changes. Km, Kurodaia magna; So, Strigiphilus oculatus.

Pearson correlation coefficients (probability level, n = 21 years) for the relationships between mean annual abundance, prevalence and mean intensity for the chewing lice, Kurodaia magna and Strigiphilus oculatus on great horned owls.

No consistent relationship in year-to-year abundance was detected between S. oculatus and K. magna. Although abundance for the two species was weakly related when all years were considered (r = 0.45, P = 0.04, n = 21 years), this relationship was due to sampling error for years when few birds were collected (< 10), and particularly to extreme values for two birds with louse intensities over 800 per host for K. magna and over 1000 for S. oculatus. When the low sample years and two outlier birds were excluded, there was no detectable relationship in year-to-year variation in abundance for the two louse species (r = 0.19, P = 0.52, n = 14 years).
Annual sex ratios (males to females) were near one for K. magna (0.96 ± 0.17) and female biased for S. oculatus (0.77 ± 0.04). The two species had nymph to female ratios of 3.7 ± 0.36 and 3.3 ± 0.29 to 1, respectively. For K. magna, neither sex nor nymph to female ratios were related to abundance (r = −0.14 − −0.18, P > 0.45, n = 21 years). For S. oculatus, also, sex ratio was not related to abundance (r = 0.26, P = 0.27, n = 20 years), but nymph to female ratios were related to abundance and mean intensity (r = 0.45 − 0.49, P < 0.04, n = 20). Similar patterns were observed for individual birds, with no relationship between intensity and sex ratio for either species (r = −0.02 − −0.05, P > 0.65, n = 75–158 birds), or nymph to female ratio for K. magna(r = −0.08, P = 0.52, n = 75 birds). A relationship was detected between intensity and nymph to female ratio for S. oculatus (r = 0.21, P < 0.01, n = 158 birds).
Neither K. magna nor S. oculatus showed significant trends (P > 0.05) in abundance, prevalence, or mean intensity over the 22-year time series, and both species were present each year. The PVs of abundance for the two species were similar, over 0.6, close to those for mean intensity, and relatively high compared with prevalence (Table 2). Population variability for sex ratio and nymph to female ratio were similar to those for prevalence (Table 2).
Population variability (see text) of annual population parameters for chewing lice on great horned owls over 21 years.

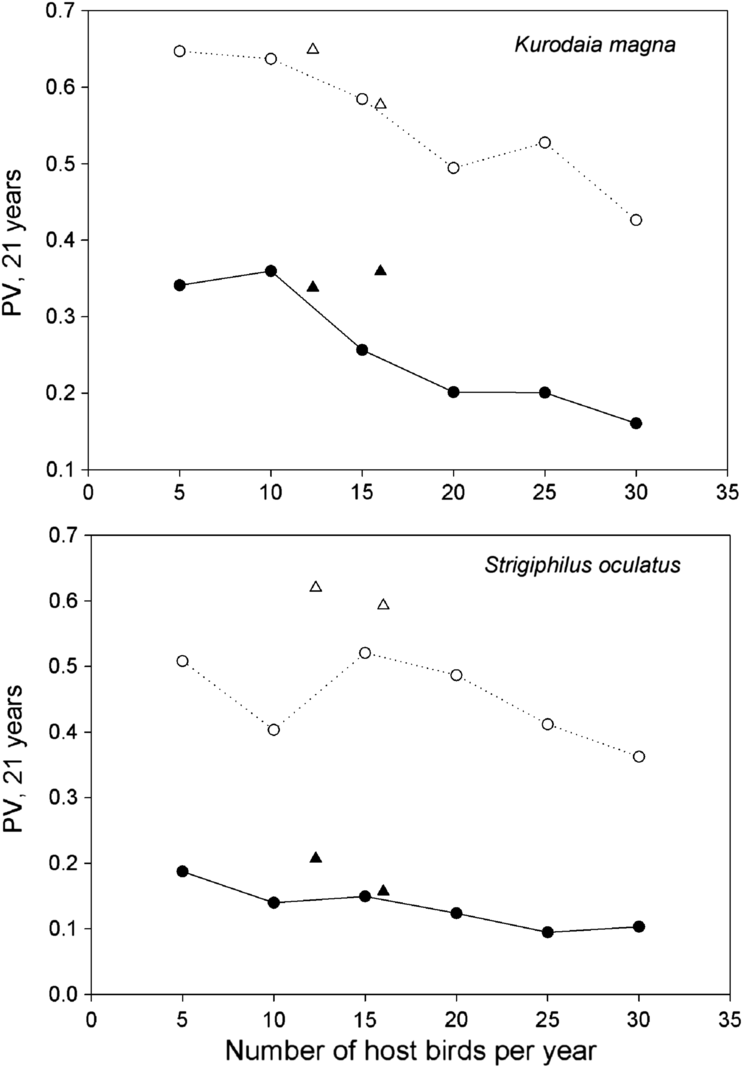
When 21 samples of birds (equivalent to the number of years in the time series) were selected at random from the total sample (n = 262), the resulting values of PV declined with sample size, for both prevalence and mean intensity (Fig. 2). Population variability measured the variation due to temporal variation among years plus that due to sampling error. The actual values of PV for temporal variation using the full time series of 21 years (mean of 12.3 birds sampled per year), or 14 years with samples of > 10 birds per year (mean of 16.0 birds sampled per year), were consistently higher, but not much higher, than values for combined sampling error and temporal variation (Fig. 2). Based on the continued decline of PV with increasing sample size, sampling error contributed substantially to estimates of temporal variability (Fig. 2).
Population variability (see text) for prevalence (solid circles) and mean intensity (open circles) for two species of lice infesting great horned owls over 21 hypothetical years, with estimates based on samples of host birds (5, 10, 15, 20, 25, 30 birds) drawn at random from the whole sample of birds collected (n = 262). Estimates of PV for the recorded annual parameters are shown as triangles, for the whole sample of birds over 21 years, and for a reduced sample of years with higher numbers of birds collected per year. PV, population variability.

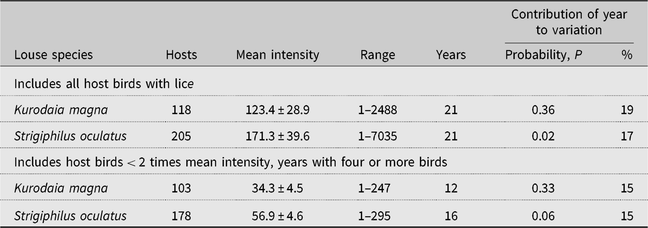
For prevalence, a sample of 30 birds reduced PV by about 50% to 0.09–0.16, compared with the PV for the actual time series of annual prevalence (Fig. 2), leaving little variation in prevalence that could be attributed to temporal variation. For mean intensity, however, a sample of 30 birds reduced PV to about 0.4 (Fig. 2). Variation in mean intensity (log-transformed, because the distributions were not normal) was partitioned between year-to-year variation and sampling error. Year accounted for 19% for K. magna and 17% for S. oculatus of the variation in mean intensity, with more than 80% due to sampling error (Table 3).
Variation in log-transformed intensity for chewing lice on great horned owls partitioned by analysis of variance into a contribution for year and for sampling error.

Data for all birds are compared with a subsample of birds excluding those with the highest infestations of lice, and years when few hosts were collected (< 4 host birds per year).
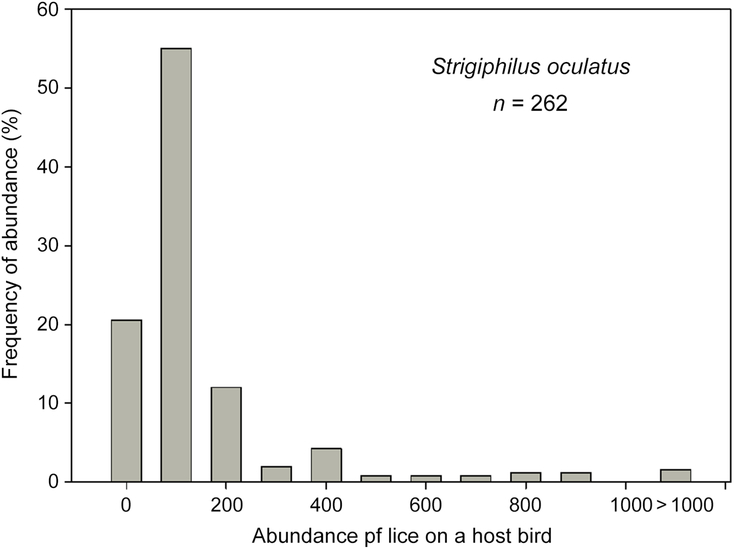
The nonnormality of the distribution of lice among birds was characterised by a preponderance of low-intensity infestations and a long tale of extreme intensities (Fig. 3). The distributions were highly aggregated with indices of discrepancy (D) for K. magna of 0.90 (0.88–0.93, 95% confidence interval based on bootstrapping with 1000 replicates) and for S. oculatus of 0.81 (0.75–0.88). Such aggregated populations would have increased the effects of sampling error particularly in years with few hosts. To assess the effect of birds with extremely high louse intensity on sampling error, analyses were repeated for a subset of hosts, eliminating those with intensities more than twice the mean (about 13% for both louse species) and years with low samples of birds (Table 3). Eliminating these hosts reduced mean intensities by about 70%, in comparison with the whole sample (Table 3). One-way analyses of variance on log-transformed intensities detected no significant differences among years for either species, leaving only 15% of the variation attributable to year (based on sums of squares) (Table 3). The birds with extreme infestations certainly contributed to the apparent year-to-year variation in mean intensity, but only slightly (by 2–4%) (Table 3). Over 80% of the apparent temporal variation (PV) in annual mean intensity was due to sampling error, even when highly infested birds were excluded. Therefore, temporal variability for mean intensity as well as prevalence was relatively low for both species of lice on great horned owls.
Frequency distribution of louse abundance for the chewing louse, Strigiphilus oculatus, on great horned owls. A second species of louse, Kurodaia magna, occurring on the same host, had a distribution with a similar shape and so is not shown.

Discussion
Mean annual abundances for two species of lice infesting great horned owls were the highest recorded among 12 species of lice studied in Manitoba (Galloway and Lamb Reference Galloway and Lamb2014, Reference Galloway and Lamb2015b; Lamb and Galloway Reference Lamb and Galloway2018), as expected given the large body size of their host (Rózsa Reference Rózsa1997; Galloway and Lamb Reference Galloway and Lamb2017; Lamb and Galloway Reference Lamb and Galloway2019). Unexpectedly, the temporal variabilities for K. magna and S. oculatus were similar and high. In previous studies, lice on the same host showed species-specific PV and species with high abundance tended to have lower PV than less abundant species. As observed previously for chewing lice (Galloway and Lamb Reference Galloway and Lamb2014, Reference Galloway and Lamb2015b; Lamb and Galloway Reference Lamb and Galloway2018), most of the temporal variation in louse abundance on great horned owls was accounted for by mean intensity rather than prevalence. Kurodaia magna and S. oculatus did show species-specific differences in PV for some population parameters, particularly prevalence and sex ratio, but were more similar than previously studied lice within multispecies louse communities on the same host.
The relatively high PV (> 0.6) for abundance and mean intensity for lice on great horned owls implied high temporal variation for these populations. This result proved misleading, however. High values of PV were largely due to sampling error with only 15% of variation in louse intensity attributed to year-to-year differences, and the remainder due to sampling error. Thus, a more accurate estimate of PV for mean intensity is 0.1 (15% of 0.65). This estimate comes with the caveat that no method of directly partitioning PV into temporal variation and sampling error has been established, as is available for variances. This is the first time the contribution of sampling error to temporal PV has been estimated. The lowest previously observed values of PV for mean intensity were 0.3 for two species of lice on feral pigeons (Galloway and Lamb Reference Galloway and Lamb2014), which suggests that temporal variation for mean intensity of lice on great horned owls is, in fact, remarkably low. Values of PV for louse prevalence on great horned owls at 0.21 and 0.34 were close to the average (0.28) of those observed for bird lice in Manitoba (Galloway and Lamb Reference Galloway and Lamb2014, Reference Galloway and Lamb2015b; Lamb and Galloway Reference Lamb and Galloway2018).
A characteristic of louse populations on host birds is a highly aggregated distribution of lice on individual birds (Galloway and Lamb Reference Galloway and Lamb2014, Reference Galloway and Lamb2015b, Reference Galloway and Lamb2016, Reference Galloway and Lamb2019). The aggregated distributions may arise because a proportion of the population of hosts develops large populations of lice naturally, and these birds are collected in roughly the same proportion as they occur in nature. High mean intensities on great horned owls resulted from the washing technique used for collecting lice from birds (Clayton and Drown Reference Clayton and Drown2001). Other studies with apparently low intensities of lice on owls have relied on visual searching of live birds or feather ruffling of small samples of dead birds, which often collect relatively few of the lice that are present and small numbers of nymphs (see Galloway and Lamb Reference Galloway and Lamb2019). Alternatively, the extreme intensities on some owls may arise from the way they were collected, as euthanised specimens from wildlife rehabilitation centres. Birds with high louse populations may be in poor condition and more likely to be captured by the public and then brought to wildlife rehabilitation centres. Alternatively, louse populations on injured birds may expand rapidly. Populations of lice do rise when pigeon bills are manipulated to reduce a host’s ability to preen (Clayton et al. Reference Clayton, Moyer, Bush, Jones, Gardiner, Rhodes and Goller2005), which may also be the case for injured birds of other species in captivity. The latter possibility is unlikely for the great horned owls in this study because the vast majority of specimens were euthanised soon after they were collected, because they were too seriously injured to be rehabilitated. Other methods for collecting hosts, traditionally shooting or mist netting, have not been tested to assess whether they provide random samples in relation to louse abundance. As we do not know the actual distribution of louse abundance in wild great horned owls, we consider the whole sample of great horned owls, with the caveat that birds with high numbers of lice may be over-represented in the sample.
Small samples of hosts are a common problem for such studies (Galloway and Lamb Reference Galloway and Lamb2014, Reference Galloway and Lamb2015b, Reference Galloway and Lamb2016, Reference Galloway and Lamb2019). For great horned owls, at least 30 host specimens per year are required for prevalence and even more for mean intensity, to estimate PV with high precision. These numbers are difficult to achieve given current standards for sacrificing wild birds for study, and the limited number of some species of injured wild birds brought to wildlife rehabilitation centres by the public.
Aggregated distributions of lice aggravate the problem of small annual sample size (Shaw and Dobson Reference Shaw and Dobson1995; Rékási et al. Reference Rékási, Rózsa and Kiss1997; Poulin Reference Poulin2007). For lice on great horned owls studied here, the indices of aggregation, D, were at the high end of values observed for parasites studied (Poulin Reference Poulin1993). The high populations on some hosts greatly affected mean intensity, reducing estimates to a third or less when owls with extreme infrapopulations were excluded. However, the effect of high-intensity specimens on PV was much less, increasing the apparent contribution of year to temporal variability from 15–17 or 19%. The skewed distribution of lice on birds provides a challenge for estimating population parameters with precision, especially given the difficulty in obtaining large samples of wild hosts. Heavily infested birds are clearly present in the host population. They arrived at the wildlife hospitals in this condition, perhaps a reflection of these large-bodied hosts being able to survive for long periods of failing health, which allows time for numbers of chewing lice to increase exponentially. Perhaps, more importantly, we know little about the biological importance of the few birds with high-intensity populations. The probability of transmission from these heavily infested hosts is likely high if there is appropriate contact with suitable conspecifics. However, it is possible these hosts are dead ends for their lice, dying before any significant transmission can occur. As it is unknown the extent to which lice on these highly infested birds contribute to the overall population structure, especially prevalence of infestation, we have retained them in this study. Until more is known about the ecological factors that cause the aggregated distributions, the role of the high-intensity infrapopulations in the dynamics of louse populations is uncertain.
We conclude that populations of lice on great horned owls are stable, with low temporal variability, no trends in abundance, and high persistence over the 22 years of this study. This high stability, particularly low temporal variability, is consistent with observations on chewing louse populations studied previously, supporting the contention that the life history strategy of chewing lice results in more stable population dynamics than the other taxa of insects for which population stability has been studied.
Acknowledgements
We especially thank the staff at the rehabilitation hospitals of the Wildlife Haven and the Prairie Wildlife Rehabilitation Centre for the care with which they handled the birds for this study; thanks to Manitoba Conservation (now Manitoba Sustainable Development) Wildlife Branch for issuing scientific permits over the duration of this study. We thank Dave Holder, Lisa Babey, Chérie Dugal, and the many students who helped by washing birds. This research was funded in part by Discovery Grants to T.D.G. from the Natural Sciences and Engineering Council of Canada and by Manitoba Conservation (Sustainable Development Initiatives Fund). We are grateful for the continued support of the Department of Entomology and the Faculty of Agricultural and Food Sciences at the University of Manitoba.