I. INTRODUCTION
To extend the lifespan of mechanical systems, wear and consequently, friction must be minimized. Liquid-phase lubricants featuring a variety of additives are typically used toward this end in macroscopic mechanical systems. On the other hand, traditional liquid-based lubrication schemes fail in nano- and micro-scale systems comprising mobile components due to increasing surface-to-volume ratios and the associated enhancement in physical effects such as surface tension.Reference Urbakh, Klafter, Gourdon and Israelachvili1,Reference Hsu2 As such, research efforts in recent years have been aimed at identifying candidates for solid lubricants to be used in nano- and micro-scale mechanical systems and characterizing related structural and tribological properties.
Among various candidates for solid lubricants, the two-dimensional material graphene is of particular importance not only due to its outstanding electricalReference Novoselov, Geim, Morozov, Jiang, Zhang, Dubonos, Grigorieva and Firsov3 and mechanicalReference Lee, Wei, Kysar and Hone4 properties, but also because it constitutes the essential building block of bulk graphite, a widely-used solid lubricant in a variety of macroscopic applications.Reference Berman, Erdemir and Sumant5 Consequently, based on its promise as a single-atom-thick solid lubricant consisting of a sheet of carbon atoms arranged in a honeycomb pattern, the nanotribological properties of graphene have been investigated via several studies in the literature.Reference Filleter, McChesney, Bostwick, Rotenberg, Emtsev, Seyller, Horn and Bennewitz6–Reference Paolicelli, Tripathi, Corradini, Candini and Valeri13 In particular, nanotribological characterization of single- and multi-layer graphene samples obtained via mechanical exfoliation has revealed a layer-dependent frictional behavior, with the friction values observed via atomic force microscopy (AFM) decreasing monotonously with increasing number of layers.Reference Lee, Li, Kalb, Liu, Berger, Carpick and Hone8 This finding has been explained by the so-called puckering effect that involves the enhanced build-up of graphene in front of the scanning probe at small number of layers (owing to reduced out-of-plane stiffness), which leads to increased friction. On the other hand, for graphene samples grown epitaxially on SiC, friction was also measured via AFM, and it was found that bi-layer graphene demonstrated lower friction than both single-layer graphene and bulk graphite samples.Reference Filleter, McChesney, Bostwick, Rotenberg, Emtsev, Seyller, Horn and Bennewitz6 These findings have been partially explained by an electron–phonon coupling mechanism.
While the nanotribological properties of mechanically-exfoliated and epitaxially-grown graphene samples are of great interest from a fundamental point of view, limitations associated with sample size (for mechanically-exfoliated graphene) and transfer possibilities onto different substrates (for epitaxially-grown graphene) limit the related application potential. On the other hand, high quality single- and multi-layer graphene of sufficient dimensions for practical applications can be grown on metal substrates, such as nickel and copper, via the method of chemical vapor deposition (CVD),Reference Reina, Jia, Ho, Nezich, Son, Bulovic, Dresselhaus and Kong14,Reference Li, Cai, An, Kim, Nah, Yang, Piner, Velamakanni, Jung, Tutuc, Banerjee, Colombo and Ruoff15 which is typically followed by transfer onto substrates such as silicon oxide (SiO2) for further characterization of, e.g., electrical and mechanical properties. When it comes to the characterization of nanotribological properties of CVD-grown graphene, there are only a limited number of studies available in the literature: Egberts et al. have studied the nanotribological properties CVD-grown graphene on copper foils (i.e., pre-transfer), with the main discovery that friction forces on graphene patches exhibit hysteretic behavior with changing normal load.Reference Egberts, Han, Liu, Johnson and Carpick12 On the other hand, Fessler et al. have studied the effect of plasma-hydrogenation on nanotribological behavior of CVD-grown graphene on SiO2 substrates.Reference Fessler, Eren, Gysin, Glatzel and Meyer11 Moreover, Kim et al. used a probe in the shape of a fused silica lens to investigate the friction and adhesion properties of CVD-grown graphene transferred onto SiO2 substrates.Reference Kim, Lee, Lee, Lee, Jang, Ahn, Kim and Lee9 Very recently, Paolicelli et al. have studied the frictional properties of graphene grown by CVD on Ni(111) substrates and contrasted the results with mechanically-exfoliated graphene samples on SiO2.Reference Paolicelli, Tripathi, Corradini, Candini and Valeri13
Motivated by the discussion above, we present in this article a comprehensive structural and nanotribological characterization of single-layer, CVD-grown graphene transferred onto SiO2 substrates. Graphene films are grown on copper foils via CVD of methane (CH4) and subsequently transferred onto SiO2 substrates. Structural and morphological properties of graphene samples are characterized using optical microscopy, scanning electron microscopy (SEM), Raman spectroscopy, and AFM. The nanotribological properties of CVD-grown graphene samples transferred onto SiO2 substrates are studied via AFM under ambient conditions using calibrated probes, by recording the evolution of friction force with increasing normal load. In particular, and in contrast to the available literature, the potential influence of using (i) different probes and (ii) post-transfer cleaning procedures on nanotribological behavior is investigated. Additionally, a new method of analyzing lubrication performance aimed at eliminating the role of the probe on nanotribological measurements that involves the evaluation of the ratio of friction coefficients of graphene and SiO2 is introduced. Lastly, a comparison of lubrication performance of CVD-grown graphene with mechanically-exfoliated graphene is presented and the effect of wrinkles on measured friction values is quantitatively examined.
II. EXPERIMENTAL DETAILS
A. Sample preparation
1. Graphene growth on copper foils via CVD
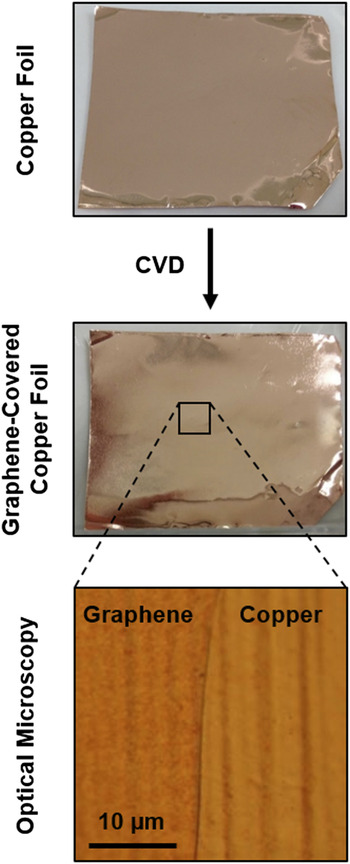
Copper and nickel foils are widely used as catalysts for the CVD growth of graphene. Due to significant differences in the solubility of carbon in the two materials (0.001% for copper versus 0.1% for nickel), the growth mechanism differentiates for copper and nickel substrates such that graphene grown on nickel features a large amount of multilayer regions,Reference Reina, Jia, Ho, Nezich, Son, Bulovic, Dresselhaus and Kong14 whereas CVD-growth on copper performed by the deposition of CH4 at elevated temperatures (∼1000 °C) results in almost uniform coverage of the substrate by single-layer graphene.Reference Li, Cai, An, Kim, Nah, Yang, Piner, Velamakanni, Jung, Tutuc, Banerjee, Colombo and Ruoff15 As the aim of the present study is to characterize the nanotribological properties of single-layer graphene samples, CVD growth on copper has been preferred. Specifically, 25 µm thick copper foil with 99.8% purity (Alfa Aesar 13382, Lancashire, United Kingdom) has been chosen, in accordance with the literature.Reference Li, Cai, An, Kim, Nah, Yang, Piner, Velamakanni, Jung, Tutuc, Banerjee, Colombo and Ruoff15 The foil has been cut in dimensions of 35 mm × 50 mm, cleaned via subsequent baths in acetone and isopropanol, dipped into a diluted chloric acid solution (10 mL HCl, 90 mL water) to remove surface oxide, and cleaned again via distilled water. The cut and cleaned copper foil pieces are then placed into the quartz tube furnace (Alser Teknik/ProTherm, Ankara, Turkey) used for the CVD process. At the start of the CVD process, the copper foils were annealed at 1000 °C under a reducing flow of Ar/H2 gas mixture (95:5) at 200 sccm for 30 min to remove any remaining copper oxide and to increase the average grain size. After thermally annealing the copper foil, graphene growth was initiated with the introduction of CH4 into the quartz tube at a typical flow rate of 25 sccm for 20 min. The heating was then turned off, and the graphene-covered copper foil was taken out of the furnace after cooldown to room temperature. Photographs showing the change in the appearance of a representative copper foil after CVD growth of graphene are provided in Fig. 1, together with a high-resolution optical microscopy image of the graphene-covered copper foil surface that demonstrates the conformal coverage of graphene on the topographical features of the foil.
Photographs of a copper foil before and after CVD-growth of graphene, together with an optical microscopy image of a partially graphene covered region.

2. Transfer of CVD-grown graphene onto SiO2 substrates
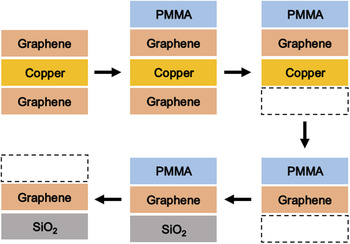
As the next step in sample preparation, graphene films grown via CVD on copper foils have been transferred onto SiO2 substrates, for eventual structural and nanotribological characterization. Toward this purpose, a sacrificial carrier layer of poly(methyl methacrylate) (PMMA) has been utilized, in accordance with established procedures in the literature.Reference Li, Cai, An, Kim, Nah, Yang, Piner, Velamakanni, Jung, Tutuc, Banerjee, Colombo and Ruoff15 The whole transfer procedure took place in a class 100 cleanroom. In particular, during the transfer procedure, (i) one side of the graphene-covered copper foil is spin-coated with PMMA (950K A2), (ii) the PMMA is cured at 110 °C for 15 s on a hot plate, (iii) a diluted nitric acid solution (5 mL HNO3, 15 mL water) is used to etch away the graphene on the side of the copper foil that is not covered by PMMA, and (iv) a 1 M solution of ammonium persulfate is utilized at 70 °C to etch away the copper foil, leaving behind a strip of PMMA covered with CVD-grown graphene on one side. Subsequently, the PMMA strip is placed on a clean SiO2 wafer piece, and the PMMA is removed via dipping the sample into acetone. The individual steps of the transfer procedure are summarized in Fig. 2.
The process flow associated with the transfer of CVD-grown graphene onto SiO2, as described in detail in the main text.

3. Post-transfer cleaning of CVD-grown graphene
Placing the PMMA-graphene stack in a still bath of acetone is often not sufficient to remove the whole PMMA layer from graphene—residues are commonly observed, even with the resolution provided by optical microscopy. To remove PMMA residues, various strategies have been suggested in the literature, ranging from using glacial acetic acid as a solvent,Reference Her, Beams and Novotny16 to thermal annealing under vacuum,Reference Pirkle, Chan, Venugopal, Hinojos, Magnuson, McDonnell, Colombo, Vogel, Ruoff and Wallace17 as well as in the presence of gases such as Ar,Reference Hu, Wei, Ago, Jin, Xia, Luo, Pan and Liu18 Ar/H2,Reference Dan, Lu, Kybert, Luo and Johnson19 CO2,Reference Gong, Floresca, Hinojos, McDonnell, Qin, Hao, Jandhyala, Mordi, Kim, Colombo, Ruoff, Kim, Cho, Wallace and Chabal20 and N2.Reference Jang, Kim, Kim, Shin, Kim and Choi21 Despite intensive efforts involving high temperatures and extended annealing times, it is typically observed that PMMA residues are never entirely removed from the graphene surface.Reference Skakalova and Kaiser22 To evaluate the potential influence of post-transfer cleaning on the nanotribological properties of CVD-grown graphene, two different methods of cleaning have been utilized in the present study: (i) short (20 s) ultrasonic baths of acetone followed by isopropanol and alternatively, (ii) annealing at 300 °C for 2 h under Ar gas flow in a quartz tube furnace.
B. Structural characterization
Before a comprehensive nanotribological characterization of CVD-grown graphene on SiO2 substrates is performed, the structural/morphological quality of the samples needs to be investigated and the single-layer character needs to be confirmed. Accordingly, in this work, optical microscopy (Carl Zeiss Axio Imager.A2m, Thornwood, New York) has been used to confirm the overall coverage of graphene on copper foils and SiO2, SEM (FEI Quanta 200 FEG, Hillsboro, Oregon, typically operated at 10 kV) has been used to microscopically analyze the presence of structural defects including tears and folds, and Raman spectroscopy (WITec Alpha300 S, Ulm, Germany, equipped with a 532 nm solid-state laser) has been utilized to confirm the single-layer character of graphene samples.Reference Ferrari, Meyer, Scardaci, Casiraghi, Lazzeri, Mauri, Piscanec, Jiang, Novoselov, Roth and Geim23 Lastly, AFM (PSIA XE-100, Suwon, Korea) in contact-mode has been used for detailed topographical characterization to (i) independently check single-layer character by measuring the height of graphene on SiO2, (ii) detect the potential existence of contaminants, such as PMMA residues, and (iii) image structural defects such as wrinkles that are not straightforward to resolve using other methods such as SEM.
C. Nanotribological characterization
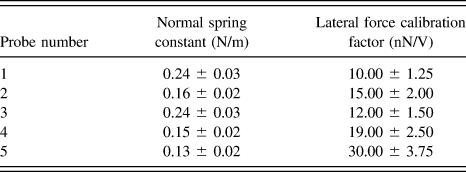
To measure the nanotribological properties of graphene, the AFM instrument has been operated in the so-called friction force microscopy mode which allows the recording of the lateral forces experienced by the probe apex during contact-mode scanning of the sample surface.Reference Mate, McClelland, Erlandsson and Chiang24 The measurements have been performed under ambient conditions and a total of five silicon probes (Nanosensors PPP-CONTR, Neuchatel, Switzerland) have been utilized as force sensors. To precisely detect the normal and lateral forces experienced by the probes, normal spring constant (k) and lateral force calibration factor (α) values have been determined for each probe via calibration procedures described by Sader et al.Reference Sader, Chon and Mulvaney25 and Varenberg et al.,Reference Varenberg, Etsion and Halperin26 respectively (Table I). The half-width of friction loops formed by lateral forces in the forward and backward scanning directions has been used to determine friction force (F f) values.Reference Schwarz, Koster and Wiesendanger27 In particular, the determination of the lateral force calibration factor α (that relates the voltage output of the AFM instrument due to the change in the horizontal position of the laser spot on the four-quadrant photodiode caused by the torsional twisting of the cantilever to the lateral forces acting on the probe) involves the calculation of the half-width and offset of friction loops recorded on the sloped faces of a commercial calibration grating (MikroMasch TGF11, Sofia, Bulgaria) as a function of normal load and the utilization of force equilibrium arguments (for more details, see Ref. Reference Varenberg, Etsion and Halperin26).
Normal spring constants (k) and lateral force calibration factors (α) of AFM probes used for nanotribological characterization.

III. RESULTS AND DISCUSSION
A. Structural properties of CVD-grown graphene on SiO2 substrates
1. Structural investigation via optical microscopy and SEM
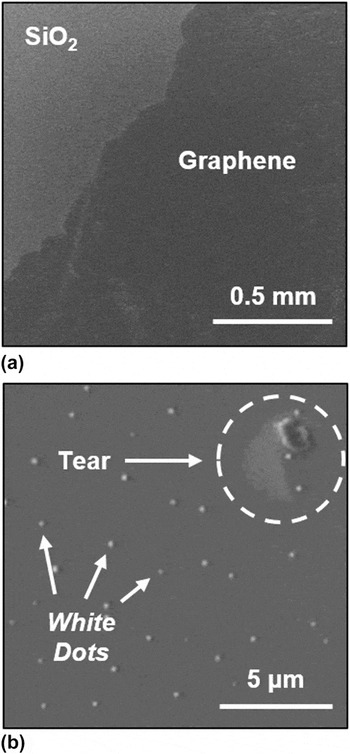
Single-layer graphene samples can be detected via optical microscopy when placed on silicon wafers covered with ∼300 nm thick SiO2.Reference Novoselov, Geim, Morozov, Jiang, Zhang, Dubonos, Grigorieva and Firsov3 Consequently, optical microscopy has been used as the first step in the present study to detect and confirm the presence of CVD-grown graphene on SiO2 substrates post-transfer. While optical microscopy readily confirms large-scale coverage (millimeters and above) of SiO2 substrates by transferred graphene films, the spatial resolution is not sufficient to detect the presence of all structural defects such as tears and folds that frequently occur during transfer. As such, the next step in structural characterization of graphene films has involved imaging via SEM. Figure 3(a) shows the general appearance of CVD-grown graphene transferred onto SiO2 substrates via a large-scale SEM image that independently confirms the successful transfer of extended graphene films onto SiO2 substrates. Moreover, SEM images with higher resolution are utilized to investigate the presence of structural defects and contaminants in the transferred graphene films. For instance, Fig. 3(b) shows the morphology associated with a tear and additionally demonstrates the presence of contaminants in the form of small white dots on graphene samples that are occasionally encountered. While determining the exact chemical nature and origin of these contaminants is beyond the scope of the present study, energy dispersive x-ray spectroscopy indicates that oxygen is involved, supporting the idea that the white dots comprise copper oxide that originates from the foils used for CVD growth.Reference Celebi28
(a) Large-scale SEM image confirming the transfer of extended graphene films onto SiO2. (b) Higher-resolution SEM image showing a tear in the transferred film as well as the occasional presence of contaminants in the form of white dots.

2. Confirmation of single-layer character via Raman spectroscopy
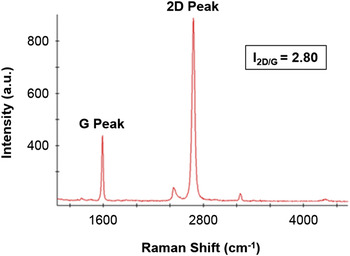
Raman spectroscopy is frequently used to characterize the structure and chemistry of single- and multi-layer graphene.Reference Ferrari, Meyer, Scardaci, Casiraghi, Lazzeri, Mauri, Piscanec, Jiang, Novoselov, Roth and Geim23 Specifically, the number of layers of graphene samples can be precisely determined by detecting the relative intensities of the characteristic 2D and G peaks (I 2D/G), such that I 2D/G values of ≥2, ∼1, and <1, are expected for single-layer, bi-layer, and multi-layer graphene samples, respectively. Figure 4 presents a typical Raman spectrum obtained on a CVD-grown graphene sample transferred onto SiO2. While the I 2D/G value of 2.80 is clearly indicative of the single-layer character, it should be mentioned that there is considerable variability in measured I 2D/G values between different graphene samples, and even for spectra obtained on the same graphene sample at different locations such that I 2D/G values between 2.50 and up to 5.50 have been recorded for the graphene films investigated in the present study. The observation of I 2D/G values significantly higher than 3.00 can be tentatively attributed to the presence of partially-suspended regions of transferred graphene films on SiO2.Reference Berciaud, Ryu, Brus and Heinz29
Representative Raman spectrum of a CVD-grown graphene sample transferred onto SiO2.

3. Structural investigation via AFM
As already mentioned, AFM is particularly useful for graphene research in detecting the topographical height of graphene samples on SiO2 and in observing structural defects and chemical contaminants with high resolution. In particular, thanks to the high spatial resolution of the method, AFM can be readily used to detect wrinkles on CVD-grown graphene samples that arise during the cool-down step of the CVD process due to the substantial difference in the thermal expansion coefficients of graphene and copper, leading to a build-up of in-plane stress in graphene and consequently, wrinkling.Reference Li, Cai, An, Kim, Nah, Yang, Piner, Velamakanni, Jung, Tutuc, Banerjee, Colombo and Ruoff15
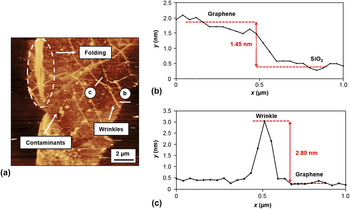
A representative topographical AFM image of a region of the SiO2 substrate partially covered by graphene is provided in Fig. 5(a). It is observed that the graphene film features a number of structural defects including folds, and a substantial number of wrinkles. Moreover, the presence of contaminants (potentially, PMMA residues) on the graphene film is detected, which leads to occasional streaks in the AFM image due to the probe laterally manipulating the residues. Clearly, the high spatial resolution provided by the AFM method allows the investigation of graphene morphology and cleanliness in much higher detail when compared to optical microscopy and SEM. Figures 5(b) and 5(c) show topographical height profiles over the graphene–SiO2 boundary and over a representative wrinkle, respectively. The height of the transferred graphene with respect to the SiO2 substrate is measured as ∼1.45 nm, in line with certain values reported in the literature.Reference Chung, Shen, Cao, Jauregui, Wu, Yu, Newell and Chen30 Moreover, the height of a representative wrinkle with respect to the graphene surface is observed as ∼2.80 nm. A statistical analysis of wrinkle heights conducted via AFM on transferred graphene samples provides a mean value of 1.99 nm with a standard deviation (SD) of 0.87 nm. Finally, it should be indicated that no substantial change in the morphology and improvement in the cleanliness of transferred graphene samples is detected via AFM after both variants of post-transfer cleaning, confirming reports in the literature that currently used methods aiming at removing PMMA residues are not entirely successful.Reference Skakalova and Kaiser22
(a) Topographical AFM image of CVD-grown graphene on SiO2, demonstrating in high resolution the presence of defects such as a fold and wrinkles on the graphene surface, as well as contaminants. (b) Representative height profile of the boundary between graphene and SiO2. (c) Representative height profile of a wrinkle on graphene. The height profiles in (b) and (c) have been recorded along the white lines designated with the letters “b” and “c” in (a), respectively.

B. Nanotribological properties of CVD-grown graphene on SiO2 substrates
1. Dependence of friction forces measured on CVD-grown graphene, wrinkles, and the SiO2 substrate on normal load
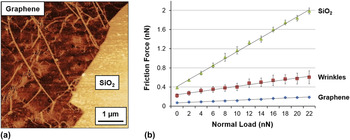
Friction forces (F f) recorded on CVD-grown graphene, increased friction forces encountered at wrinkles, as well as friction forces recorded on the SiO2 substrate have been investigated as a function of normal load (F n) in the present study. A representative friction force map and corresponding results of F f versus F n measurements acquired with a single AFM probe are provided in Fig. 6. The SiO2 substrate exhibits the highest absolute F f values, followed by wrinkles and CVD-grown graphene. The lubrication properties of CVD-grown graphene on the SiO2 substrate become apparent, as a significant reduction in absolute F f values. The increase in F f values measured on wrinkles is attributed to the associated abrupt change in topography, in accordance with the so-called ratchet effect.Reference Sundararajan and Bhushan31 Please note that this is in contrast to previous observations of reduced friction on wrinkles of CVD-grown graphene patches on Cu foils which were attributed to multilayer character arising from a “fold-over” geometry at the wrinkle edges.Reference Egberts, Han, Liu, Johnson and Carpick12
(a) Representative friction force map of CVD-grown graphene on SiO2. (b) The dependence of friction force on normal load for graphene, wrinkles, and the SiO2 substrate, together with linear fits. The error bars for measurements on graphene and SiO2 have been determined by considering the standard deviation in friction forces measured on multiple regions of a given friction force map, while the error bars for the measurements on wrinkles have been determined by considering friction forces measured on 10 individual wrinkles. Data acquired with a single probe.

It is observed that the data in Fig. 6(b) can be fit reasonably well in a linear fashion. To eliminate the effect of potentially different degrees of adhesion exhibited by the SiO2 substrate when compared to CVD-grown graphene on measured F f values, tribological properties may be quantified by the slopes of linear fits applied to the data, to determine friction coefficients (μ). While the data presented in Fig. 6(b) already demonstrates that not only absolute F f values, but also μ values are significantly lower on CVD-grown graphene when compared to SiO2 (μGraphene: 0.006 ± 0.001, μWrinkle: 0.018 ± 0.002, and  ${\mu _{{\rm{Si}}{{\rm{O}}_2}}}$: 0.072 ± 0.003); a related, comprehensive analysis of lubrication properties of CVD-grown graphene is presented in Sec. III. B. 5.
2. Effect of using different probes on friction
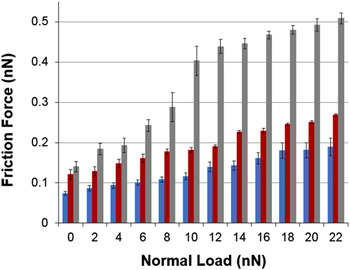
It is well known that the specific nanoscale structure and chemistry of AFM probes affect measured friction force values significantly.Reference Szlufarska, Chandross and Carpick32 As such, several different probes have been used to perform the friction force measurements presented here. The results of F f versus F n experiments conducted on CVD-grown graphene with three different probes (probes 1–3) are presented in Fig. 7. It is observed that a significant degree of variability is present in measured F f values from one probe to another, with Probe 2 generally exhibiting the highest friction. To eliminate the effect of using different probes on a rational evaluation of the lubrication properties of CVD-grown graphene, ratios of friction coefficients measured for CVD-grown graphene and SiO2 substrates  $\left( {{{\mu _{{\rm{Graphene}}} } \mathord{\left/ {\vphantom {{\mu _{{\rm{Graphene}}} } {\mu _{{\rm{SiO}}_2 } }}} \right. \kern-\nulldelimiterspace} {\mu _{{\rm{SiO}}_2 } }}} \right)$ have been determined for each probe and consequently averaged to obtain figures of merit for lubrication in Sec. III. B. 5.
The dependence of friction force on normal load on CVD-grown graphene for three different probes (Probe 1: blue, Probe 2: red, and Probe 3: gray).

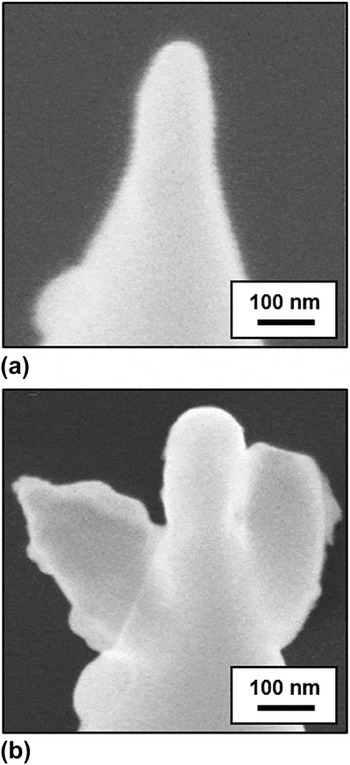
It should be noted that certain degradations associated with tip apexes may occur during the measurements, sometimes resulting in appreciable enlargement of the apex radius and/or contamination by, e.g., post-transfer chemical residues on the sample surface. For instance, the significant increase in F f observed for Probe 3 in Fig. 7 after 18 nN may be attributed to such a structural/chemical change. To evaluate whether significant degradation of probe apexes has occurred during the AFM measurements, SEM images of selected probe apexes have been acquired before and after each experiment. It has been observed that the apex radii have increased from 50 to 70 nm, from 25 to 45 nm, and from 55 to 65 nm for probes 1–3, respectively. A comparison describing a particularly severe degradation involving Probe 3 is depicted in Fig. 8. Such degradations of sliders are expected to also occur during potential practical implementations of CVD-grown graphene as a solid lubricant. The approach involving the calculation of 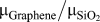 ${{\mu _{{\rm{Graphene}}} } \mathord{\left/ {\vphantom {{\mu _{{\rm{Graphene}}} } {\mu _{{\rm{SiO}}_2 } }}} \right. \kern-\nulldelimiterspace} {\mu _{{\rm{SiO}}_2 } }}$ ratios discussed above allows a meaningful evaluation of lubrication performance under such conditions, as well.
SEM images of a specific probe apex (Probe 3) (a) before and (b) after AFM measurements, demonstrating significant degradation.

3. Effect of different post-transfer cleaning procedures on friction
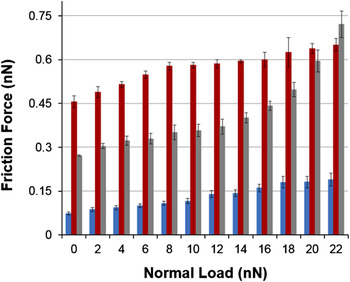
Two post-transfer cleaning procedures have been optionally applied on CVD-grown graphene samples transferred onto SiO2 substrates: (i) ultrasonic baths in acetone and isopropanol and (ii) Ar-gas annealing. Subsequently, the effect of post-transfer cleaning on the tribological behavior of CVD-grown graphene has been investigated (Fig. 9). It is observed that the Ar-gas-cleaned sample exhibits the highest absolute friction force values, followed by the ultrasonic-cleaned sample, with the as-transferred graphene sample exhibiting the lowest friction forces. It should be indicated that, from this comparison alone, it is not possible to determine the origin of the increase in absolute friction values as the cleaning procedure itself, and not structural/chemical changes in the probe apex that may occur during the experiments. To be able to make rational conclusions regarding this aspect, the previously mentioned approach involving the calculation of 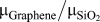 ${{\mu _{{\rm{Graphene}}} } \mathord{\left/ {\vphantom {{\mu _{{\rm{Graphene}}} } {\mu _{{\rm{SiO}}_2 } }}} \right. \kern-\nulldelimiterspace} {\mu _{{\rm{SiO}}_2 } }}$ ratios for multiple probes needs to be used.
The dependence of friction force on normal load on CVD-grown graphene for as-transferred (blue), ultrasonic-cleaned (red), and Ar-gas-cleaned (gray) graphene samples. Data acquired with a single probe.

4. Comparison with friction force measurements of mechanically-exfoliated graphene
While too small for most practical applications, the nanotribological properties of mechanically-exfoliated graphene have been nevertheless the subject of certain fundamental studies in the literature.Reference Lee, Li, Kalb, Liu, Berger, Carpick and Hone8 To determine whether there are significant differences in frictional behavior between single-layer, mechanically-exfoliated and single-layer, CVD-grown graphene, friction force maps have been recorded on both types of samples and comparative measurements of F f versus F n have been conducted (Fig. 10). The absence of wrinkles on the mechanically-exfoliated samples is noticeable. While absolute friction force values look very similar for the two graphene samples until a normal load of 18 nN (at which point the specific probe used in the measurements might have undergone a structural/chemical change, as discussed earlier), a thorough comparison of lubrication performance involving 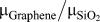 ${{\mu _{{\rm{Graphene}}} } \mathord{\left/ {\vphantom {{\mu _{{\rm{Graphene}}} } {\mu _{{\rm{SiO}}_2 } }}} \right. \kern-\nulldelimiterspace} {\mu _{{\rm{SiO}}_2 } }}$ ratios and multiple probes is provided in Sec. III. B. 5.
Representative friction force maps for (a) CVD-grown and (b) mechanically-exfoliated graphene samples. (c) The dependence of friction force on normal load for CVD-grown (blue) and mechanically-exfoliated (red) graphene. Data acquired with a single probe.

5. Lubrication performance of CVD-grown graphene on SiO2 substrates
Rather than comparing absolute friction force values, it is useful to employ friction coefficients (extracted from linear fits to F f versus F n data) in evaluating graphene's tribological properties, to eliminate the influence of differences in adhesion behavior between graphene and SiO2 substrates. Additionally, to eliminate the effect of (i) using AFM probes with different apex structure/chemistry, and (ii) potential changes in probe apex structure/chemistry during the experiments, it makes sense to determine ratios of friction coefficients between graphene and the substrate  $\left( {{{\mu _{{\rm{Graphene}}} } \mathord{\left/ {\vphantom {{\mu _{{\rm{Graphene}}} } {\mu _{{\rm{SiO}}_2 } }}} \right. \kern-\nulldelimiterspace} {\mu _{{\rm{SiO}}_2 } }}} \right)$ for each measurement, and obtain average values from results delivered by the different tips. Mean
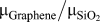 $\left {{{\mu _{{\rm{Graphene}}} } \mathord{\left/ {\vphantom {{\mu _{{\rm{Graphene}}} } {\mu _{{\rm{SiO}}_2 } }}} \right. \kern-\nulldelimiterspace} {\mu _{{\rm{SiO}}_2 } }}} \right$ values obtained in this fashion represent true figures of merit associated with the lubricative properties of graphene samples.
Based on the discussion above, 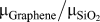 ${{\mu _{{\rm{Graphene}}} } \mathord{\left/ {\vphantom {{\mu _{{\rm{Graphene}}} } {\mu _{{\rm{SiO}}_2 } }}} \right. \kern-\nulldelimiterspace} {\mu _{{\rm{SiO}}_2 } }}$ ratios for CVD-grown graphene in three variants (as-transferred, ultrasonic-cleaned, and Ar-gas-cleaned) as well as mechanically-exfoliated graphene are provided in Table II, for (up to) five different probes, together with mean and standard deviation values. By studying the data, it is seen that graphene in all examined forms acts as a very good solid lubricant, reducing friction coefficients observed on SiO2 substrates by ∼90%. Among CVD-grown graphene samples, the as-transferred variety exhibits the highest mean lubrication performance (thus, the lowest
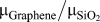 ${{\mu _{{\rm{Graphene}}} } \mathord{\left/ {\vphantom {{\mu _{{\rm{Graphene}}} } {\mu _{{\rm{SiO}}_2 } }}} \right. \kern-\nulldelimiterspace} {\mu _{{\rm{SiO}}_2 } }}$ ratio) and the mean lubrication performance drops slightly with ultrasonic cleaning, while Ar-gas-cleaned samples exhibit the lowest mean lubrication performance. It should be mentioned that a consideration of standard deviation values together with the mean values reported for as-transferred and ultrasonic-cleaned samples indicates that there is no statistically-significant difference in overall lubrication performance between the two varieties of graphene. On the other hand, Ar-gas-cleaned samples clearly exhibit a comparatively lower lubrication performance. A potential physical mechanism responsible for this effect could involve the thermal breakdown of PMMA residue trapped under the transferred graphene samples during annealing, leading to a wide distribution of trapped contaminants increasing average surface roughness and friction. Finally, it should be noted that while Raman spectroscopy has been previously used to successfully correlate the degree of fluorination of graphene samples to changes in frictional behavior,Reference Li, Liu, Kim, Shenoy, Sheehan, Robinson and Carpick33 no direct correlation between the “quality” of graphene samples (as inferred from I 2D/G values) and lubrication performance has been observed in our studies.
Friction coefficient ratios associated with graphene and SiO2 $\left( {{{\mu _{{\rm{Graphene}}} } \mathord{\left/ {\vphantom {{\mu _{{\rm{Graphene}}} } {\mu _{{\rm{SiO}}_2 } }}} \right. \kern-\nulldelimiterspace} {\mu _{{\rm{SiO}}_2 } }}} \right)$.

Our results also allow a comparison of the lubrication performance of CVD-grown and mechanically-exfoliated graphene samples. While it is seen that as-transferred CVD-grown graphene samples on average exhibit slightly better lubrication performance than exfoliated ones, the existence of wrinkles on CVD-grown graphene and the associated increase in friction should be taken into account (please note that the data for CVD-grown graphene presented in Table II have been acquired on regions free from wrinkles). In that respect, the extent to which wrinkles increase friction values on CVD-grown graphene (as-transferred, ultrasonic-cleaned, and Ar-gas-cleaned) is examined in Table III. As expected, wrinkles lead to a significant (about 3-fold) enhancement of local friction values on CVD-grown graphene samples, representing a considerable detriment to overall lubrication performance.
The ratios of friction forces measured on wrinkles to those on surrounding graphene  $\left( {{{F_{{\rm{f,wrinkle}}} } \mathord{\left/ {\vphantom {{F_{{\rm{f,wrinkle}}} } {F_{{\rm{f,graphene}}} }}} \right. \kern-\nulldelimiterspace} {F_{{\rm{f,graphene}}} }}} \right)$. Data averaged over 10 wrinkles and a normal load range of 0–22 nN for each measurement.

IV. CONCLUSIONS
A comprehensive characterization of nanoscale structural and tribological properties of CVD-grown, single-layer graphene transferred onto SiO2 substrates has been presented. To analyze lubrication performance, an approach involving the evaluation of friction coefficient ratios of graphene and SiO2 has been used. The effect of using different probes and employing different post-transfer cleaning procedures on frictional behavior has been studied. Results have shown that CVD-grown graphene acts as an effective solid lubricant on SiO2, leading to a reduction of ∼90% in the friction coefficients observed via AFM. While no significant difference in lubrication behavior has been found on wrinkle-free regions of CVD-grown graphene when compared to mechanically-exfoliated samples, it has been shown that wrinkles on CVD-grown graphene lead to a substantial (about 3-fold) increase in recorded friction values.
ACKNOWLEDGMENTS
The authors would like to thank Arda Balkancı, Kinyas Polat and Şahin Beşerik for practical help with various aspects of the experiments presented in this work. Financial support from the Outstanding Young Scientist Program of the Turkish Academy of Sciences (TÜBA-GEBİP) is gratefully acknowledged.